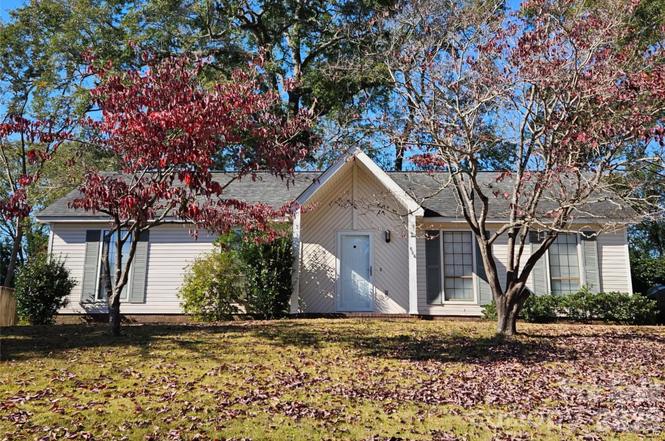
526 Hillcrest Dr · North Augusta, SC
Flood risk 1/10 · Minimal
- FEMA flood zone
- X (unshaded)
- Chance of flooding over 30 yrs
- 0.0%
- Est. flood insurance / yr
- $507 – $1,088
Fire risk 3/10 · Minor
- Est. fire insurance / yr
- $783 – $1,453
Heat risk 7/10 · Major
- Hot days now (above 107°F)
- 7 days/yr
- Hot days in 30 yrs
- 17 days/yr
Wind risk 6/10 · Moderate
- Chance of severe wind over 30 yrs
- 66.0%
Air-quality risk 3/10 · Minor
- Unhealthy air days now
- 3 days/yr
- Unhealthy air days in 30 yrs
- 4 days/yr
Risk factors via First Street. Map © Google.
Why this score? — see what drove the D grade
The composite is a weighted blend of 9 inputs, each scored 0–100. Each bar is that input's sub-score; the figure is the points it added to the 100-point composite (weight × sub-score).
- Cash flow +13.9/30.0
- ARV discount +6.7/15.0
- DSCR +4.2/10.0
- Livability +3.6/5.0
- Rent growth +3.5/5.0
- Schools +3.2/10.0
- 1% rule +2.6/10.0
- Condition / age +2.5/5.0
- Appreciation +0.0/10.0
$199,900
🖨 Deal sheet (PDF) 📄 Offer letter ✓ Due diligence
Listing remarks MLS
NEW CARPET, NEW INTERIOR PAINT, NEW VINYL, SP. FORMAL DINING ROOM, BRKFST. AREA KITCHEN, STORAGE BLDG.
Key facts
- Ample natural light
- Tranquil backyard
- Level lot
Tags
Property features AI
Finance
- HOA & community: No HOA; Pets allowed
Exterior
- Parking: Driveway
- Utilities: City water; Public sewer; Electric service
- Home design: Single-family residence; One story; Site-built construction; Vinyl exterior
- Construction: Crawl space foundation
- Exterior features: Concrete and paved road access; Publicly maintained road; 1-acre lot
Interior
- Kitchen: Dishwasher; Electric oven
- Bedrooms: 3 bedrooms on the main level
- Bathrooms: 2 full bathrooms on the main level
- Heating & cooling: Central heating; Central air conditioning
- Interior features: Den with a wood-burning fireplace; Exhaust fan; Room count: 2
- Laundry & utility: Washer and dryer inside; Electric water heater
Neighborhood map
What this means for you Summary
Snapshot
- This is a 3-bed/2.0-bath single-family listed at $200k.
Deal economics
- At list price, monthly cash flow is $23 ($271/yr) — positive.
- The deal already cash-flows at list — no discount required.
- To meet the 1% rule (rent ≥ 1% of price), the offer needs to be $151k (24.4% below list).
- Recommended offer: $151k (24.4% below list) — sets the bar for 1% rule.
- Cap rate 6.4% vs local median 3.9% in North Augusta — top-decile yield for the area; either an underpriced asset or a hidden risk that comps aren't pricing in. Stress-test before assuming the spread holds.
Location & tenants
- Location reads 71/100 on livability (#56 in SC) — a middle-class / working-renter tenant base. Strengths: crime A+, cost of living A+, housing A+; Watch: health & safety C-, amenities F, commute F.
- Aiken 01 (suburban): math 31% / reading 44% proficiency, ranked #36 of 80 in SC (top 45%) — families likely to look elsewhere, expect single-tenant / working-renter base with shorter leases.
- Zoned schools: Hammond Hill Elementary (math 51% / reading 48%, grade D, #168 of 597 statewide, top 31%, 677 students, 26% FRL); North Augusta Middle (math 35% / reading 45%, grade F, #78 of 229 statewide, top 35%, 616 students, 43% FRL); North Augusta High (math 51% / reading 86%, grade B, #68 of 196 statewide, top 35%, 1,719 students, 42% FRL) — zoned schools average 37% FRL vs 54% district-wide (17 pts lower); this property's tenant base skews higher-income than the district average.
- Zoned-school proficiency averages 53% at this address vs 38% district-wide (+15 pts) — the actual schools serving this property are materially stronger than the Aiken 01 average implies; a family-tenant draw the district grade alone would hide.
- Market conditions: Rents rising (+3.9%/yr); 363 active listings in the ZIP; 7 comparable units currently listed for rent nearby; rentals at typical pace (median 16d on market — plan ~3-4 weeks tenant-placement turnaround); 2,500 units permitted in Aiken County in 2024 (1,023 in 5+ unit buildings).
Forward outlook
- Local home prices are declining (-3.0%/yr); year-one equity from $1k of loan paydown is wiped out by about $6k of value loss. Plan a longer hold.
- Aiken County population projected at +9% by 2050 — modest demand growth; plan on rents tracking national, not racing it.
Negotiation context
- It's been on market 151 days — a 12% lower offer ($176k) is reasonable based on typical stale-listing flexibility.
- 2 sale attempts since 30y ago; this cycle's ask has dropped $40k (17%) from the opening price — seller is motivated, your offer sets the floor, not the list.
- Current owner paid $66k; list at $200k implies a 203% gain — meaningful room to come down on a strong offer.
Risks & watch-outs
- Climate carrying-cost: major wind risk, 66% chance of damaging wind over 30y; extreme-heat days projected 7→17/yr by 2055 (HVAC capex compounding) — expect insurance premiums to compound above CPI over the hold.
Questions for the listing agent
- It's been on market 151 days. Have you received any prior offers? Is the seller open to a 24% concession, seller financing, or rate buy-down credit?
- Why hasn't it sold? Are there any deal-killer items the seller is aware of (foundation, flood, title, zoning, code violations)?
- Is there a deadline driving the sale (1031 exchange, divorce, estate, relocation)? That informs how much negotiation room exists.
- The area grade is low — what's the realistic commute time and amenity access for the typical tenant pool here? Any planned neighborhood developments (good or bad) we should know about?
- What's the average days-on-market for RENTAL listings here right now (not sales)? A rising rental-DOM trend means longer vacancies and softer asking-rent achievability than the comps imply.
- What's the recent tenant-quality profile in this submarket — average credit score on applications, eviction rate, late-payment / NSF rate, and stable-employment percentage? A property-management company in the area should have these aggregated.
- How much new for-sale + rental construction is in the pipeline within 1–3 miles? Heavy new supply typically softens prices + rents 12–24 months out; constrained supply supports both.
Investment metrics
- 1% rule
- 0.76% ✗
- Cap rate
- 6.43%
- Cash-on-cash
- 0.48%
- DSCR
- 1.02
- GRM
- 11.0
CMA / ARV
- ARV (on-the-fly)
- $196,420
- Comps found
- 8
Show comp detail 8 sales within ~0.75 mi
| Address | Dist | Beds/Ba | Sqft | Sold | Price | $/sf | Match |
|---|---|---|---|---|---|---|---|
| 512 Hillcrest Ct | 0.08mi | 3/2.0 | 1,442 (+3%) | 3mo | $273,000 | $189 | 89 |
| 534 Hillcrest Dr | 0.07mi | 3/2.0 | 1,462 (+4%) | 5mo | $250,000 | $171 | 86 |
| 625 Hutchinson Dr | 0.35mi | 4/2.0 (+1) | 1,304 (-7%) | 1mo | $65,000 | $50 | 66 |
| 1005 Weston St | 0.53mi | 4/2.0 (+1) | 1,289 (-8%) | 9mo | $179,900 | $140 | 49 |
| 715 Mckenzie End | 0.63mi | 3/2.0 | 1,350 (-4%) | 18mo | $205,000 | $152 | 49 |
| 1014 Mckenzie St | 0.73mi | 3/1.5 | 1,298 (-8%) | 5mo | $168,750 | $130 | 47 |
| 1018 Skyview Dr | 0.61mi | 2/1.0 (-1) | 1,280 (-9%) | 9mo | $156,000 | $122 | 41 |
| 675 Seymour Dr | 0.66mi | 3/2.0 | 1,272 (-9%) | 21mo | $123,500 | $97 | 36 |
Match score weights: distance 35% · size 25% · config 20% · recency 20%. Top-matched comps best support the ARV.
Projected returns pro-forma
-3.0% appreciation · 3.94% rent growth · sell at horizon
- IRR
- -14.7%
- Equity multiple
- 0.47×
- Total profit
- $-29,615
- Equity at exit
- $29,806
- IRR
- -4.8%
- Equity multiple
- 0.67×
- Total profit
- $-18,326
- Equity at exit
- $17,284
Cash invested: $55,972 (down + closing). Projections, not guarantees.
Landlord ↔ Tenant lean methodology
- Overall (STATE)
- 90 Strongly Landlord-Friendly
- State South Carolina
- 90 Strongly Landlord-Friendly · R+6
- County
- — inherits STATE
- City
- — inherits STATE
ZIP-level market 29841
- Rents YoY
- 3.9%
- Active inventory
- 363
- Price-to-rent
- 11.0×
Monthly cashflow live
- Estimated rent
- $1,512 high interval (Pro) →
- Mortgage (P&I)
- −$1,048
- Tax from tax record
- −$40 /mo · $484/yr
- Insurance
- −$83
- HOA
- −$0
- Vacancy / Maint / Mgmt
- −$318
- Net cashflow
- $23
Break-even live
Sensitivity live
| Price | -10% $136 | -5% $79 | +0% $23 | +5% $-34 | +10% $-91 |
|---|---|---|---|---|---|
| Rent | -10% $-97 | -5% $-37 | +0% $23 | +5% $82 | +10% $142 |
| Rate | -1.0pp $123 | -0.5pp $73 | base $23 | +0.5pp $-29 | +1.0pp $-82 |
UW: 25.0% down · 7.5% · 30yr · 1.5% tax · 5.0% vac · 8.0% maint · 8.0% mgmt
Financing live
Cash to close
- Down payment
- $49,975
- Closing costs
- $5,997
- Reserves months
- —
- Total cash needed
- —
Loan-product check · same deal, 3 products live
Conventional
25% down · 7.5% · 30yr
- Down + closing
- —
- Monthly P&I
- —
- Monthly cashflow
- —
- DSCR
- —
- Eligible?
- —
Personal DTI + credit; lowest rate.
DSCR
20% down · 8.5% · 30yr
- Down + closing
- —
- Monthly P&I
- —
- Monthly cashflow
- —
- DSCR
- —
- Eligible?
- —
No personal income docs; deal must DSCR.
Hard money
10% down · 12.0% · 12mo
- Down + closing
- —
- Monthly P&I
- —
- Monthly cashflow
- —
- DSCR
- —
- Eligible?
- —
Short-term bridge; refi at stabilization.
Rent comps 7 comps
| Address | Beds | Baths | Sqft | Rent | $/sqft | DOM | Units | Dist |
|---|---|---|---|---|---|---|---|---|
| 160 Breckenridge Dr North Augusta, SC | 2.0 | 2.0 | 952 | $1,300 | $1.37 | 16d | 1 | 0.10mi |
| 735 Old Edgefield Rd North Augusta, SC | 3.0 | 1.5 | 1150 | $1,450 | $1.26 | 16d | 1 | 0.57mi |
| 1006 Skyview Dr North Augusta, SC | 2.0 | 1.0 | 960 | $1,400 | $1.46 | 23d | 1 | 0.63mi |
| 418 Lecompte Ave North Augusta, SC | 4.0 | 2.0 | 1456 | $2,000 | $1.37 | 23d | 1 | 1.11mi |
| 913 Old Edgefield Rd North Augusta, SC | 2.0 | 1.0 | 1020 | $1,400 | $1.37 | 25d | 1 | 1.19mi |
| 204-1/2 W Buena Vista Ave Unit 1 North Augusta, SC | 2.0 | 1.5 | 1024 | $1,375 | $1.34 | 16d | 1 | 1.47mi |
| 208 W Buena Vista Ave Unit 1 North Augusta, SC | 2.0 | 1.5 | 1024 | $1,375 | $1.34 | 16d | 1 | 1.48mi |
Listing history 18 events
-
2026-06-21days on market $199,900 Active 151 DOM
-
2026-06-18days on market $199,900 Active 148 DOM
-
2026-06-17days on market $199,900 Active 147 DOM
-
2026-06-16days on market $199,900 Active 146 DOM
-
2026-06-15days on market $199,900 Active 145 DOM
-
2026-06-14days on market $199,900 Active 143 DOM
-
2026-06-13days on market $199,900 Active 142 DOM
-
2026-06-10days on market $199,900 Active 140 DOM
-
2026-06-09days on market $199,900 Active 139 DOM
-
2026-06-08days on market $199,900 Active 138 DOM
-
2026-06-07statusdays on market $199,900 Active 137 DOM
-
2026-04-14status Pending
-
2026-04-04price $199,900
-
2026-03-19price $219,900
-
2025-12-02$239,900 Active
-
1996-11-22soldstatus $65,900 102-char remark
Show marketing remark (102 chars)
NEW CARPET, NEW INTERIOR PAINT, NEW VINYL, SP. FORMAL DINING ROOM, BRKFST. AREA KITCHEN, STORAGE BLDG.
-
1996-11-22soldstatus $65,900
Show marketing remark (102 chars)
NEW CARPET, NEW INTERIOR PAINT, NEW VINYL, SP. FORMAL DINING ROOM, BRKFST. AREA KITCHEN, STORAGE BLDG.
-
1996-10-23$65,900 102-char remark
Show marketing remark (102 chars)
NEW CARPET, NEW INTERIOR PAINT, NEW VINYL, SP. FORMAL DINING ROOM, BRKFST. AREA KITCHEN, STORAGE BLDG.
ⓘ Source: listings_history table (triggers on properties + properties_extension) + one-shot
backfill from property_details.listing_events for pre-trigger history.
Tax reassessment forecast SC · Resets to sale price
- Current annual tax
- $484 · $40/mo
- Projected year-2 tax
- $1,139 · $95/mo
- Expected delta
- +$656/yr (+$55/mo · 135.6%)
ⓘ Screening estimate from a state-policy table — verify with the county assessor before closing.
Climate risk First Street
- Flood 1/10 Low FEMA zone X (unshaded) · 0% chance over 30 yrs
- Wildfire 3/10 Moderate
- Heat 7/10 Severe 7 d/yr ≥107°F today · 17 d/yr by 30 yrs out
- Wind 6/10 Major 66% chance of damaging wind over 30 yrs
- Air quality 3/10 Moderate 3 unhealthy d/yr today · 4 by 30 yrs out
Nearby sold comps map
Loading sold comps map…
Walkable amenities ~0.75 mi
Loading nearby amenities…
Taxation est. · year 1
- Rental income
- $18,144
- − Mortgage interest
- −$11,198
- − Property taxes
- −$484
- − Insurance
- −$1,000
- − Repairs & maintenance
- −$1,452
- − Management
- −$1,452
- − Depreciation
- −$5,815
- Taxable loss
- −$3,255
- Est. tax savings @ 24.0%
- +$781
- After-tax cash flow
- $1,053/yr
For passive investors: Depreciation is non-cash, so a rental often shows a tax loss while cash-flowing — sheltering income. Rental losses are passive: they offset passive income freely, and up to $25,000/yr can offset ordinary (W-2) income if you actively participate and your MAGI is under $100k (phasing out to $0 by $150k); unused losses carry forward. On sale, claimed depreciation is recaptured at up to 25%, and gains may owe capital-gains tax (a 1031 exchange can defer both). Figures are a year-1 estimate at your 24.0% rate — not tax advice; consult a CPA.
Schools (NCES district)
- District
- Aiken 01
- NCES district ID
- 4500720
- Math proficiency
- 31% ▼ -11.00%
- Reading proficiency
- 44% ▼ -1.00%
- Median HH income
- $45,081
- Composite
- 31.91/100
- National rank
- #5857
- State rank
- #36 of 80 in SC
Livability — North Augusta
- Score
- 71/100
- State rank
- #56
- US rank
- #7190
Category grades
Schools grade is shown separately in the Schools card above.
Census & demographics
- Census place
- North Augusta, SC
- County
- Aiken County · 116,534 people
- City population
- 50,543
- Metro
- Augusta-Richmond County, GA-SC
- Population (ZIP)
- 32,342
- Household income
- $71,606
- Rent vs Own
- Severe rent burden
- 870.0
Population outlook (Aiken County) Hauer SSP2
- Today (2025)
- 178,003 people
- By 2030
- 182,876 · +2.7%
- By 2040
- 189,970 · +6.7%
- By 2050
- 193,840 · +8.9%
- By 2075
- 199,453 · +12.1%
- By 2100
- 192,403 · +8.1%
Race, ethnicity, and origin ACS 2023
- Neighborhood character
- Predominantly White (71%)
- Race & ethnicity
- White 71% Black 17% Hispanic / Latino 7% Two or more races 7%
- Hispanic origin (detail)
- Puerto Rican 2%
- Common ancestry
- Italian 3% Lithuanian 3% Serbian 2%
- Foreign-born
- 3% · Canada, Guatemala, Jamaica
- Languages at home
- 93% English-only · Spanish 5% French/Haitian/Cajun 1% Other Asian/Pacific 1%
Political lean MEDSL · Aiken
- 2024 margin
- Strong R (+25.9) · D 36.4% · R 62.2% · Other 1.4%
- 2008→2024 swing
- -1.9pp toward R · 2008: -24.0pp · 2024: -25.9pp
- All cycles
- 2024: R+25.9 2020: R+22.7 2016: R+27.5 2012: R+26.0 2008: R+24.0
Not yet ingested
- Civics
- —
Market trends
- HPI YoY
- ▼ -180.37%
- Current HPI
- 237.1442
- Rent YoY
- ▲ 3.94%
- Metro
- Augusta-Richmond County, GA-SC
- State GDP YoY
- ▲ 4.51%
- F500 in state
- 2
Industry mix (Fortune 500 HQ in SC)
| Industry | F500 HQs | Revenue |
|---|---|---|
| Packaging | 1 | $7B |
|
||
Price history
+203.3% since first listed7 events — show timeline
- 2026-04-14 Pending — CANOPYMLS as Distributed by MLS Grid
- 2026-04-04 Price Changed $199,900 CANOPYMLS as Distributed by MLS Grid
- 2026-03-19 Price Changed $219,900 CANOPYMLS as Distributed by MLS Grid
- 2025-12-02 Listed $239,900 CANOPYMLS as Distributed by MLS Grid
- 1996-11-22 Sold (Public Records) $65,900 Public Records
- 1996-11-22 Sold (MLS) $65,900 Hive MLS
- 1996-10-23 Listed $65,900 Hive MLS
Property tax history
+2.5%/yrLatest (2025): $484 · +0.0% YoY. Source: county tax records.
Cash-flow waterfall
monthlySold comps — $/sqft
last 12 mo · ≤1 miLoading sold comps…