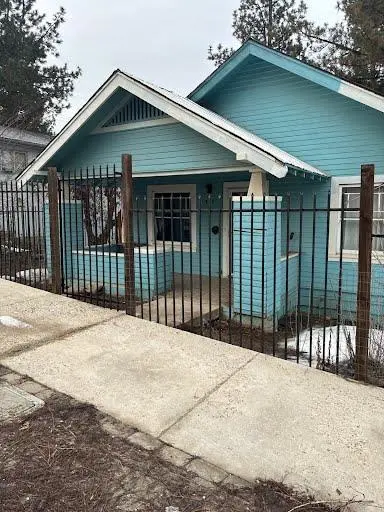
460 Nevada St · Portola, CA
Flood risk 1/10 · Minimal
- FEMA flood zone
- X (unshaded)
- Chance of flooding over 30 yrs
- 0.0%
- Est. flood insurance / yr
- $507 – $1,088
Fire risk 8/10 · Major
- Est. fire insurance / yr
- $659 – $1,223
Heat risk 3/10 · Minor
- Hot days now (above 86°F)
- 7 days/yr
- Hot days in 30 yrs
- 17 days/yr
Wind risk 1/10 · Minimal
- Chance of severe wind over 30 yrs
- —
Air-quality risk 10/10 · Severe
- Unhealthy air days now
- 33 days/yr
- Unhealthy air days in 30 yrs
- 36 days/yr
Risk factors via First Street. Map © Google.
Why this score? — see what drove the D grade
The composite is a weighted blend of 9 inputs, each scored 0–100. Each bar is that input's sub-score; the figure is the points it added to the 100-point composite (weight × sub-score).
- ARV discount +15.0/15.0
- Cash flow +11.3/30.0
- DSCR +3.3/10.0
- 1% rule +3.0/10.0
- Schools +2.8/10.0
- Livability +2.8/5.0
- Rent growth +2.5/5.0
- Condition / age +2.5/5.0
- Appreciation +0.0/10.0
$134,900
🖨 Deal sheet (PDF) 📄 Offer letter ✓ Due diligence
Listing remarks
Built in 1931, 460 Nevada St is a single-story home in Portola featuring 2 bedrooms and 1 bathroom, with approximately 1,092 square feet of living space on a 0.16-acre lot.
Key facts
- 6,970 sq ft lot
- Garage
- Built 1931
Property features AI
Finance
- HOA & community: No homeowners association
Exterior
- Parking: 1-car garage facing rear
- Utilities: Propane; 220V electric; Public water; Public sewer; No irrigation
- Home design: Detached single-family residence; Built in 1931
- Construction: Composition roof; Detached construction
- Exterior features: Regular-shaped lot; Composition roof
Interior
- Kitchen: Laminate counters
- Bedrooms: 2 bedrooms (main level)
- Flooring: Wood floors
- Bathrooms: 1 full bathroom with tub
- Heating & cooling: Central heating; Wood stove; No cooling
- Interior features: Attached deck off the living room; Single-story layout
- Laundry & utility: Laundry area in garage
Neighborhood map
What this means for you Summary
Snapshot
- This is a 2-bed/1.0-bath single-family listed at $135k.
Deal economics
- At list price, monthly cash flow is $-48 ($-581/yr) — negative.
- To cash-flow at today's rent, offer at most $126k (6.3% below list).
- To meet the 1% rule (rent ≥ 1% of price), the offer needs to be $108k (19.7% below list).
- Recommended offer: $108k (19.7% below list) — sets the bar for 1% rule.
Location & tenants
- Location reads 55/100 on livability (#851 in CA) — a working-class tenant base; expect higher turnover. Strengths: housing A, crime B+, cost of living B+; Watch: amenities F, commute F, employment D-.
- Plumas Unified (rural): math 21% / reading 44% proficiency, ranked #306 of 517 in CA (top 59%) — families likely to look elsewhere, expect single-tenant / working-renter base with shorter leases.
- Zoned schools: C. Roy Carmichael Elementary (346 students, 72% FRL); Quincy Junior/Senior High (math 22% / reading 47%, grade F, #618 of 1,170 statewide, top 56%, 340 students, 48% FRL) — zoned schools average 60% FRL vs 41% district-wide (20 pts higher); higher-poverty schools than district average — tighter screening recommended.
- Market conditions: 142 active listings in the ZIP; 39 units permitted in Plumas County in 2024 (0 in 5+ unit buildings).
Forward outlook
- Local home prices are declining (-3.0%/yr); year-one equity from $933 of loan paydown is wiped out by about $4k of value loss. Plan a longer hold.
- Plumas County population projected at -42% by 2050 — secular population decline; favor cash flow + early exit over multi-decade hold.
Negotiation context
- It's been on market 47 days — a 3% lower offer ($131k) is reasonable based on typical stale-listing flexibility.
Risks & watch-outs
- Watch-outs: built in 1931 — expect roof / HVAC / electrical / plumbing capex.
- Climate carrying-cost: severe wildfire risk — expect insurance premiums to compound above CPI over the hold.
Questions for the listing agent
- What do current leases actually rent for vs. the listed asking? Can we see a recent rent roll and the last 12 months of T-12 income?
- It's been on market 47 days. Have you received any prior offers? Is the seller open to a 20% concession, seller financing, or rate buy-down credit?
- Built in 1931 — when were the roof, HVAC, electrical panel, plumbing, and water heater last replaced?
- Is there a deadline driving the sale (1031 exchange, divorce, estate, relocation)? That informs how much negotiation room exists.
- Schools are D-rated, which usually means shorter tenancies and higher turnover. Who's the typical renter profile here, and what's been the actual vacancy rate?
- The area grade is low — what's the realistic commute time and amenity access for the typical tenant pool here? Any planned neighborhood developments (good or bad) we should know about?
- What's the average days-on-market for RENTAL listings here right now (not sales)? A rising rental-DOM trend means longer vacancies and softer asking-rent achievability than the comps imply.
- What's the recent tenant-quality profile in this submarket — average credit score on applications, eviction rate, late-payment / NSF rate, and stable-employment percentage? A property-management company in the area should have these aggregated.
- How much new for-sale + rental construction is in the pipeline within 1–3 miles? Heavy new supply typically softens prices + rents 12–24 months out; constrained supply supports both.
Investment metrics
- 1% rule
- 0.80% ✗
- Cap rate
- 5.86%
- Cash-on-cash
- -1.54%
- DSCR
- 0.93
- GRM
- 10.4
CMA / ARV
- ARV (median comp)
- $191,141
- List price
- $134,900
- Delta
- -29.42%
- Verdict
- UNDERPRICED
- Comps
- 20 within 1.0 mi
Show comp detail 6 sales within ~0.75 mi
| Address | Dist | Beds/Ba | Sqft | Sold | Price | $/sf | Match |
|---|---|---|---|---|---|---|---|
| 381 Second Avenue Ave | 0.16mi | 2/1.0 | 1,070 (-2%) | 10mo | $160,000 | $150 | 81 |
| 461 California Street St | 0.04mi | 2/2.0 | 1,063 (-3%) | 13mo | $150,000 | $141 | 79 |
| 565 Fifth Avenue Ave | 0.27mi | 2/1.0 | 1,097 (+0%) | 12mo | $215,000 | $196 | 76 |
| 361 Main Street St | 0.20mi | 2/1.0 | 1,050 (-4%) | 10mo | $204,000 | $194 | 76 |
| 265 N Beckwith Street St | 0.65mi | 2/1.0 | 1,066 (-2%) | 15mo | $62,000 | $58 | 53 |
| 804 Main St | 0.43mi | 3/2.0 (+1) | 1,232 (+13%) | 22mo | $257,500 | $209 | 32 |
Match score weights: distance 35% · size 25% · config 20% · recency 20%. Top-matched comps best support the ARV.
Projected returns pro-forma
-3.0% appreciation · 3.0% rent growth · sell at horizon
- IRR
- -18.8%
- Equity multiple
- 0.34×
- Total profit
- $-24,947
- Equity at exit
- $20,114
- IRR
- -11.3%
- Equity multiple
- 0.32×
- Total profit
- $-25,701
- Equity at exit
- $11,664
Cash invested: $37,772 (down + closing). Projections, not guarantees.
Landlord ↔ Tenant lean methodology
- Overall (STATE)
- 18 Strongly Tenant-Friendly
- State California
- 18 Strongly Tenant-Friendly · D+13
- County
- — inherits STATE
- City
- — inherits STATE
ZIP-level market 96122
- Home prices YoY
- -26.2%
- Active inventory
- 142
- Price-to-rent
- 10.4×
Monthly cashflow live
- Estimated rent
- $1,083 medium interval (Pro) →
- Mortgage (P&I)
- −$707
- Tax from tax record
- −$140 /mo · $1,685/yr
- Insurance
- −$56
- HOA
- −$0
- Vacancy / Maint / Mgmt
- −$227
- Net cashflow
- $-48
Break-even live
Sensitivity live
| Price | -10% $28 | -5% $-10 | +0% $-48 | +5% $-87 | +10% $-125 |
|---|---|---|---|---|---|
| Rent | -10% $-134 | -5% $-91 | +0% $-48 | +5% $-6 | +10% $37 |
| Rate | -1.0pp $19 | -0.5pp $-14 | base $-48 | +0.5pp $-83 | +1.0pp $-119 |
UW: 25.0% down · 7.5% · 30yr · 1.5% tax · 5.0% vac · 8.0% maint · 8.0% mgmt
Financing live
Cash to close
- Down payment
- $33,725
- Closing costs
- $4,047
- Reserves months
- —
- Total cash needed
- —
Loan-product check · same deal, 3 products live
Conventional
25% down · 7.5% · 30yr
- Down + closing
- —
- Monthly P&I
- —
- Monthly cashflow
- —
- DSCR
- —
- Eligible?
- —
Personal DTI + credit; lowest rate.
DSCR
20% down · 8.5% · 30yr
- Down + closing
- —
- Monthly P&I
- —
- Monthly cashflow
- —
- DSCR
- —
- Eligible?
- —
No personal income docs; deal must DSCR.
Hard money
10% down · 12.0% · 12mo
- Down + closing
- —
- Monthly P&I
- —
- Monthly cashflow
- —
- DSCR
- —
- Eligible?
- —
Short-term bridge; refi at stabilization.
Listing history 23 events
-
2026-06-22days on market $134,900 Active 47 DOM
-
2026-06-19days on market $134,900 Active 45 DOM
-
2026-06-18days on market $134,900 Active 44 DOM
-
2026-06-17price $134,900 Active 43 DOM
-
2026-06-17days on market $277,900 Active 43 DOM
-
2026-06-16days on market $277,900 Active 42 DOM
-
2026-06-15days on market $277,900 Active 41 DOM
-
2026-06-14days on market $277,900 Active 39 DOM
-
2026-06-13days on market $277,900 Active 38 DOM
-
2026-06-10days on market $277,900 Active 36 DOM
-
2026-06-09days on market $277,900 Active 35 DOM
-
2026-06-08days on market $277,900 Active 34 DOM
-
2026-06-07days on market $277,900 Active 33 DOM
-
2026-06-05days on market $277,900 Active 30 DOM
-
2026-06-03days on market $277,900 Active 29 DOM
-
2026-06-02days on market $277,900 Active 28 DOM
-
2026-06-01days on market $277,900 Active 27 DOM
-
2026-05-31days on market $277,900 Active 26 DOM
-
2026-05-30days on market $277,900 Active 25 DOM
-
2018-08-30soldstatus $135,000
-
2018-08-30soldstatus $135,100
-
2018-05-26$125,000
-
2002-12-06soldstatus $80,000
ⓘ Source: listings_history table (triggers on properties + properties_extension) + one-shot
backfill from property_details.listing_events for pre-trigger history.
Tax reassessment forecast CA · Resets to sale price
- Current annual tax
- $1,685 · $140/mo
- Projected year-2 tax
- $1,685 · $140/mo
- Expected delta
- $0/yr ($0/mo · 0.0%)
ⓘ Screening estimate from a state-policy table — verify with the county assessor before closing.
Climate risk First Street
- Flood 1/10 Low FEMA zone X (unshaded) · 0% chance over 30 yrs
- Wildfire 8/10 Severe
- Heat 3/10 Moderate 7 d/yr ≥86°F today · 17 d/yr by 30 yrs out
- Wind 1/10 Low
- Air quality 10/10 Extreme 33 unhealthy d/yr today · 36 by 30 yrs out
Nearby sold comps map
Loading sold comps map…
Walkable amenities ~0.75 mi
Loading nearby amenities…
Taxation est. · year 1
- Rental income
- $12,996
- − Mortgage interest
- −$7,556
- − Property taxes
- −$1,685
- − Insurance
- −$674
- − Repairs & maintenance
- −$1,040
- − Management
- −$1,040
- − Depreciation
- −$3,924
- Taxable loss
- −$2,923
- Est. tax savings @ 24.0%
- +$702
- After-tax cash flow
- $120/yr
For passive investors: Depreciation is non-cash, so a rental often shows a tax loss while cash-flowing — sheltering income. Rental losses are passive: they offset passive income freely, and up to $25,000/yr can offset ordinary (W-2) income if you actively participate and your MAGI is under $100k (phasing out to $0 by $150k); unused losses carry forward. On sale, claimed depreciation is recaptured at up to 25%, and gains may owe capital-gains tax (a 1031 exchange can defer both). Figures are a year-1 estimate at your 24.0% rate — not tax advice; consult a CPA.
Schools (NCES district)
- District
- Plumas Unified
- NCES district ID
- 0631170
- Math proficiency
- 21% ▼ -11.00%
- Reading proficiency
- 44% ▬ 0.00%
- Median HH income
- $46,935
- Composite
- 27.89/100
- National rank
- #6870
- State rank
- #306 of 517 in CA
Livability — Portola
- Score
- 55/100
- State rank
- #851
- US rank
- #23373
Category grades
Schools grade is shown separately in the Schools card above.
Census & demographics
- Census place
- Portola, CA
- City population
- 4,492
- Population (ZIP)
- 4,492
Population outlook (Plumas County) Hauer SSP2
- Today (2025)
- 15,564 people
- By 2030
- 14,014 · -10.0%
- By 2040
- 11,197 · -28.1%
- By 2050
- 9,069 · -41.7%
- By 2075
- 5,573 · -64.2%
- By 2100
- 3,392 · -78.2%
Race, ethnicity, and origin ACS 2023
- Neighborhood character
- Predominantly White (79%)
- Race & ethnicity
- White 79% Hispanic / Latino 16% Two or more races 6% Native American 4% Asian 1%
- Hispanic origin (detail)
- Mexican 14%
- Common ancestry
- Italian 5% Lithuanian 5% German 4%
- Foreign-born
- 6% · Canada
- Languages at home
- 89% English-only · Spanish 7% German/W. Germanic 2% French/Haitian/Cajun 1%
Political lean MEDSL · Plumas
- 2024 margin
- R (+16.9) · D 39.9% · R 56.9% · Other 3.2%
- 2008→2024 swing
- -5.0pp toward R · 2008: -12.0pp · 2024: -16.9pp
- All cycles
- 2024: R+16.9 2020: R+16.7 2016: R+21.0 2012: R+17.2 2008: R+12.0
Not yet ingested
- Civics
- —
Market trends
- HPI YoY
- ▼ -65.06%
- Current HPI
- 183.376
- Rent YoY
- —
- Metro
- —
- State GDP YoY
- ▲ 3.21%
- F500 in state
- 116
Industry mix (Fortune 500 HQ in CA)
| Industry | F500 HQs | Revenue |
|---|---|---|
| Technology | 27 | $1,492B |
|
||
| Financial Services | 3 | $174B |
|
||
| Retail | 3 | $44B |
|
||
| Insurance | 3 | $26B |
|
||
| Media / Entertainment | 2 | $115B |
|
||
| Pharmaceuticals / Biotech | 2 | $62B |
|
||
Price history
+68.9% since first listed4 events — show timeline
- 2018-08-30 Sold (Public Records) $135,100 Public Records
- 2018-08-30 Sold (MLS) $135,000 PAR
- 2018-05-26 Listed $125,000 PAR
- 2002-12-06 Sold (Public Records) $80,000 Public Records
Property tax history
+7.8%/yrLatest (2025): $1,685 · -0.5% YoY. Source: county tax records.
Cash-flow waterfall
monthlySold comps — $/sqft
last 12 mo · ≤1 miLoading sold comps…