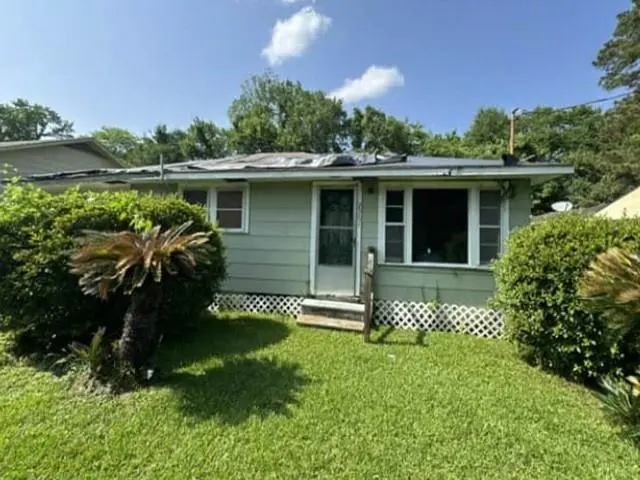
2361 70th Ave · Baton Rouge, LA
Flood risk 4/10 · Minor
- FEMA flood zone
- X (unshaded)
- Chance of flooding over 30 yrs
- 0.22%
- Est. flood insurance / yr
- $507 – $1,088
Fire risk 1/10 · Minimal
- Est. fire insurance / yr
- $1,269 – $2,357
Heat risk 8/10 · Major
- Hot days now (above 108°F)
- 7 days/yr
- Hot days in 30 yrs
- 20 days/yr
Wind risk 9/10 · Severe
- Chance of severe wind over 30 yrs
- 99.0%
Air-quality risk 2/10 · Minimal
- Unhealthy air days now
- 1 days/yr
- Unhealthy air days in 30 yrs
- 1 days/yr
Risk factors via First Street. Map © Google.
Why this score? — see what drove the D+ grade
The composite is a weighted blend of 9 inputs, each scored 0–100. Each bar is that input's sub-score; the figure is the points it added to the 100-point composite (weight × sub-score).
- Cash flow +15.0/30.0
- ARV discount +7.5/15.0
- 1% rule +5.0/10.0
- DSCR +5.0/10.0
- Appreciation +4.6/10.0
- Livability +3.7/5.0
- Rent growth +2.5/5.0
- Condition / age +2.5/5.0
- Schools +2.4/10.0
$16,900
🖨 Deal sheet 📄 Offer letter ✓ Due diligence
Listing remarks MLS
Opportunity awaits in this two bedroom one bath home with carport parking. Work is required to make this home move in ready but could be worth the effort. Whether you decide to customize this home for yourself or rent it out, this house could be a great option.
Key facts
- 5,998 sq ft lot
- Parking
- Built 1960
Property features AI
Exterior
- Parking: Carport with space for one vehicle
- Utilities: Public water; Public sewer
- Home design: Single-story frame home; Slab foundation
- Construction: Frame construction
- Exterior features: Rectangular lot; Located outside city limits
Interior
- Bathrooms: 1 full bathroom
- Heating & cooling: Central heating; Central air conditioning
- Interior features: Total of 4 rooms; Average condition
Neighborhood map
What this means for you Summary
Snapshot
- This is a 2-bed/1.0-bath single-family listed at $17k.
Deal economics
- At list price, monthly cash flow is $714 ($9k/yr) — positive.
- The deal already cash-flows at list — no discount required.
- Meets the 1% rule at list price ($1k rent vs $17k).
- Recommended offer: $17k (1.5% below list) — sets the bar for market timing.
- Cap rate 57.0% vs local median 4.3% in Baton Rouge — top-decile yield for the area; either an underpriced asset or a hidden risk that comps aren't pricing in. Stress-test before assuming the spread holds.
Location & tenants
- Location reads 74/100 on livability (#24 in LA, #4,535 nationally) — a middle-class / working-renter tenant base. Strengths: commute A+, cost of living A+, health & safety A+; Watch: amenities D, crime F, employment D-.
- East Baton Rouge Parish (urban): math 22% / reading 34% proficiency, ranked #47 of 98 in LA (top 48%) — low school quality limits family demand, transient renter base, plan for 1-2y turnover; 77% free/reduced lunch — lower-income household profile, screen leases tightly.
- Market conditions: 101 active listings in the ZIP; 8 comparable units currently listed for rent nearby; rentals lingering (median 44d on market — plan ~5-8 weeks vacancy on turnover, expect pricing pressure); 50% of comp listings sitting > 30 days — soft ceiling on asking rent; lower-income renter base — watch delinquency; 2,252 units permitted in East Baton Rouge Parish in 2024 (440 in 5+ unit buildings).
- At $1,053/mo this rent would consume 46% of the median local household income ($28k/yr) (locally 1092% of renters already pay >50% of income on rent) — very limited rent-growth headroom before tenants either downsize or default.
Forward outlook
- Local home prices are declining (-0.9%/yr); year-one equity from $117 of loan paydown is wiped out by about $147 of value loss. Plan a longer hold.
- East Baton Rouge County population projected at +4% by 2050 — modest demand growth; plan on rents tracking national, not racing it.
- At projected returns (-0.9% appreciation + 3.0% rent growth), your $5k cash investment doubles in ~1 year — after that, you're playing with house money.
Negotiation context
- It's been on market 20 days — a 2% lower offer ($17k) is reasonable based on typical stale-listing flexibility.
- 2 sale attempts with the ask held roughly flat each time — persistent listings suggest the price (not the market) is what's stuck; bring a comps-based counter.
Risks & watch-outs
- Climate carrying-cost: severe wind risk, 99% chance of damaging wind over 30y; extreme-heat days projected 7→20/yr by 2055 (HVAC capex compounding) — expect insurance premiums to compound above CPI over the hold.
Questions for the listing agent
- Built in 1960 — when were the roof, HVAC, electrical panel, plumbing, and water heater last replaced?
- Is there a deadline driving the sale (1031 exchange, divorce, estate, relocation)? That informs how much negotiation room exists.
- Crime grade is F in this area — have there been break-ins, vandalism, or insurance claims at this property in the last 3 years? What carrier currently insures it and at what premium?
- The area grade is low — what's the realistic commute time and amenity access for the typical tenant pool here? Any planned neighborhood developments (good or bad) we should know about?
- What's the average days-on-market for RENTAL listings here right now (not sales)? A rising rental-DOM trend means longer vacancies and softer asking-rent achievability than the comps imply.
- What's the recent tenant-quality profile in this submarket — average credit score on applications, eviction rate, late-payment / NSF rate, and stable-employment percentage? A property-management company in the area should have these aggregated.
- How much new for-sale + rental construction is in the pipeline within 1–3 miles? Heavy new supply typically softens prices + rents 12–24 months out; constrained supply supports both.
Investment metrics
- 1% rule
- 6.23% ✓
- Cap rate
- 56.96%
- Cash-on-cash
- 180.96%
- DSCR
- 9.05
- GRM
- 1.3
CMA / ARV
- ARV (on-the-fly)
- $57,152
- Comps found
- 5
Show comp detail 5 sales within ~0.75 mi
| Address | Dist | Beds/Ba | Sqft | Sold | Price | $/sf | Match |
|---|---|---|---|---|---|---|---|
| 2112 69th St | 0.20mi | 2/1.0 | 937 (+5%) | 9mo | $20,000 | $21 | 75 |
| 2799 72nd Ave | 0.33mi | 3/1.0 (+1) | 900 (+1%) | 10mo | $89,900 | $100 | 70 |
| 2858 75th Ave | 0.38mi | 3/1.0 (+1) | 900 (+1%) | 16mo | $28,200 | $31 | 62 |
| 1677 78th Ave | 0.59mi | 3/1.5 (+1) | 969 (+8%) | 4mo | $125,000 | $129 | 48 |
| 6724 Village Dr | 0.46mi | 3/1.0 (+1) | 1,020 (+14%) | 14mo | $65,000 | $64 | 38 |
Match score weights: distance 35% · size 25% · config 20% · recency 20%. Top-matched comps best support the ARV.
Projected returns pro-forma
-0.87% appreciation · 3.0% rent growth · sell at horizon
- IRR
- —
- Equity multiple
- 10.36×
- Total profit
- $44,290
- Equity at exit
- $4,184
- IRR
- —
- Equity multiple
- 21.84×
- Total profit
- $98,635
- Equity at exit
- $4,483
Cash invested: $4,732 (down + closing). Projections, not guarantees.
Landlord ↔ Tenant lean methodology
- Overall (STATE)
- 90 Strongly Landlord-Friendly
- State Louisiana
- 90 Strongly Landlord-Friendly · R+12
- County
- — inherits STATE
- City
- — inherits STATE
ZIP-level market 70807
- Home prices YoY
- -1.1%
- Active inventory
- 101
- Price-to-rent
- 1.3×
Monthly cashflow live
- Estimated rent
- $1,053 high interval (Pro) →
- Mortgage (P&I)
- −$89
- Tax from tax record
- −$23 /mo · $272/yr
- Insurance
- −$7
- HOA
- −$0
- Vacancy / Maint / Mgmt
- −$221
- Net cashflow
- $714
Break-even live
UW: 25.0% down · 7.5% · 30yr · 1.5% tax · 5.0% vac · 8.0% maint · 8.0% mgmt
Financing live
Cash to close
- Down payment
- $4,225
- Closing costs
- $507
- Reserves months
- —
- Total cash needed
- —
Loan-product check · same deal, 3 products live
Conventional
25% down · 7.5% · 30yr
- Down + closing
- —
- Monthly P&I
- —
- Monthly cashflow
- —
- DSCR
- —
- Eligible?
- —
Personal DTI + credit; lowest rate.
DSCR
20% down · 8.5% · 30yr
- Down + closing
- —
- Monthly P&I
- —
- Monthly cashflow
- —
- DSCR
- —
- Eligible?
- —
No personal income docs; deal must DSCR.
Hard money
10% down · 12.0% · 12mo
- Down + closing
- —
- Monthly P&I
- —
- Monthly cashflow
- —
- DSCR
- —
- Eligible?
- —
Short-term bridge; refi at stabilization.
Rent comps 8 comps
| Address | Beds | Baths | Sqft | Rent | $/sqft | DOM | Units | Dist |
|---|---|---|---|---|---|---|---|---|
| 2203 Fairchild St Baton Rouge, LA | 2.0 | 1.0 | 800 | $1,000 | $1.25 | 43d | 1 | 0.68mi |
| 1555 Swan Ave Baton Rouge, LA | 1.0 | 1.0 | 800 | $900 | $1.12 | 23d | 1 | 0.94mi |
| 4540 Crown Ave Unit 85 Baton Rouge, LA | 2.0 | 1.0 | 700 | $850 | $1.21 | 43d | 1 | 1.29mi |
| 4540 Crown Ave Unit 91 Baton Rouge, LA | 2.0 | 1.0 | 1000 | $950 | $0.95 | 19d | 1 | 1.29mi |
| 4540 Crown Ave Unit 93 Baton Rouge, LA | 2.0 | 1.0 | 700 | $900 | $1.29 | 43d | 1 | 1.29mi |
| 4540 Crown Ave Unit 94 Baton Rouge, LA | 2.0 | 1.0 | 1000 | $1,098 | $1.10 | 43d | 1 | 1.29mi |
| 4540 Crown Ave Unit 94 Baton Rouge, LA | 2.0 | 1.0 | 1000 | $900 | $0.90 | 23d | 1 | 1.29mi |
| 947 Grebe St Unit 4 Baton Rouge, LA | 2.0 | 1.0 | 650 | $1,050 | $1.62 | 19d | 1 | 1.37mi |
Listing history 17 events
-
2026-06-18days on market $16,900 Active 20 DOM
-
2026-06-17days on market $16,900 Active 19 DOM
-
2026-06-16days on market $16,900 Active 18 DOM
-
2026-06-15price $16,900 Active 17 DOM
-
2026-06-15days on market $17,000 Active 17 DOM
-
2026-06-14days on market $17,000 Active 15 DOM
-
2026-06-10days on market $17,000 Active 12 DOM
-
2026-06-09days on market $17,000 Active 11 DOM
-
2026-06-08days on market $17,000 Active 10 DOM
-
2026-06-07days on market $17,000 Active 9 DOM
-
2026-06-05days on market $17,000 Active 6 DOM
-
2026-06-03days on market $17,000 Active 5 DOM
-
2026-06-02days on market $17,000 Active 4 DOM
-
2026-06-01days on market $17,000 Active 3 DOM
-
2026-05-31days on market $17,000 Active 2 DOM
-
2026-05-29$17,000 Active
Show marketing remark (261 chars)
Opportunity awaits in this two bedroom one bath home with carport parking. Work is required to make this home move in ready but could be worth the effort. Whether you decide to customize this home for yourself or rent it out, this house could be a great option.
-
2026-05-29$17,000 Active 261-char remark
Show marketing remark (261 chars)
Opportunity awaits in this two bedroom one bath home with carport parking. Work is required to make this home move in ready but could be worth the effort. Whether you decide to customize this home for yourself or rent it out, this house could be a great option.
ⓘ Source: listings_history table (triggers on properties + properties_extension) + one-shot
backfill from property_details.listing_events for pre-trigger history.
Tax reassessment forecast LA · Resets to sale price
- Current annual tax
- $272 · $23/mo
- Projected year-2 tax
- $272 · $23/mo
- Expected delta
- $0/yr ($0/mo · 0.0%)
ⓘ Screening estimate from a state-policy table — verify with the county assessor before closing.
Climate risk First Street
- Flood 4/10 Moderate FEMA zone X (unshaded) · 22% chance over 30 yrs
- Wildfire 1/10 Low
- Heat 8/10 Severe 7 d/yr ≥108°F today · 20 d/yr by 30 yrs out
- Wind 9/10 Extreme 99% chance of damaging wind over 30 yrs
- Air quality 2/10 Low 1 unhealthy d/yr today · 1 by 30 yrs out
Nearby sold comps map
Loading sold comps map…
Walkable amenities ~0.75 mi
Loading nearby amenities…
Taxation est. · year 1
- Rental income
- $12,636
- − Mortgage interest
- −$947
- − Property taxes
- −$272
- − Insurance
- −$84
- − Repairs & maintenance
- −$1,011
- − Management
- −$1,011
- − Depreciation
- −$492
- Taxable income
- $8,820
- Est. tax owed @ 24.0%
- −$2,117
- After-tax cash flow
- $6,446/yr
For passive investors: Depreciation is non-cash, so a rental often shows a tax loss while cash-flowing — sheltering income. Rental losses are passive: they offset passive income freely, and up to $25,000/yr can offset ordinary (W-2) income if you actively participate and your MAGI is under $100k (phasing out to $0 by $150k); unused losses carry forward. On sale, claimed depreciation is recaptured at up to 25%, and gains may owe capital-gains tax (a 1031 exchange can defer both). Figures are a year-1 estimate at your 24.0% rate — not tax advice; consult a CPA.
Schools (NCES district)
- District
- East Baton Rouge Parish
- NCES district ID
- 2200540
- Math proficiency
- 22% ▼ -36.00%
- Reading proficiency
- 34% ▼ -31.00%
- Median HH income
- $46,263
- Composite
- 24.14/100
- National rank
- #7745
- State rank
- #47 of 98 in LA
Livability — Baton Rouge
- Score
- 74/100
- State rank
- #24
- US rank
- #4535
Category grades
Schools grade is shown separately in the Schools card above.
Census & demographics
- Census place
- Baton Rouge, LA
- County
- East Baton Rouge Parish · 399,686 people
- City population
- 351,868
- Metro
- Baton Rouge, LA
- Population (ZIP)
- 15,300
- Household income
- $27,534
- Rent vs Own
- Severe rent burden
- 1092.0
Population outlook (East Baton Rouge County) Hauer SSP2
- Today (2025)
- 464,810 people
- By 2030
- 472,137 · +1.6%
- By 2040
- 480,243 · +3.3%
- By 2050
- 484,422 · +4.2%
- By 2075
- 492,069 · +5.9%
- By 2100
- 476,347 · +2.5%
Race, ethnicity, and origin ACS 2023
- Neighborhood character
- Predominantly Black (91%)
- Race & ethnicity
- Black 91% Two or more races 6% White 3%
- Common ancestry
- Lithuanian 1%
- Foreign-born
- 1% · Canada
Political lean MEDSL · East Baton Rouge
- 2024 margin
- D (+11.1) · D 54.5% · R 43.4% · Other 2.1%
- 2008→2024 swing
- +8.9pp toward D · 2008: 2.2pp · 2024: 11.1pp
- All cycles
- 2024: D+11.1 2020: D+13.1 2016: D+9.2 2012: D+5.2 2008: D+2.2
Not yet ingested
- Civics
- —
Market trends
- HPI YoY
- ▼ -0.87%
- Current HPI
- 78.3629
- Rent YoY
- —
- Metro
- Baton Rouge, LA
- State GDP YoY
- ▲ 3.29%
- F500 in state
- 10
Industry mix (Fortune 500 HQ in LA)
| Industry | F500 HQs | Revenue |
|---|---|---|
| Telecommunications | 2 | $23B |
|
||
| Utilities | 1 | $12B |
|
||
| Wholesale / Distribution | 1 | $5B |
|
||
| Advertising | 1 | $2B |
|
||
Price history
+0.0% since first listed2 events — show timeline
- 2026-05-29 Listed $17,000 AcadianaMLS
- 2026-05-29 Listed $17,000 GSREIN
Property tax history
+22.9%/yrLatest (2025): $272 · +4.7% YoY. Source: county tax records.
Cash-flow waterfall
monthlySold comps — $/sqft
last 12 mo · ≤1 miLoading sold comps…