756 Bradshaw Drive Dr E · Browndell, TX
Flood risk 1/10 · Minimal
- FEMA flood zone
- —
- Chance of flooding over 30 yrs
- 0.0%
- Est. flood insurance / yr
- —
Fire risk 5/10 · Moderate
- Est. fire insurance / yr
- $1,222 – $2,270
Heat risk 8/10 · Major
- Hot days now (above 111°F)
- 7 days/yr
- Hot days in 30 yrs
- 22 days/yr
Wind risk 8/10 · Major
- Chance of severe wind over 30 yrs
- 96.0%
Air-quality risk 1/10 · Minimal
- Unhealthy air days now
- 0 days/yr
- Unhealthy air days in 30 yrs
- 0 days/yr
Risk factors via First Street. Map © Google.
Why this score? — see what drove the B grade
The composite is a weighted blend of 9 inputs, each scored 0–100. Each bar is that input's sub-score; the figure is the points it added to the 100-point composite (weight × sub-score).
- Cash flow +30.0/30.0
- 1% rule +10.0/10.0
- DSCR +10.0/10.0
- ARV discount +7.5/15.0
- Appreciation +5.6/10.0
- Schools +4.3/10.0
- Rent growth +2.5/5.0
- Condition / age +2.5/5.0
- Livability +2.4/5.0
$39,000
🖨 Deal sheet (PDF) 📄 Offer letter ✓ Due diligence
Listing remarks
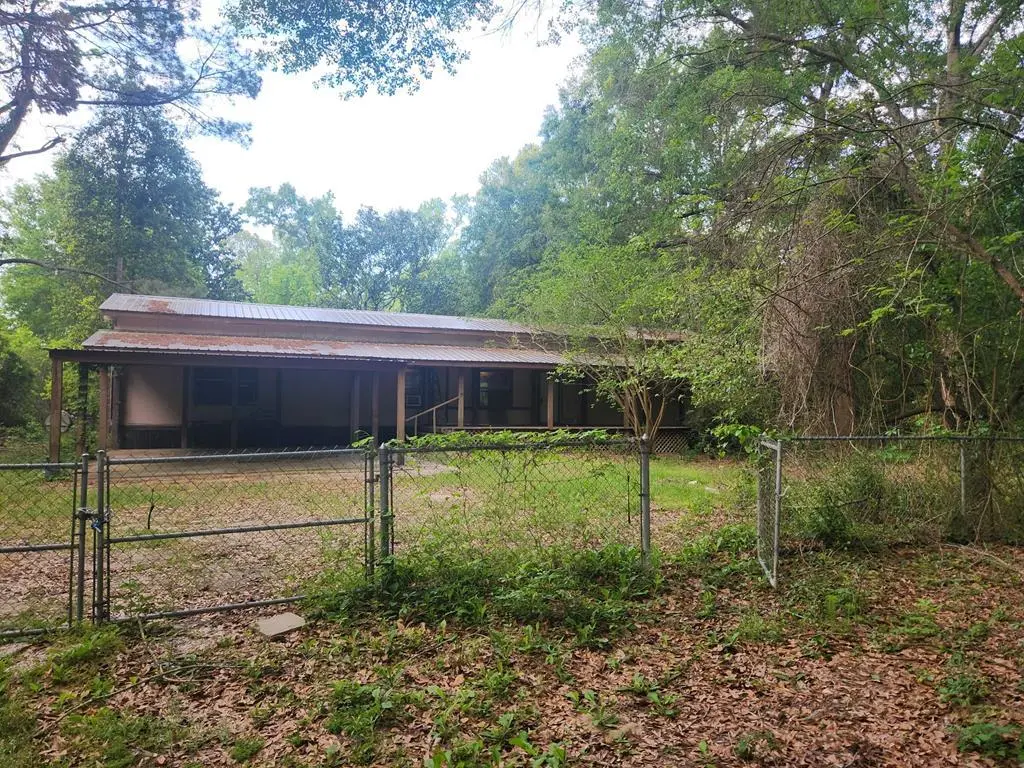
Located on the North end Brookeland just minutes from lake Sam Rayburn, this 14x68 mobile home offers peaceful country surroundings with beautiful mature trees lining the quiet road leading to the property. The home features 3 bedrooms, 2 full restrooms, an added storage and laundry area, a covered front porch, an attached two- car carport. and a fully fenced yard. a detached storage building is also included in the backyard and is ready for some TLC. Also located approximately 100 yards from an active railroad crossing. This property is being sold as-is and does have black mold present in two of the bedrooms. Great opportunity for investors, handy buyers, or anyone looking for an affordabl
Key facts
- Covered front porch
- Fully fenced yard
- 1 acre lot
Tags
Property features AI
Exterior
- Parking: Attached parking
- Home design: Residential mobile home; Located on a 1-acre lot
- Construction: Aluminum siding
- Exterior features: Fenced yard; Metal roof
Interior
- Flooring: Carpet; Vinyl
- Bathrooms: 2 full bathrooms
- Heating & cooling: Window air conditioning units; Space heater for heating
- Interior features: Washer and dryer included; Refrigerator included
- Laundry & utility: Washer; Dryer
Neighborhood map
What this means for you Summary
Snapshot
- This is a 3-bed/2.0-bath manufactured listed at $39k.
Deal economics
- At list price, monthly cash flow is $571 ($7k/yr) — positive.
- The deal already cash-flows at list — no discount required.
- Meets the 1% rule at list price ($1k rent vs $39k).
- Recommended offer: $38k (3.0% below list) — sets the bar for market timing.
Location & tenants
- Location reads 48/100 on livability (#1,526 in TX) — a working-class tenant base; expect higher turnover. Strengths: cost of living A+; Watch: housing C-, schools F, crime F.
- Brookeland ISD (rural): math 43% / reading 53% proficiency, ranked #445 of 1,141 in TX (top 39%) — families likely to look elsewhere, expect single-tenant / working-renter base with shorter leases.
- Market conditions: 421 active listings in the ZIP.
Forward outlook
- In year one you build about $768 of equity ($270 loan paydown + $498 appreciation (1.3% local appreciation)).
- Sabine County population projected at -23% by 2050 — secular population decline; favor cash flow + early exit over multi-decade hold.
- At projected returns (1.3% appreciation + 3.0% rent growth), your $11k cash investment doubles in ~2 years — after that, you're playing with house money.
Negotiation context
- It's been on market 37 days — a 3% lower offer ($38k) is reasonable based on typical stale-listing flexibility.
Risks & watch-outs
- Climate carrying-cost: severe wind risk, 96% chance of damaging wind over 30y; moderate wildfire risk; extreme-heat days projected 7→22/yr by 2055 (HVAC capex compounding) — expect insurance premiums to compound above CPI over the hold.
Questions for the listing agent
- It's been on market 37 days. Have you received any prior offers? Is the seller open to a 3% concession, seller financing, or rate buy-down credit?
- Is there a deadline driving the sale (1031 exchange, divorce, estate, relocation)? That informs how much negotiation room exists.
- Schools are F-rated, which usually means shorter tenancies and higher turnover. Who's the typical renter profile here, and what's been the actual vacancy rate?
- Crime grade is F in this area — have there been break-ins, vandalism, or insurance claims at this property in the last 3 years? What carrier currently insures it and at what premium?
- What's the average days-on-market for RENTAL listings here right now (not sales)? A rising rental-DOM trend means longer vacancies and softer asking-rent achievability than the comps imply.
- What's the recent tenant-quality profile in this submarket — average credit score on applications, eviction rate, late-payment / NSF rate, and stable-employment percentage? A property-management company in the area should have these aggregated.
- How much new for-sale + rental construction is in the pipeline within 1–3 miles? Heavy new supply typically softens prices + rents 12–24 months out; constrained supply supports both.
Investment metrics
- 1% rule
- 2.61% ✓
- Cap rate
- 23.86%
- Cash-on-cash
- 62.73%
- DSCR
- 3.79
- GRM
- 3.2
CMA / ARV
No comps found within radius.
Projected returns pro-forma
1.28% appreciation · 3.0% rent growth · sell at horizon
- IRR
- 65.8%
- Equity multiple
- 4.44×
- Total profit
- $37,610
- Equity at exit
- $13,879
- IRR
- 66.8%
- Equity multiple
- 9.02×
- Total profit
- $87,525
- Equity at exit
- $18,890
Cash invested: $10,920 (down + closing). Projections, not guarantees.
Landlord ↔ Tenant lean methodology
- Overall (STATE)
- 87 Strongly Landlord-Friendly
- State Texas
- 87 Strongly Landlord-Friendly · R+5
- County
- — inherits STATE
- City
- — inherits STATE
ZIP-level market 75931
- Home prices YoY
- 0.6%
- Active inventory
- 421
- Price-to-rent
- 3.2×
Monthly cashflow live
- Estimated rent
- $1,020 medium interval (Pro) →
- Mortgage (P&I)
- −$205
- Tax from tax record
- −$14 /mo · $167/yr
- Insurance
- −$16
- HOA
- −$0
- Vacancy / Maint / Mgmt
- −$214
- Net cashflow
- $571
Break-even live
Sensitivity live
| Price | -10% $593 | -5% $582 | +0% $571 | +5% $560 | +10% $549 |
|---|---|---|---|---|---|
| Rent | -10% $490 | -5% $531 | +0% $571 | +5% $611 | +10% $651 |
| Rate | -1.0pp $590 | -0.5pp $581 | base $571 | +0.5pp $561 | +1.0pp $550 |
UW: 25.0% down · 7.5% · 30yr · 1.5% tax · 5.0% vac · 8.0% maint · 8.0% mgmt
Financing live
Cash to close
- Down payment
- $9,750
- Closing costs
- $1,170
- Reserves months
- —
- Total cash needed
- —
Loan-product check · same deal, 3 products live
Conventional
25% down · 7.5% · 30yr
- Down + closing
- —
- Monthly P&I
- —
- Monthly cashflow
- —
- DSCR
- —
- Eligible?
- —
Personal DTI + credit; lowest rate.
DSCR
20% down · 8.5% · 30yr
- Down + closing
- —
- Monthly P&I
- —
- Monthly cashflow
- —
- DSCR
- —
- Eligible?
- —
No personal income docs; deal must DSCR.
Hard money
10% down · 12.0% · 12mo
- Down + closing
- —
- Monthly P&I
- —
- Monthly cashflow
- —
- DSCR
- —
- Eligible?
- —
Short-term bridge; refi at stabilization.
Listing history 16 events
-
2026-06-21days on market $39,000 Active 37 DOM
-
2026-06-18days on market $39,000 Active 35 DOM
-
2026-06-17days on market $39,000 Active 34 DOM
-
2026-06-16days on market $39,000 Active 33 DOM
-
2026-06-15days on market $39,000 Active 32 DOM
-
2026-06-13days on market $39,000 Active 30 DOM
-
2026-06-12days on market $39,000 Active 29 DOM
-
2026-06-09days on market $39,000 Active 26 DOM
-
2026-06-08days on market $39,000 Active 25 DOM
-
2026-06-08days on market $39,000 Active 24 DOM
-
2026-06-07days on market $39,000 Active 23 DOM
-
2026-06-03days on market $39,000 Active 20 DOM
-
2026-06-02days on market $39,000 Active 19 DOM
-
2026-06-01days on market $39,000 Active 18 DOM
-
2026-05-31days on market $39,000 Active 17 DOM
-
2026-05-13$39,000 Active 760-char remark
ⓘ Source: listings_history table (triggers on properties + properties_extension) + one-shot
backfill from property_details.listing_events for pre-trigger history.
Tax reassessment forecast TX · Resets to sale price
- Current annual tax
- $167 · $14/mo
- Projected year-2 tax
- $714 · $59/mo
- Expected delta
- +$546/yr (+$46/mo · 326.9%)
ⓘ Screening estimate from a state-policy table — verify with the county assessor before closing.
Climate risk First Street
- Flood 1/10 Low 0% chance over 30 yrs
- Wildfire 5/10 Major
- Heat 8/10 Severe 7 d/yr ≥111°F today · 22 d/yr by 30 yrs out
- Wind 8/10 Severe 96% chance of damaging wind over 30 yrs
- Air quality 1/10 Low 0 unhealthy d/yr today · 0 by 30 yrs out
Nearby sold comps map
Loading sold comps map…
Walkable amenities ~0.75 mi
Loading nearby amenities…
Taxation est. · year 1
- Rental income
- $12,236
- − Mortgage interest
- −$2,185
- − Property taxes
- −$167
- − Insurance
- −$195
- − Repairs & maintenance
- −$979
- − Management
- −$979
- − Depreciation
- −$1,135
- Taxable income
- $6,597
- Est. tax owed @ 24.0%
- −$1,583
- After-tax cash flow
- $5,267/yr
For passive investors: Depreciation is non-cash, so a rental often shows a tax loss while cash-flowing — sheltering income. Rental losses are passive: they offset passive income freely, and up to $25,000/yr can offset ordinary (W-2) income if you actively participate and your MAGI is under $100k (phasing out to $0 by $150k); unused losses carry forward. On sale, claimed depreciation is recaptured at up to 25%, and gains may owe capital-gains tax (a 1031 exchange can defer both). Figures are a year-1 estimate at your 24.0% rate — not tax advice; consult a CPA.
Schools (NCES district)
- District
- Brookeland ISD
- NCES district ID
- 4811520
- Math proficiency
- 43% ▼ -1.00%
- Reading proficiency
- 53% ▼ -1.00%
- Median HH income
- $45,145
- Composite
- 42.74/100
- National rank
- #6781
- State rank
- #445 of 1141 in TX
Livability — Browndell
- Score
- 48/100
- State rank
- #1526
- US rank
- #26081
Category grades
Schools grade is shown separately in the Schools card above.
Census & demographics
- Population (ZIP)
- 2,209
Population outlook (Sabine County) Hauer SSP2
- Today (2025)
- 9,354 people
- By 2030
- 8,806 · -5.9%
- By 2040
- 7,871 · -15.9%
- By 2050
- 7,224 · -22.8%
- By 2075
- 6,351 · -32.1%
- By 2100
- 5,465 · -41.6%
Race, ethnicity, and origin ACS 2023
- Neighborhood character
- Predominantly White (93%)
- Race & ethnicity
- White 93% Two or more races 4% Hispanic / Latino 3% Black 1%
- Common ancestry
- Italian 4% Lithuanian 2% Romanian 1%
- Foreign-born
- 2%
- Languages at home
- 97% English-only · German/W. Germanic 2% Other Indo-European 1%
Political lean MEDSL · Sabine
- 2024 margin
- Solid R (+78.5) · D 10.6% · R 89.1%
- 2008→2024 swing
- -23.7pp toward R · 2008: -54.8pp · 2024: -78.5pp
- All cycles
- 2024: R+78.5 2020: R+75.0 2016: R+72.8 2012: R+63.9 2008: R+54.8
Not yet ingested
- Civics
- —
Market trends
- HPI YoY
- ▲ 1.28%
- Current HPI
- 231.9835
- Rent YoY
- —
- Metro
- —
- State GDP YoY
- ▲ 3.95%
- F500 in state
- 110
Industry mix (Fortune 500 HQ in TX)
| Industry | F500 HQs | Revenue |
|---|---|---|
| Energy | 16 | $1,198B |
|
||
| Technology | 5 | $198B |
|
||
| Engineering / Construction | 4 | $72B |
|
||
| Energy Services | 3 | $60B |
|
||
| Utilities | 3 | $41B |
|
||
| Healthcare | 2 | $330B |
|
||
Price history
1 event — show timeline
- 2026-05-13 Listed $39,000 Deep East Texas MLS
Property tax history
-5.4%/yrLatest (2025): $167 · +11.6% YoY. Source: county tax records.
Cash-flow waterfall
monthlySold comps — $/sqft
last 12 mo · ≤1 miLoading sold comps…