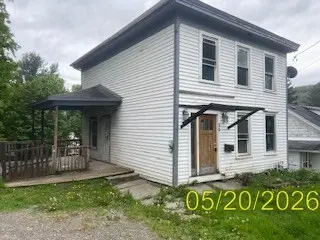
35 Pleasant St · Norwich, NY
Flood risk 1/10 · Minimal
- FEMA flood zone
- X (unshaded)
- Chance of flooding over 30 yrs
- 0.0%
- Est. flood insurance / yr
- $473 – $860
Fire risk 1/10 · Minimal
- Est. fire insurance / yr
- $691 – $1,283
Heat risk 3/10 · Minor
- Hot days now (above 94°F)
- 7 days/yr
- Hot days in 30 yrs
- 17 days/yr
Wind risk 2/10 · Minimal
- Chance of severe wind over 30 yrs
- 1.0%
Air-quality risk 1/10 · Minimal
- Unhealthy air days now
- 0 days/yr
- Unhealthy air days in 30 yrs
- 0 days/yr
Risk factors via First Street. Map © Google.
Why this score? — see what drove the B+ grade
The composite is a weighted blend of 9 inputs, each scored 0–100. Each bar is that input's sub-score; the figure is the points it added to the 100-point composite (weight × sub-score).
- Cash flow +30.0/30.0
- 1% rule +10.0/10.0
- DSCR +10.0/10.0
- Appreciation +10.0/10.0
- ARV discount +7.5/15.0
- Schools +3.6/10.0
- Livability +3.5/5.0
- Rent growth +2.5/5.0
- Condition / age +2.5/5.0
$43,000
🖨 Deal sheet 📄 Offer letter ✓ Due diligence
Listing remarks MLS
A Perfect STARTER Home on a Pleasant Street, in town! A very nice Floor Plan with LARGE Areas! CONVENIENT, Easy walking distance to town and amenities. Featuring HARDWOOD floors, newer Low-E doublehung thermopane windows, private tree-lined back yard, new stair bannister and repainted kitchen! A MUST SEE, and a Great Value for the Price!
Key facts
- 0.26 acre lot
- Built 1900
- Listed 27 days
Property features AI
Exterior
- Parking: Driveway
- Utilities: Public water; Public sewer
- Home design: Single-family residence; Two levels
- Exterior features: Covered deck; Sloped down lot
Interior
- Flooring: Vinyl flooring; Wood flooring
- Bathrooms: One full bathroom
- Heating & cooling: No central heating listed
- Interior features: Gas water heater; Has basement; Seven total rooms
Neighborhood map
What this means for you Summary
Snapshot
- This is a 3-bed/1.0-bath single-family listed at $43k.
Deal economics
- At list price, monthly cash flow is $848 ($10k/yr) — positive.
- The deal already cash-flows at list — no discount required.
- Meets the 1% rule at list price ($1k rent vs $43k).
- Recommended offer: $42k (1.5% below list) — sets the bar for market timing.
- Cap rate 30.0% vs local median 4.1% in Norwich — top-decile yield for the area; either an underpriced asset or a hidden risk that comps aren't pricing in. Stress-test before assuming the spread holds.
Location & tenants
- Location reads 70/100 on livability (#447 in NY) — a middle-class / working-renter tenant base. Strengths: cost of living A+, housing A+, health & safety A+; Watch: crime D, amenities F, commute F.
- Norwich City School District (town): math 42% / reading 43% proficiency, ranked #498 of 590 in NY (top 84%) — families likely to look elsewhere, expect single-tenant / working-renter base with shorter leases.
- Zoned schools: Stanford J Gibson Primary School (400 students, 52% FRL).
- Market conditions: 84 active listings in the ZIP; 1 comparable units currently listed for rent nearby; 151 units permitted in Chenango County in 2024 (96 in 5+ unit buildings).
Forward outlook
- In year one you build about $5k of equity ($297 loan paydown + $4k appreciation (10.0% local appreciation)).
- Chenango County population projected at -26% by 2050 — secular population decline; favor cash flow + early exit over multi-decade hold.
- At projected returns (10.0% appreciation + 3.0% rent growth), your $12k cash investment doubles in ~1 year — after that, you're playing with house money.
- By year 7, paydown + projected appreciation supports a ~$33k cash-out refi (75% LTV) — recoverable capital for the next deal without selling this one.
Negotiation context
- It's been on market 28 days — a 2% lower offer ($42k) is reasonable based on typical stale-listing flexibility.
- 4 sale attempts since 19y ago with the ask held roughly flat each time — persistent listings suggest the price (not the market) is what's stuck; bring a comps-based counter.
Risks & watch-outs
- Watch-outs: built in 1900 — expect roof / HVAC / electrical / plumbing capex.
Questions for the listing agent
- Built in 1900 — when were the roof, HVAC, electrical panel, plumbing, and water heater last replaced?
- Is there a deadline driving the sale (1031 exchange, divorce, estate, relocation)? That informs how much negotiation room exists.
- Crime grade is D in this area — have there been break-ins, vandalism, or insurance claims at this property in the last 3 years? What carrier currently insures it and at what premium?
- What's the average days-on-market for RENTAL listings here right now (not sales)? A rising rental-DOM trend means longer vacancies and softer asking-rent achievability than the comps imply.
- What's the recent tenant-quality profile in this submarket — average credit score on applications, eviction rate, late-payment / NSF rate, and stable-employment percentage? A property-management company in the area should have these aggregated.
- How much new for-sale + rental construction is in the pipeline within 1–3 miles? Heavy new supply typically softens prices + rents 12–24 months out; constrained supply supports both.
Investment metrics
- 1% rule
- 3.37% ✓
- Cap rate
- 29.97%
- Cash-on-cash
- 84.55%
- DSCR
- 4.76
- GRM
- 2.5
CMA / ARV
- ARV (on-the-fly)
- $133,056
- Comps found
- 12
Show comp detail 12 sales within ~0.75 mi
| Address | Dist | Beds/Ba | Sqft | Sold | Price | $/sf | Match |
|---|---|---|---|---|---|---|---|
| 50 Pleasant St | 0.07mi | 3/1.0 | 1,251 (+2%) | 15mo | $117,500 | $94 | 82 |
| 36 Plymouth St | 0.26mi | 3/1.5 | 1,340 (+9%) | 3mo | $115,000 | $86 | 69 |
| 17 Rexford St | 0.28mi | 3/1.5 | 1,222 (-1%) | 22mo | $155,000 | $127 | 65 |
| 13 Howard St | 0.14mi | 3/1.5 | 1,309 (+6%) | 21mo | $123,000 | $94 | 63 |
| 9 King St | 0.10mi | 3/1.5 | 1,330 (+8%) | 22mo | $79,900 | $60 | 62 |
| 2 Plymouth St | 0.32mi | 3/1.0 | 1,320 (+7%) | 22mo | $143,000 | $108 | 55 |
| 31 Waite St | 0.51mi | 3/2.0 | 1,256 (+2%) | 19mo | $123,000 | $98 | 53 |
| 34 Canasawacta St | 0.27mi | 3/1.0 | 1,386 (+12%) | 18mo | $61,000 | $44 | 51 |
| 19 Sunset Dr | 0.53mi | 3/2.0 | 1,284 (+4%) | 17mo | $150,000 | $117 | 50 |
| 7 Sunset Dr | 0.53mi | 4/1.5 (+1) | 1,260 (+2%) | 18mo | $157,000 | $125 | 49 |
| 93 Plymouth St | 0.45mi | 4/2.0 (+1) | 1,326 (+8%) | 10mo | $185,000 | $140 | 49 |
| 68 W Main St | 0.41mi | 3/1.5 | 1,410 (+14%) | 15mo | $156,000 | $111 | 42 |
Match score weights: distance 35% · size 25% · config 20% · recency 20%. Top-matched comps best support the ARV.
Projected returns pro-forma
10.0% appreciation · 3.0% rent growth · sell at horizon
- IRR
- 94.1%
- Equity multiple
- 7.43×
- Total profit
- $77,472
- Equity at exit
- $38,738
- IRR
- 89.1%
- Equity multiple
- 16.42×
- Total profit
- $185,696
- Equity at exit
- $83,540
Cash invested: $12,040 (down + closing). Projections, not guarantees.
Landlord ↔ Tenant lean methodology
- Overall (STATE)
- 15 Strongly Tenant-Friendly
- State New York
- 15 Strongly Tenant-Friendly · D+10
- County
- — inherits STATE
- City
- — inherits STATE
ZIP-level market 13815
- Home prices YoY
- 8.2%
- Active inventory
- 84
- Price-to-rent
- 2.5×
Monthly cashflow live
- Estimated rent
- $1,450 medium interval (Pro) →
- Mortgage (P&I)
- −$225
- Tax est. 1.5%
- −$54 /mo · $645/yr
- Insurance
- −$18
- HOA
- −$0
- Vacancy / Maint / Mgmt
- −$304
- Net cashflow
- $848
Break-even live
UW: 25.0% down · 7.5% · 30yr · 1.5% tax · 5.0% vac · 8.0% maint · 8.0% mgmt
Financing live
Cash to close
- Down payment
- $10,750
- Closing costs
- $1,290
- Reserves months
- —
- Total cash needed
- —
Loan-product check · same deal, 3 products live
Conventional
25% down · 7.5% · 30yr
- Down + closing
- —
- Monthly P&I
- —
- Monthly cashflow
- —
- DSCR
- —
- Eligible?
- —
Personal DTI + credit; lowest rate.
DSCR
20% down · 8.5% · 30yr
- Down + closing
- —
- Monthly P&I
- —
- Monthly cashflow
- —
- DSCR
- —
- Eligible?
- —
No personal income docs; deal must DSCR.
Hard money
10% down · 12.0% · 12mo
- Down + closing
- —
- Monthly P&I
- —
- Monthly cashflow
- —
- DSCR
- —
- Eligible?
- —
Short-term bridge; refi at stabilization.
Rent comps 1 comps
| Address | Beds | Baths | Sqft | Rent | $/sqft | DOM | Units | Dist |
|---|---|---|---|---|---|---|---|---|
| 30 Midland Dr Norwich, NY | 3.0 | 1.0–1.5 | 755 | $1,450 | $1.92 | 43d | 1 | 0.85mi |
Listing history 24 events
-
2026-06-18days on market $43,000 Active 28 DOM
-
2026-06-17days on market $43,000 Active 27 DOM
-
2026-06-16days on market $43,000 Active 26 DOM
-
2026-06-15days on market $43,000 Active 25 DOM
-
2026-06-13days on market $43,000 Active 23 DOM
-
2026-06-12days on market $43,000 Active 22 DOM
-
2026-06-09days on market $43,000 Active 19 DOM
-
2026-06-08days on market $43,000 Active 18 DOM
-
2026-06-07days on market $43,000 Active 17 DOM
-
2026-06-07days on market $43,000 Active 16 DOM
-
2026-06-04days on market $43,000 Active 13 DOM
-
2026-06-02days on market $43,000 Active 12 DOM
-
2026-06-01days on market $43,000 Active 11 DOM
-
2026-05-31days on market $43,000 Active 10 DOM
-
2026-05-21$43,000 Active
-
2016-05-27soldstatus $53,839 342-char remark
Show marketing remark (342 chars)
A Perfect STARTER Home on a Pleasant Street, in town! A very nice Floor Plan with LARGE Areas! CONVENIENT, Easy walking distance to town and amenities. Featuring HARDWOOD floors, newer Low-E doublehung thermopane windows, private tree-lined back yard, new stair bannister and repainted kitchen! A MUST SEE, and a Great Value for the Price!
-
2016-05-26soldstatus $57,500
-
2015-08-13$54,900 342-char remark
Show marketing remark (342 chars)
A Perfect STARTER Home on a Pleasant Street, in town! A very nice Floor Plan with LARGE Areas! CONVENIENT, Easy walking distance to town and amenities. Featuring HARDWOOD floors, newer Low-E doublehung thermopane windows, private tree-lined back yard, new stair bannister and repainted kitchen! A MUST SEE, and a Great Value for the Price!
-
2014-07-08$59,900
-
2007-12-14soldstatus $56,500
-
2007-12-14soldstatus $59,890
-
2007-06-10$59,900
-
2001-06-25soldstatus $34,900
-
1999-11-01soldstatus $12,000
ⓘ Source: listings_history table (triggers on properties + properties_extension) + one-shot
backfill from property_details.listing_events for pre-trigger history.
Climate risk First Street
- Flood 1/10 Low FEMA zone X (unshaded) · 0% chance over 30 yrs
- Wildfire 1/10 Low
- Heat 3/10 Moderate 7 d/yr ≥94°F today · 17 d/yr by 30 yrs out
- Wind 2/10 Low 100% chance of damaging wind over 30 yrs
- Air quality 1/10 Low 0 unhealthy d/yr today · 0 by 30 yrs out
Nearby sold comps map
Loading sold comps map…
Walkable amenities ~0.75 mi
Loading nearby amenities…
Taxation est. · year 1
- Rental income
- $17,400
- − Mortgage interest
- −$2,409
- − Property taxes
- −$645
- − Insurance
- −$215
- − Repairs & maintenance
- −$1,392
- − Management
- −$1,392
- − Depreciation
- −$1,251
- Taxable income
- $10,096
- Est. tax owed @ 24.0%
- −$2,423
- After-tax cash flow
- $7,757/yr
For passive investors: Depreciation is non-cash, so a rental often shows a tax loss while cash-flowing — sheltering income. Rental losses are passive: they offset passive income freely, and up to $25,000/yr can offset ordinary (W-2) income if you actively participate and your MAGI is under $100k (phasing out to $0 by $150k); unused losses carry forward. On sale, claimed depreciation is recaptured at up to 25%, and gains may owe capital-gains tax (a 1031 exchange can defer both). Figures are a year-1 estimate at your 24.0% rate — not tax advice; consult a CPA.
Schools (NCES district)
- District
- Norwich City School District
- NCES district ID
- 3621330
- Math proficiency
- 42% ▼ -13.00%
- Reading proficiency
- 43% ▲ 1.00%
- Median HH income
- $40,687
- Composite
- 35.68/100
- National rank
- #4874
- State rank
- #498 of 590 in NY
Livability — Norwich
- Score
- 70/100
- State rank
- #447
- US rank
- #7857
Category grades
Schools grade is shown separately in the Schools card above.
Census & demographics
- Census place
- Norwich, NY
- City population
- 12,855
- Population (ZIP)
- 12,855
Population outlook (Chenango County) Hauer SSP2
- Today (2025)
- 45,669 people
- By 2030
- 43,484 · -4.8%
- By 2040
- 38,774 · -15.1%
- By 2050
- 34,000 · -25.6%
- By 2075
- 24,637 · -46.1%
- By 2100
- 16,452 · -64.0%
Race, ethnicity, and origin ACS 2023
- Neighborhood character
- Predominantly White (90%)
- Race & ethnicity
- White 90% Hispanic / Latino 5% Two or more races 4%
- Common ancestry
- Lithuanian 3% Slovak 2% Iranian 2%
- Foreign-born
- 4% · Canada
- Languages at home
- 95% English-only · Spanish 3% German/W. Germanic 0%
Political lean MEDSL · Chenango
- 2024 margin
- Strong R (+27.2) · D 36.4% · R 63.6%
- 2008→2024 swing
- -26.1pp toward R · 2008: -1.1pp · 2024: -27.2pp
- All cycles
- 2024: R+27.2 2020: R+23.3 2016: R+28.1 2012: R+3.4 2008: R+1.1
Not yet ingested
- Civics
- —
Market trends
- HPI YoY
- ▲ 21.23%
- Current HPI
- 280.463
- Rent YoY
- —
- Metro
- —
- State GDP YoY
- ▲ 2.60%
- F500 in state
- 92
Industry mix (Fortune 500 HQ in NY)
| Industry | F500 HQs | Revenue |
|---|---|---|
| Financial Services | 10 | $950B |
|
||
| Consumer Goods | 9 | $162B |
|
||
| Insurance | 4 | $225B |
|
||
| Telecommunications | 2 | $144B |
|
||
| Pharmaceuticals | 2 | $112B |
|
||
| Media / Entertainment | 2 | $69B |
|
||
Price history
+258.3% since first listed10 events — show timeline
- 2026-05-21 Listed $43,000 GBAOR
- 2016-05-27 Sold (MLS) $53,839 UNYREIS
- 2016-05-26 Sold (Public Records) $57,500 Public Records
- 2015-08-13 Listed $54,900 UNYREIS
- 2014-07-08 Listed $59,900 UNYREIS
- 2007-12-14 Sold (Public Records) $59,890 Public Records
- 2007-12-14 Sold (MLS) $56,500 UNYREIS
- 2007-06-10 Listed $59,900 UNYREIS
- 2001-06-25 Sold (Public Records) $34,900 Public Records
- 1999-11-01 Sold (Public Records) $12,000 Public Records
Property tax history
+5.4%/yrLatest (2025): $2,642 · +1.4% YoY. Source: county tax records.
Cash-flow waterfall
monthlySold comps — $/sqft
last 12 mo · ≤1 miLoading sold comps…