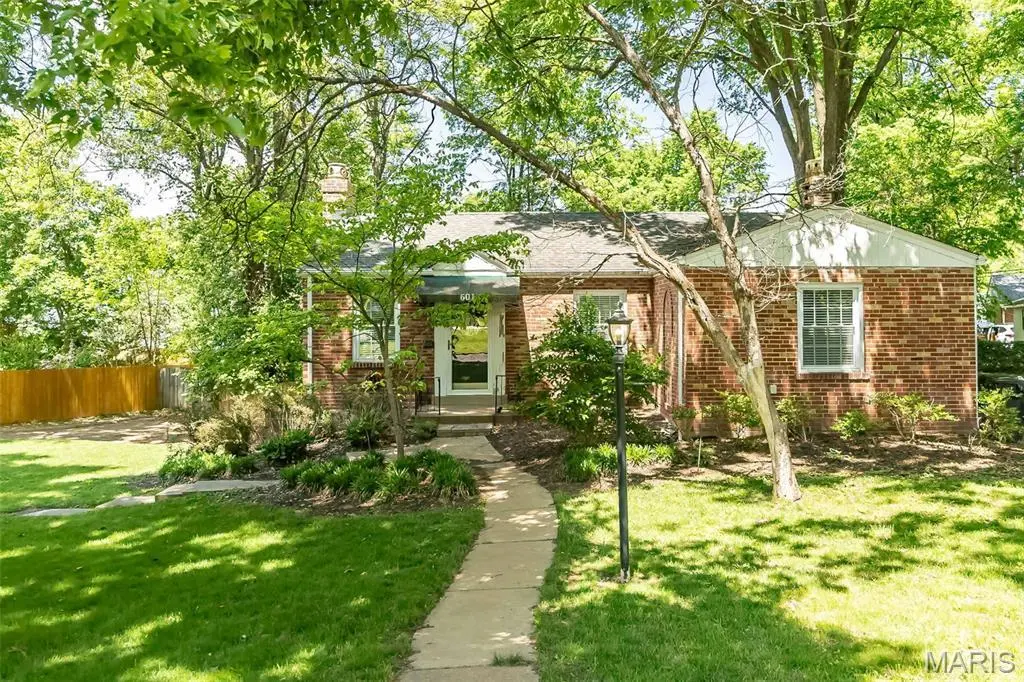
601 Woodard Dr · Kirkwood, MO
Flood risk 1/10 · Minimal
- FEMA flood zone
- X (unshaded)
- Chance of flooding over 30 yrs
- 0.0%
- Est. flood insurance / yr
- $473 – $860
Fire risk 1/10 · Minimal
- Est. fire insurance / yr
- $1,054 – $1,958
Heat risk 4/10 · Minor
- Hot days now (above 106°F)
- 7 days/yr
- Hot days in 30 yrs
- 21 days/yr
Wind risk 2/10 · Minimal
- Chance of severe wind over 30 yrs
- 1.0%
Air-quality risk 3/10 · Minor
- Unhealthy air days now
- 2 days/yr
- Unhealthy air days in 30 yrs
- 4 days/yr
Risk factors via First Street. Map © Google.
Why this score? — see what drove the D grade
The composite is a weighted blend of 9 inputs, each scored 0–100. Each bar is that input's sub-score; the figure is the points it added to the 100-point composite (weight × sub-score).
- ARV discount +15.0/15.0
- Cash flow +7.1/30.0
- Schools +5.7/10.0
- Rent growth +4.2/5.0
- Livability +3.9/5.0
- Condition / age +2.5/5.0
- 1% rule +1.6/10.0
- DSCR +1.3/10.0
- Appreciation +0.0/10.0
$265,000
🖨 Deal sheet (PDF) 📄 Offer letter ✓ Due diligence
Listing remarks
RARE opportunity to BUILD YOUR DREAM HOME or call this quaint, all brick gem your very own! PRIME LOT--1/3 acre located on a quiet cul-de-sac! Whether you join other new construction ($1 million+) homes or enjoy this charming home as your own or as a rental property, the possibilities are endless! Natural light fills the living room with stone fireplace and french doors leading to the large, screened porch. A spacious dining room opens to the living area-perfect for everyday living and entertaining. Two bedrooms, updated kitchen, and an updated full bath complete the main level's perfect picture. A partially finished lower level includes a cozy family room with stone fireplace, possible 3r
Key facts
- 0.3 acre lot
- Garage
- Built 1941
Property features AI
Exterior
- Parking: Attached garage (1-car) with garage door opener; garage faces rear
- Utilities: Public water; Public sewer; Electric service (Ameren); Cable available; Electricity connected; Natural gas connected; Sewer connected; Water connected
- Home design: Single-family residence; One-level with finished basement; Brick exterior
- Construction: Brick construction; Stone foundation
- Exterior features: Rear screened porch; Fenced backyard; Cul-de-sac lot; Level lot
Interior
- Kitchen: Dishwasher; Microwave; Gas Range; Refrigerator; Disposal
- Bedrooms: 2 bedrooms on the main level
- Flooring: Wood flooring
- Bathrooms: 2 full bathrooms (one on main level, one in lower level/basement)
- Heating & cooling: Natural gas heating; Central air conditioning
- Interior features: Dishwasher; Disposal; Microwave; Gas Range; Refrigerator; Gas Water Heater; Wood flooring; Two fireplaces (living room and basement); Basement partially finished with full bathroom, sleeping area, sump pump and walk-out access
- Laundry & utility: Gas water heater
Neighborhood map
What this means for you Summary
Snapshot
- This is a 2-bed/2.0-bath single-family listed at $265k.
Deal economics
- At list price, monthly cash flow is $-381 ($-5k/yr) — negative.
- To cash-flow at today's rent, offer at most $198k (25.4% below list).
- To meet the 1% rule (rent ≥ 1% of price), the offer needs to be $175k (33.8% below list).
- Recommended offer: $175k (33.8% below list) — sets the bar for 1% rule.
- Cap rate 4.6% vs local median 2.4% in Kirkwood — top-decile yield for the area; either an underpriced asset or a hidden risk that comps aren't pricing in. Stress-test before assuming the spread holds.
Location & tenants
- Location reads 78/100 on livability (#27 in MO, #2,478 nationally) — a middle-class / working-renter tenant base. Strengths: employment A+, housing A+, crime B; Watch: cost of living C-, commute F.
- Kirkwood R-VII (suburban): math 57% / reading 68% proficiency, ranked #5 of 324 in MO (top 2%) — acceptable for families but not a draw, mixed tenant base, ~2y average lease; only 11% free/reduced lunch — higher-income household profile.
- Zoned schools: W. W. Keysor Elem. (math 56% / reading 66%, grade B, #114 of 1,115 statewide, top 10%, 618 students, 5% FRL); Kirkwood Sr. High (math 72% / reading 79%, grade A-, #3 of 521 statewide, top 0%, 1,775 students, 11% FRL) — zoned schools at 8% FRL track the district average.
- Market conditions: Rents rising fast (+6.6%/yr); 214 active listings in the ZIP; 18 comparable units currently listed for rent nearby; rentals leasing fast (median 9d on market — plan ~1-2 weeks tenant-placement turnaround); high-income renter base; 920 units permitted in St. Louis County in 2024 (250 in 5+ unit buildings).
- This rent is only 15% of the median local income ($136k/yr) — well below the 30% rent-burden line; pricing power to push rent on renewal without tenant pushback.
Forward outlook
- Local home prices are declining (-3.0%/yr); year-one equity from $2k of loan paydown is wiped out by about $8k of value loss. Plan a longer hold.
Negotiation context
- Only 4 days on market — expect competitive offers; lowballing is unlikely to land.
- 3 sale attempts with the ask held roughly flat each time — persistent listings suggest the price (not the market) is what's stuck; bring a comps-based counter.
- Current owner paid $220k; 20% above their basis — modest negotiation headroom, anchor on the comps not their cost.
Risks & watch-outs
- Watch-outs: built in 1941 — expect roof / HVAC / electrical / plumbing capex.
Questions for the listing agent
- What do current leases actually rent for vs. the listed asking? Can we see a recent rent roll and the last 12 months of T-12 income?
- Built in 1941 — when were the roof, HVAC, electrical panel, plumbing, and water heater last replaced?
- Is there a deadline driving the sale (1031 exchange, divorce, estate, relocation)? That informs how much negotiation room exists.
- Schools are A-rated — typically a magnet for longer-tenancy family renters. What's the average tenant stay here, and is there a school-zone premium baked into asking?
- The area grade is low — what's the realistic commute time and amenity access for the typical tenant pool here? Any planned neighborhood developments (good or bad) we should know about?
- What's the average days-on-market for RENTAL listings here right now (not sales)? A rising rental-DOM trend means longer vacancies and softer asking-rent achievability than the comps imply.
- What's the recent tenant-quality profile in this submarket — average credit score on applications, eviction rate, late-payment / NSF rate, and stable-employment percentage? A property-management company in the area should have these aggregated.
- How much new for-sale + rental construction is in the pipeline within 1–3 miles? Heavy new supply typically softens prices + rents 12–24 months out; constrained supply supports both.
Investment metrics
- 1% rule
- 0.66% ✗
- Cap rate
- 4.57%
- Cash-on-cash
- -6.16%
- DSCR
- 0.73
- GRM
- 12.6
CMA / ARV
- ARV (median comp)
- $367,876
- List price
- $265,000
- Delta
- -27.96%
- Verdict
- UNDERPRICED
- Comps
- 20 within 1.0 mi
Show comp detail 12 sales within ~0.75 mi
| Address | Dist | Beds/Ba | Sqft | Sold | Price | $/sf | Match |
|---|---|---|---|---|---|---|---|
| 616 Hickory Hollow Ln | 0.16mi | 2/2.0 | 1,200 (+3%) | 11mo | $399,000 | $333 | 78 |
| 603 Mclain Ln | 0.06mi | 2/2.0 | 1,313 (+12%) | 8mo | $310,000 | $236 | 70 |
| 1011 Brooksgate Manor Dr | 0.45mi | 2/1.5 | 1,207 (+3%) | 7mo | $269,900 | $224 | 65 |
| 332 Caroline Ave | 0.40mi | 3/2.0 (+1) | 1,137 (-3%) | 10mo | $389,900 | $343 | 64 |
| 507 Alphonse Dr | 0.26mi | 2/2.0 | 1,284 (+10%) | 11mo | $350,000 | $273 | 62 |
| 442 Magnolia Ave | 0.22mi | 2/1.0 | 1,295 (+11%) | 9mo | $199,900 | $154 | 60 |
| 1001 Maeville Dr | 0.44mi | 3/1.5 (+1) | 1,176 (+1%) | 14mo | $294,900 | $251 | 60 |
| 703 S Geyer Rd | 0.11mi | 3/1.0 (+1) | 1,312 (+12%) | 8mo | $250,000 | $191 | 59 |
| 435 Heman Dr | 0.21mi | 2/1.0 | 1,023 (-12%) | 12mo | $210,000 | $205 | 56 |
| 941 Harvey St | 0.58mi | 2/1.0 | 1,266 (+8%) | 15mo | $299,900 | $237 | 42 |
| 1011 Couch Ave | 0.58mi | 3/3.0 (+1) | 1,320 (+13%) | 14mo | $475,000 | $360 | 30 |
| 285 Frieda Ave | 0.70mi | 3/1.0 (+1) | 1,036 (-11%) | 15mo | $349,999 | $338 | 27 |
Match score weights: distance 35% · size 25% · config 20% · recency 20%. Top-matched comps best support the ARV.
Projected returns pro-forma
-3.0% appreciation · 6.63% rent growth · sell at horizon
- IRR
- -23.1%
- Equity multiple
- 0.18×
- Total profit
- $-60,583
- Equity at exit
- $39,512
- IRR
- -10.6%
- Equity multiple
- 0.26×
- Total profit
- $-54,694
- Equity at exit
- $22,912
Cash invested: $74,200 (down + closing). Projections, not guarantees.
Landlord ↔ Tenant lean methodology
- Overall (STATE)
- 81 Strongly Landlord-Friendly
- State Missouri
- 81 Strongly Landlord-Friendly · R+10
- County
- — inherits STATE
- City
- — inherits STATE
ZIP-level market 63122
- Rents YoY
- 6.6%
- Active inventory
- 214
- Price-to-rent
- 12.6×
Monthly cashflow live
- Estimated rent
- $1,754 high interval (Pro) →
- Mortgage (P&I)
- −$1,390
- Tax from tax record
- −$267 /mo · $3,202/yr
- Insurance
- −$110
- HOA
- −$0
- Vacancy / Maint / Mgmt
- −$368
- Net cashflow
- $-381
Break-even live
Sensitivity live
| Price | -10% $-231 | -5% $-306 | +0% $-381 | +5% $-456 | +10% $-531 |
|---|---|---|---|---|---|
| Rent | -10% $-520 | -5% $-450 | +0% $-381 | +5% $-312 | +10% $-242 |
| Rate | -1.0pp $-248 | -0.5pp $-314 | base $-381 | +0.5pp $-450 | +1.0pp $-520 |
UW: 25.0% down · 7.5% · 30yr · 1.5% tax · 5.0% vac · 8.0% maint · 8.0% mgmt
Financing live
Cash to close
- Down payment
- $66,250
- Closing costs
- $7,950
- Reserves months
- —
- Total cash needed
- —
Loan-product check · same deal, 3 products live
Conventional
25% down · 7.5% · 30yr
- Down + closing
- —
- Monthly P&I
- —
- Monthly cashflow
- —
- DSCR
- —
- Eligible?
- —
Personal DTI + credit; lowest rate.
DSCR
20% down · 8.5% · 30yr
- Down + closing
- —
- Monthly P&I
- —
- Monthly cashflow
- —
- DSCR
- —
- Eligible?
- —
No personal income docs; deal must DSCR.
Hard money
10% down · 12.0% · 12mo
- Down + closing
- —
- Monthly P&I
- —
- Monthly cashflow
- —
- DSCR
- —
- Eligible?
- —
Short-term bridge; refi at stabilization.
Rent comps 18 comps
| Address | Beds | Baths | Sqft | Rent | $/sqft | DOM | Units | Dist |
|---|---|---|---|---|---|---|---|---|
| 551 S Clay Ave Saint Louis, MO | 3.0 | 2.0 | 1250 | $1,650 | $1.32 | 9d | 1 | 0.45mi |
| 10820 Big Bend Rd Kirkwood, MO | 2.0 | 1.0 | 1000 | $1,595 | $1.59 | 45d | 1 | 0.57mi |
| 447 W Jefferson Ave Kirkwood, MO | 1.0 | 1.0 | 850 | $1,695 | $1.99 | 25d | 1 | 0.76mi |
| 200 Kirkwood Pl Kirkwood, MO | 1.0 | 1.5 | 868 | $1,850 | $2.13 | 45d | 1 | 0.87mi |
| 141 E Madison Ave Kirkwood, MO | 1.0–2.0 | 1.0–2.0 | 1017 | $2,765 | $2.72 | 0d | 11 | 0.92mi |
| 1722 W Woodbine Ave Saint Louis, MO | 2.0 | 1.0 | 898 | $1,395 | $1.55 | 0d | 1 | 0.98mi |
| 907 Carriage Circle Ln Unit 901F-CCL Kirkwood, MO | 2.0 | 2.0 | 985 | $1,750 | $1.78 | 45d | 1 | 1.09mi |
| 416 N Kirkwood Rd St. Louis, MO | 2.0 | 1.0–2.0 | 890 | $3,751 | $4.21 | 0d | 5 | 1.11mi |
| 1937 Greenpoint Dr Kirkwood, MO | 2.0 | 2.0 | 992 | $1,600 | $1.61 | 45d | 1 | 1.21mi |
| 1926 Hunting Lake Ct Kirkwood, MO | 3.0 | 2.0 | 1216 | $2,000 | $1.64 | 3d | 1 | 1.21mi |
| 1943 Greenpoint Dr Kirkwood, MO | 2.0 | 2.0 | 1216 | $1,595 | $1.31 | 0d | 1 | 1.22mi |
| 1943 Greenpoint Dr Kirkwood, MO | 2.0 | 2.0 | 1216 | $1,595 | $1.31 | 9d | 1 | 1.22mi |
| 240 W Essex Ave Kirkwood, MO | 3.0 | 2.0 | 1500 | $1,650 | $1.10 | 45d | 1 | 1.22mi |
| 1968 Green Glen Dr Kirkwood, MO | 2.0 | 2.0 | 929 | $1,600 | $1.72 | 19d | 1 | 1.25mi |
| 1969 Green Glen Dr Kirkwood, MO | 2.0 | 2.0 | 929 | $1,595 | $1.72 | 9d | 1 | 1.26mi |
| 1969 Green Glen Dr Kirkwood, MO | 2.0 | 2.0 | 929 | $1,595 | $1.72 | 0d | 1 | 1.26mi |
| 1996 Greenglen Dr #103 Saint Louis, MO | 2.0 | 2.0 | 1015 | $1,700 | $1.67 | 0d | 1 | 1.29mi |
| 467 S Holmes Ave Unit B Kirkwood, MO | 2.0 | 1.0 | 700 | $1,099 | $1.57 | 25d | 1 | 1.40mi |
Listing history 12 events
-
2026-05-15status Pending 877-char remark
-
2026-05-15status Active 877-char remark
-
2026-05-10status Pending 877-char remark
-
2026-05-07$265,000 Active 877-char remark
-
2026-05-02historical $265,000 877-char remark
-
2026-05-02$265,000 Active 877-char remark
-
2006-09-19soldstatus $220,000
-
2002-11-08soldstatus
-
2002-11-08soldstatus $170,000
-
2001-02-23soldstatus $162,500
-
2000-10-31soldstatus $112,500
-
2000-09-22soldstatus $105,000
ⓘ Source: listings_history table (triggers on properties + properties_extension) + one-shot
backfill from property_details.listing_events for pre-trigger history.
Tax reassessment forecast MO · Resets to sale price
- Current annual tax
- $3,202 · $267/mo
- Projected year-2 tax
- $3,202 · $267/mo
- Expected delta
- $0/yr ($0/mo · 0.0%)
ⓘ Screening estimate from a state-policy table — verify with the county assessor before closing.
Climate risk First Street
- Flood 1/10 Low FEMA zone X (unshaded) · 0% chance over 30 yrs
- Wildfire 1/10 Low
- Heat 4/10 Moderate 7 d/yr ≥106°F today · 21 d/yr by 30 yrs out
- Wind 2/10 Low 100% chance of damaging wind over 30 yrs
- Air quality 3/10 Moderate 2 unhealthy d/yr today · 4 by 30 yrs out
Nearby sold comps map
Loading sold comps map…
Walkable amenities ~0.75 mi
Loading nearby amenities…
Taxation est. · year 1
- Rental income
- $21,051
- − Mortgage interest
- −$14,844
- − Property taxes
- −$3,202
- − Insurance
- −$1,325
- − Repairs & maintenance
- −$1,684
- − Management
- −$1,684
- − Depreciation
- −$7,709
- Taxable loss
- −$9,397
- Est. tax savings @ 24.0%
- +$2,255
- After-tax cash flow
- $-2,317/yr
For passive investors: Depreciation is non-cash, so a rental often shows a tax loss while cash-flowing — sheltering income. Rental losses are passive: they offset passive income freely, and up to $25,000/yr can offset ordinary (W-2) income if you actively participate and your MAGI is under $100k (phasing out to $0 by $150k); unused losses carry forward. On sale, claimed depreciation is recaptured at up to 25%, and gains may owe capital-gains tax (a 1031 exchange can defer both). Figures are a year-1 estimate at your 24.0% rate — not tax advice; consult a CPA.
Schools (NCES district)
- District
- Kirkwood R-VII
- NCES district ID
- 2916770
- Math proficiency
- 57% ▼ -9.00%
- Reading proficiency
- 68% ▼ -5.00%
- Median HH income
- $85,581
- Composite
- 56.51/100
- National rank
- #1153
- State rank
- #5 of 324 in MO
Livability — Kirkwood
- Score
- 78/100
- State rank
- #27
- US rank
- #2478
Category grades
Schools grade is shown separately in the Schools card above.
Census & demographics
- Census place
- Kirkwood, MO
- County
- Saint Louis County · 888,823 people
- City population
- 41,634
- Metro
- St. Louis, MO-IL
- Population (ZIP)
- 41,634
- Household income
- $136,385
- Rent vs Own
- Severe rent burden
- 738.0
Population outlook (St. Louis County) Hauer SSP2
- Today (2025)
- 1,025,227 people
- By 2030
- 1,028,023 · +0.3%
- By 2040
- 1,020,940 · -0.4%
- By 2050
- 1,007,280 · -1.8%
- By 2075
- 987,277 · -3.7%
- By 2100
- 921,984 · -10.1%
Race, ethnicity, and origin ACS 2023
- Neighborhood character
- Predominantly White (84%)
- Race & ethnicity
- White 84% Two or more races 8% Black 4% Hispanic / Latino 2% Asian 2%
- Common ancestry
- Lithuanian 3% Italian 3% Slovak 3%
- Foreign-born
- 3% · Canada, China
- Languages at home
- 96% English-only · Spanish 1% Other Indo-European 1% Chinese 1%
Political lean MEDSL · St. Louis
- 2024 margin
- Strong D (+23.4) · D 60.8% · R 37.4% · Other 1.7%
- 2008→2024 swing
- +3.5pp toward D · 2008: 19.9pp · 2024: 23.4pp
- All cycles
- 2024: D+23.4 2020: D+24.0 2016: D+16.2 2012: D+13.7 2008: D+19.9
Not yet ingested
- Civics
- —
Market trends
- HPI YoY
- ▼ -413.98%
- Current HPI
- 242.2782
- Rent YoY
- ▲ 6.63%
- Metro
- St. Louis, MO-IL
- State GDP YoY
- ▲ 1.84%
- F500 in state
- 20
Industry mix (Fortune 500 HQ in MO)
| Industry | F500 HQs | Revenue |
|---|---|---|
| Healthcare | 1 | $163B |
|
||
| Insurance | 1 | $21B |
|
||
| Industrial Technology | 1 | $17B |
|
||
| Retail | 1 | $16B |
|
||
| Industrial Distribution | 1 | $10B |
|
||
| Utilities | 1 | $9B |
|
||
Price history
+152.4% since first listed13 events — show timeline
- 2026-06-03 Sold (MLS) — MARIS as Distributed by MLS Grid
- 2026-05-15 Pending — MARIS as Distributed by MLS Grid
- 2026-05-15 Relisted — MARIS as Distributed by MLS Grid
- 2026-05-10 Pending — MARIS as Distributed by MLS Grid
- 2026-05-07 Listed $265,000 MARIS as Distributed by MLS Grid
- 2026-05-02 Coming Soon $265,000 MARIS as Distributed by MLS Grid
- 2026-05-02 Listed $265,000 MARIS as Distributed by MLS Grid
- 2006-09-19 Sold (Public Records) $220,000 Public Records
- 2002-11-08 Sold (Public Records) $170,000 Public Records
- 2002-11-08 Sold (Public Records) — Public Records
- 2001-02-23 Sold (Public Records) $162,500 Public Records
- 2000-10-31 Sold (Public Records) $112,500 Public Records
- 2000-09-22 Sold (Public Records) $105,000 Public Records
Property tax history
+2.2%/yrLatest (2022): $3,202 · +1.3% YoY. Source: county tax records.
Cash-flow waterfall
monthlySold comps — $/sqft
last 12 mo · ≤1 miLoading sold comps…