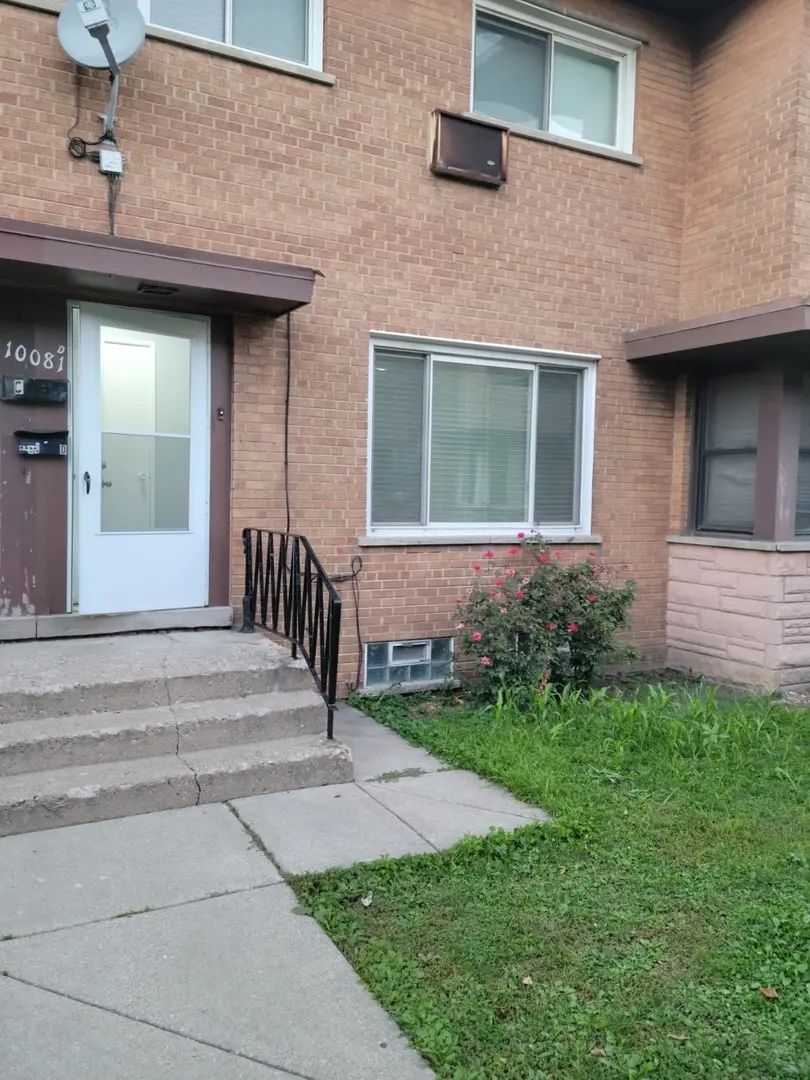
10081 Frontage Rd Unit D · Wilmette, IL
Flood risk 5/10 · Moderate
- FEMA flood zone
- X (unshaded)
- Chance of flooding over 30 yrs
- 0.49%
- Est. flood insurance / yr
- $473 – $860
Fire risk 1/10 · Minimal
- Est. fire insurance / yr
- $804 – $1,492
Heat risk 2/10 · Minimal
- Hot days now (above 99°F)
- 7 days/yr
- Hot days in 30 yrs
- 14 days/yr
Wind risk 2/10 · Minimal
- Chance of severe wind over 30 yrs
- 0.0%
Air-quality risk 4/10 · Minor
- Unhealthy air days now
- 5 days/yr
- Unhealthy air days in 30 yrs
- 5 days/yr
Risk factors via First Street. Map © Google.
Why this score? — see what drove the B- grade
The composite is a weighted blend of 9 inputs, each scored 0–100. Each bar is that input's sub-score; the figure is the points it added to the 100-point composite (weight × sub-score).
- Cash flow +30.0/30.0
- DSCR +10.0/10.0
- 1% rule +9.1/10.0
- Schools +7.7/10.0
- Livability +4.2/5.0
- Rent growth +3.6/5.0
- ARV discount +2.9/15.0
- Condition / age +2.5/5.0
- Appreciation +0.0/10.0
$339,500
🖨 Deal sheet 📄 Offer letter ✓ Due diligence
Listing remarks
Located directly across from Old Orchard Mall, this stunning townhouse was beautifully rehabbed in 2022 with modern updates throughout. Investor's special - no HOA. The spacious, fully finished basement that can serve as a bedroom, office, or additional living area. The chef's kitchen boasts original solid wood cabinetry enhanced by stainless steel appliances, blending timeless charm with modern functionality. This move-in ready home combines elegant finishes with a prime location-an excellent opportunity you won't want to miss!
Key facts
- Prime location
- Chef's kitchen
- Built 1958
Tags
Property features AI
Finance
- Other: 7 units in the building; Living area sourced from appraiser; Lot size information from county records
- HOA & community: No master association fee required; Pets allowed (cats and dogs allowed; max pet weight ~25 lbs)
Exterior
- Utilities: Public water; Public sewer; Electric with circuit breakers
- Home design: Attached single-family townhouse, 2-story; Entry level is 1; Fee simple ownership
- Construction: Brick construction; Built 61–70 years ago; Pre-1978 construction
- Exterior features: Attached townhouse setting; Property currently leased; Rehab completed in 2022
Interior
- Kitchen: Main-level kitchen (approx. 10 x 9)
- Bedrooms: 3 bedrooms (Master on second level); Second-level bedrooms approximately 13 x 10, 10 x 10, and 10 x 7
- Bathrooms: 1 full bath; 1 half bath
- Heating & cooling: Natural gas forced-air heating; Central air conditioning
- Interior features: Finished full basement; 7 total rooms
- Laundry & utility: Laundry room
Neighborhood map
What this means for you Summary
Snapshot
- This is a 3-bed/1.5-bath townhouse listed at $340k.
Deal economics
- At list price, monthly cash flow is $2k ($18k/yr) — positive.
- The deal already cash-flows at list — no discount required.
- Meets the 1% rule at list price ($5k rent vs $340k).
- Recommended offer: $329k (3.0% below list) — sets the bar for market timing.
- Cap rate 11.6% vs local median 2.0% in Wilmette — top-decile yield for the area; either an underpriced asset or a hidden risk that comps aren't pricing in. Stress-test before assuming the spread holds.
Location & tenants
- Location reads 83/100 on livability (#43 in IL, #892 nationally) — a professional / high-income tenant draw. Strengths: schools A+, crime A+, commute A+; Watch: cost of living F.
- New Trier Twp Hsd 203 (suburban): math 76% / reading 80% proficiency, ranked #2 of 620 in IL (top 0%) — strong family-tenant draw, lease renewals of 3-5y typical.
- Market conditions: Rents rising fast (+4.4%/yr); 1 active listings in the ZIP; 3 comparable units currently listed for rent nearby; rentals leasing fast (median 1d on market — plan ~1-2 weeks tenant-placement turnaround); solid renter incomes; 6,272 units permitted in Cook County in 2024 (4,658 in 5+ unit buildings).
- At $4,774/mo this rent would consume 73% of the median local household income ($79k/yr) (locally 1316% of renters already pay >50% of income on rent) — very limited rent-growth headroom before tenants either downsize or default.
Forward outlook
- Local home prices are declining (-3.0%/yr); year-one equity from $2k of loan paydown is wiped out by about $10k of value loss. Plan a longer hold.
- At projected returns (-3.0% appreciation + 4.4% rent growth), your $95k cash investment doubles in ~6 years — after that, you're playing with house money.
Negotiation context
- It's been on market 47 days — a 3% lower offer ($329k) is reasonable based on typical stale-listing flexibility.
- Current owner paid $178k; list at $340k implies a 91% gain — meaningful room to come down on a strong offer.
Risks & watch-outs
- Watch-outs: built in 1958 — expect roof / HVAC / electrical / plumbing capex.
- Climate carrying-cost: moderate flood risk — expect insurance premiums to compound above CPI over the hold.
Questions for the listing agent
- It's been on market 47 days. Have you received any prior offers? Is the seller open to a 3% concession, seller financing, or rate buy-down credit?
- Built in 1958 — when were the roof, HVAC, electrical panel, plumbing, and water heater last replaced?
- Is there a deadline driving the sale (1031 exchange, divorce, estate, relocation)? That informs how much negotiation room exists.
- Schools are A-rated — typically a magnet for longer-tenancy family renters. What's the average tenant stay here, and is there a school-zone premium baked into asking?
- What's the average days-on-market for RENTAL listings here right now (not sales)? A rising rental-DOM trend means longer vacancies and softer asking-rent achievability than the comps imply.
- What's the recent tenant-quality profile in this submarket — average credit score on applications, eviction rate, late-payment / NSF rate, and stable-employment percentage? A property-management company in the area should have these aggregated.
- How much new for-sale + rental construction is in the pipeline within 1–3 miles? Heavy new supply typically softens prices + rents 12–24 months out; constrained supply supports both.
Investment metrics
- 1% rule
- 1.41% ✓
- Cap rate
- 11.60%
- Cash-on-cash
- 18.96%
- DSCR
- 1.84
- GRM
- 5.9
CMA / ARV
- ARV (on-the-fly)
- $308,060
- Comps found
- 12
Show comp detail 12 sales within ~0.75 mi
| Address | Dist | Beds/Ba | Sqft | Sold | Price | $/sf | Match |
|---|---|---|---|---|---|---|---|
| 10059 Frontage Rd Unit F | 0.04mi | 3/1.5 | 1,058 (+0%) | 2mo | $310,000 | $293 | 96 |
| 10077 Frontage Rd Unit F | 0.01mi | 3/1.5 | 1,055 (0%) | 6mo | $300,000 | $284 | 94 |
| 10055 Frontage Rd Unit F | 0.05mi | 3/1.5 | 1,055 (0%) | 8mo | $290,000 | $275 | 91 |
| 4710 Russett Ln #201 | 0.47mi | 2/2.0 (-1) | 1,061 (+1%) | 9mo | $215,000 | $203 | 63 |
| 4710 Russett Ln Unit R1 | 0.47mi | 2/2.0 (-1) | 1,101 (+4%) | 2mo | $210,000 | $191 | 62 |
| 9725 Woods Dr #1005 | 0.56mi | 2/2.0 (-1) | 1,181 (+12%) | 2mo | $356,000 | $301 | 46 |
| 10015 Beverly Dr #205 | 0.53mi | 2/2.0 (-1) | 1,200 (+14%) | 2mo | $248,000 | $207 | 44 |
| 9725 Woods Dr #507 | 0.56mi | 2/2.0 (-1) | 1,200 (+14%) | 2mo | $360,000 | $300 | 43 |
| 9725 Woods Dr #305 | 0.56mi | 2/2.0 (-1) | 1,200 (+14%) | 3mo | $350,000 | $292 | 42 |
| 10015 Beverly Dr #105 | 0.53mi | 2/2.0 (-1) | 1,200 (+14%) | 5mo | $171,000 | $143 | 41 |
| 9725 Woods Dr #503 | 0.56mi | 2/2.0 (-1) | 1,200 (+14%) | 4mo | $398,000 | $332 | 41 |
| 9655 Woods Dr #1809 | 0.62mi | 2/2.0 (-1) | 1,200 (+14%) | 8mo | $375,000 | $313 | 35 |
Match score weights: distance 35% · size 25% · config 20% · recency 20%. Top-matched comps best support the ARV.
Projected returns pro-forma
-3.0% appreciation · 4.41% rent growth · sell at horizon
- IRR
- 12.4%
- Equity multiple
- 1.50×
- Total profit
- $47,562
- Equity at exit
- $50,621
- IRR
- 22.4%
- Equity multiple
- 3.04×
- Total profit
- $193,727
- Equity at exit
- $29,354
Cash invested: $95,060 (down + closing). Projections, not guarantees.
Landlord ↔ Tenant lean methodology
- Overall (STATE)
- 43 Moderately Tenant-Leaning
- State Illinois
- 43 Moderately Tenant-Leaning · D+7
- County
- — inherits STATE
- City
- — inherits STATE
ZIP-level market 60077
- Rents YoY
- 4.4%
- Active inventory
- 1
- Price-to-rent
- 5.9×
Monthly cashflow live
- Estimated rent
- $4,774 medium interval (Pro) →
- Mortgage (P&I)
- −$1,780
- Tax from tax record
- −$347 /mo · $4,168/yr
- Insurance
- −$141
- HOA
- −$0
- Vacancy / Maint / Mgmt
- −$1,003
- Net cashflow
- $1,502
Break-even live
UW: 25.0% down · 7.5% · 30yr · 1.5% tax · 5.0% vac · 8.0% maint · 8.0% mgmt
Financing live
Cash to close
- Down payment
- $84,875
- Closing costs
- $10,185
- Reserves months
- —
- Total cash needed
- —
Loan-product check · same deal, 3 products live
Conventional
25% down · 7.5% · 30yr
- Down + closing
- —
- Monthly P&I
- —
- Monthly cashflow
- —
- DSCR
- —
- Eligible?
- —
Personal DTI + credit; lowest rate.
DSCR
20% down · 8.5% · 30yr
- Down + closing
- —
- Monthly P&I
- —
- Monthly cashflow
- —
- DSCR
- —
- Eligible?
- —
No personal income docs; deal must DSCR.
Hard money
10% down · 12.0% · 12mo
- Down + closing
- —
- Monthly P&I
- —
- Monthly cashflow
- —
- DSCR
- —
- Eligible?
- —
Short-term bridge; refi at stabilization.
Rent comps 3 comps
| Address | Beds | Baths | Sqft | Rent | $/sqft | DOM | Units | Dist |
|---|---|---|---|---|---|---|---|---|
| 5424 Old Orchard Rd Skokie, IL | 1.0–4.0 | 1.0–3.5 | 1619 | $5,791 | $3.58 | 1d | 52 | 0.48mi |
| 9739 Woods Dr Skokie, IL | 1.0–3.0 | 1.0–3.0 | 1871 | $6,695 | $3.58 | 1d | 17 | 0.57mi |
| 3119 Lake Ave Unit E Wilmette, IL | 3.0 | 2.5 | 1458 | $4,147 | $2.84 | 24d | 1 | 0.95mi |
Listing history 18 events
-
2026-06-18days on market $339,500 Active 47 DOM
-
2026-06-17days on market $339,500 Active 46 DOM
-
2026-06-16days on market $339,500 Active 45 DOM
-
2026-06-15pricedays on market $339,500 Active 44 DOM
-
2026-06-13days on market $349,500 Active 42 DOM
-
2026-06-13days on market $349,500 Active 41 DOM
-
2026-06-09days on market $349,500 Active 38 DOM
-
2026-06-08days on market $349,500 Active 37 DOM
-
2026-06-07days on market $349,500 Active 36 DOM
-
2026-06-04days on market $349,500 Active 33 DOM
-
2026-06-03days on market $349,500 Active 32 DOM
-
2026-06-02days on market $349,500 Active 31 DOM
-
2026-06-01days on market $349,500 Active 30 DOM
-
2026-05-31days on market $349,500 Active 29 DOM
-
2026-05-02price $349,500
-
2026-05-02$249,500 Active
-
2019-10-31soldstatus $178,000
-
1986-09-01soldstatus $62,000
ⓘ Source: listings_history table (triggers on properties + properties_extension) + one-shot
backfill from property_details.listing_events for pre-trigger history.
Tax reassessment forecast IL · Partial reset (capped growth)
- Current annual tax
- $4,168 · $347/mo
- Projected year-2 tax
- $5,938 · $495/mo
- Expected delta
- +$1,769/yr (+$147/mo · 42.4%)
ⓘ Screening estimate from a state-policy table — verify with the county assessor before closing.
Climate risk First Street
- Flood 5/10 Major FEMA zone X (unshaded) · 49% chance over 30 yrs
- Wildfire 1/10 Low
- Heat 2/10 Low 7 d/yr ≥99°F today · 14 d/yr by 30 yrs out
- Wind 2/10 Low 0% chance of damaging wind over 30 yrs
- Air quality 4/10 Moderate 5 unhealthy d/yr today · 5 by 30 yrs out
Nearby sold comps map
Loading sold comps map…
Walkable amenities ~0.75 mi
Loading nearby amenities…
Taxation est. · year 1
- Rental income
- $57,289
- − Mortgage interest
- −$19,017
- − Property taxes
- −$4,168
- − Insurance
- −$1,698
- − Repairs & maintenance
- −$4,583
- − Management
- −$4,583
- − Depreciation
- −$9,876
- Taxable income
- $13,363
- Est. tax owed @ 24.0%
- −$3,207
- After-tax cash flow
- $14,821/yr
For passive investors: Depreciation is non-cash, so a rental often shows a tax loss while cash-flowing — sheltering income. Rental losses are passive: they offset passive income freely, and up to $25,000/yr can offset ordinary (W-2) income if you actively participate and your MAGI is under $100k (phasing out to $0 by $150k); unused losses carry forward. On sale, claimed depreciation is recaptured at up to 25%, and gains may owe capital-gains tax (a 1031 exchange can defer both). Figures are a year-1 estimate at your 24.0% rate — not tax advice; consult a CPA.
Schools (NCES district)
- District
- New Trier Twp Hsd 203
- NCES district ID
- 1728200
- Math proficiency
- 76% ▼ -4.00%
- Reading proficiency
- 80% ▼ -1.00%
- Median HH income
- $164,521
- Composite
- 76.94/100
- National rank
- #103
- State rank
- #2 of 620 in IL
Livability — Wilmette
- Score
- 83/100
- State rank
- #43
- US rank
- #892
Category grades
Schools grade is shown separately in the Schools card above.
Census & demographics
- Census place
- Wilmette, IL
- County
- Cook County · 4,486,803 people
- City population
- 27,333
- Metro
- Chicago-Naperville-Elgin, IL-IN-WI
- Population (ZIP)
- 28,501
- Household income
- $78,523
- Rent vs Own
- Severe rent burden
- 1316.0
Population outlook (Cook County) Hauer SSP2
- Today (2025)
- 5,347,519 people
- By 2030
- 5,357,703 · +0.2%
- By 2040
- 5,324,924 · -0.4%
- By 2050
- 5,230,762 · -2.2%
- By 2075
- 4,785,735 · -10.5%
- By 2100
- 4,188,836 · -21.7%
Race, ethnicity, and origin ACS 2023
- Neighborhood character
- Diverse neighborhood (Simpson 0.69)
- Race & ethnicity
- White 45% Asian 29% Hispanic / Latino 12% Black 10% Two or more races 8%
- Hispanic origin (detail)
- Mexican 8% Puerto Rican 3%
- Common ancestry
- Romanian 2% Scotch-Irish 2% American 2%
- Foreign-born
- 43% · Canada, China, Vietnam
- Languages at home
- 48% English-only · Other Indo-European 16% Spanish 8% Tagalog/Filipino 5%
Political lean MEDSL · Cook
- 2024 margin
- Solid D (+42.0) · D 70.4% · R 28.4% · Other 1.2%
- 2008→2024 swing
- -11.4pp toward R · 2008: 53.4pp · 2024: 42.0pp
- All cycles
- 2024: D+42.0 2020: D+50.3 2016: D+53.0 2012: D+49.4 2008: D+53.4
Not yet ingested
- Civics
- —
Market trends
- HPI YoY
- ▼ -185.81%
- Current HPI
- 182.9687
- Rent YoY
- ▲ 4.41%
- Metro
- Chicago-Naperville-Elgin, IL-IN-WI
- State GDP YoY
- ▲ 1.59%
- F500 in state
- 60
Industry mix (Fortune 500 HQ in IL)
| Industry | F500 HQs | Revenue |
|---|---|---|
| Insurance | 4 | $201B |
|
||
| Consumer Goods | 4 | $87B |
|
||
| Industrial Machinery | 3 | $64B |
|
||
| Healthcare | 2 | $55B |
|
||
| Retail / Pharmacy | 1 | $148B |
|
||
| Agriculture / Food | 1 | $86B |
|
||
Price history
+463.7% since first listed4 events — show timeline
- 2026-05-02 Price Changed $349,500 MRED as Distributed by MLS Grid
- 2026-05-02 Listed $249,500 MRED as Distributed by MLS Grid
- 2019-10-31 Sold (Public Records) $178,000 Public Records
- 1986-09-01 Sold (Public Records) $62,000 Public Records
Property tax history
+3.3%/yrLatest (2023): $4,168 · +3.4% YoY. Source: county tax records.
Cash-flow waterfall
monthlySold comps — $/sqft
last 12 mo · ≤1 miLoading sold comps…