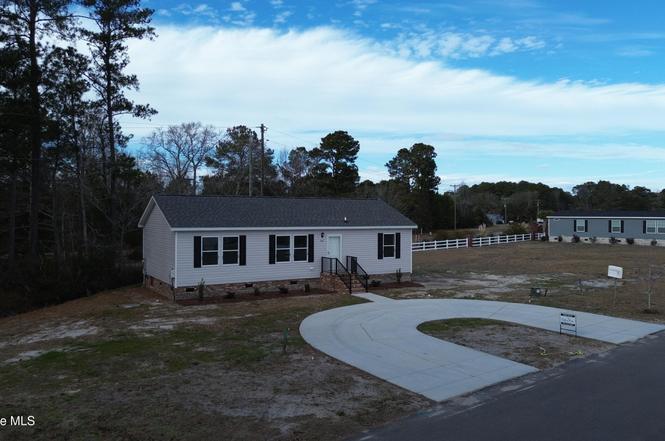
852 Yaupon Dr SW · Calabash, NC
Flood risk 1/10 · Minimal
- FEMA flood zone
- X (unshaded)
- Chance of flooding over 30 yrs
- 0.0%
- Est. flood insurance / yr
- $507 – $1,088
Fire risk 3/10 · Minor
- Est. fire insurance / yr
- $906 – $1,684
Heat risk 9/10 · Severe
- Hot days now (above 106°F)
- 7 days/yr
- Hot days in 30 yrs
- 18 days/yr
Wind risk 8/10 · Major
- Chance of severe wind over 30 yrs
- 99.0%
Air-quality risk 2/10 · Minimal
- Unhealthy air days now
- 1 days/yr
- Unhealthy air days in 30 yrs
- 1 days/yr
Risk factors via First Street. Map © Google.
Why this score? — see what drove the D- grade
The composite is a weighted blend of 9 inputs, each scored 0–100. Each bar is that input's sub-score; the figure is the points it added to the 100-point composite (weight × sub-score).
- Cash flow +10.3/30.0
- ARV discount +7.5/15.0
- Schools +3.9/10.0
- 1% rule +3.1/10.0
- Livability +3.1/5.0
- DSCR +3.0/10.0
- Rent growth +2.5/5.0
- Condition / age +2.5/5.0
- Appreciation +0.0/10.0
$264,900
🖨 Deal sheet (PDF) 📄 Offer letter ✓ Due diligence
Listing remarks
You are going to love this Modular home, charming and in the most convenient location. Close to Calabash and Sunset Beach. This is the good life. 3 bedrooms, 2 full baths, chef's kitchen and back deck. Close to shopping, dining, golf and more. Dont miss this home!
Key facts
- Modular home
- Close to golf
- Close to dining
Tags
Property features AI
Finance
- HOA & community: Homeowners association with $30 annual fee (about $2.50/month)
Exterior
- Parking: Circular driveway; Concrete parking surface
- Utilities: Public water; Sewer connected; Water connected; Underground utilities
- Home design: Single family residence; One level; New construction
- Construction: Vinyl siding with frame construction; Brick/mortar and block foundation
- Exterior features: Deck; Porch; Storm door(s); No fencing; Shingle roof; Paved road access; Private road frontage
Interior
- Kitchen: Refrigerator; Range
- Bedrooms: 6 total rooms (includes bedrooms and living spaces)
- Flooring: Carpet; Vinyl
- Bathrooms: 2 full bathrooms
- Heating & cooling: Heat pump heating; Electric heating; Central air conditioning; Heat pump cooling
- Interior features: Kitchen island; Accessible full bathroom; Unfurnished
- Laundry & utility: Washer hookup; Electric water heater
Neighborhood map
What this means for you Summary
Snapshot
- This is a 3-bed/2.0-bath land listed at $265k.
Deal economics
- At list price, monthly cash flow is $-144 ($-2k/yr) — negative.
- To cash-flow at today's rent, offer at most $244k (7.8% below list).
- To meet the 1% rule (rent ≥ 1% of price), the offer needs to be $214k (19.2% below list).
- Recommended offer: $214k (19.2% below list) — sets the bar for 1% rule.
- Cap rate 5.6% vs local median 4.1% in Calabash — top-decile yield for the area; either an underpriced asset or a hidden risk that comps aren't pricing in. Stress-test before assuming the spread holds.
Location & tenants
- Location reads 61/100 on livability (#487 in NC) — a middle-class / working-renter tenant base. Strengths: cost of living A+, housing A+, crime A; Watch: health & safety D, amenities F, commute F.
- Brunswick County Schools (rural): math 45% / reading 47% proficiency, ranked #82 of 178 in NC (top 46%) — families likely to look elsewhere, expect single-tenant / working-renter base with shorter leases.
- Zoned schools: Jessie Mae Monroe Elementary (math 43% / reading 41%, grade F, #633 of 1,410 statewide, top 48%, 394 students, 99% FRL); Shallotte Middle (math 40% / reading 50%, grade D, #160 of 475 statewide, top 35%, 674 students, 100% FRL); West Brunswick High (math 50% / reading 56%, grade C-, #281 of 535 statewide, top 53%, 1,526 students, 100% FRL) — zoned schools average 100% FRL vs 53% district-wide (46 pts higher); higher-poverty schools than district average — tighter screening recommended.
- Market conditions: 703 active listings in the ZIP; 8 comparable units currently listed for rent nearby; rentals at typical pace (median 16d on market — plan ~3-4 weeks tenant-placement turnaround); solid renter incomes; 6,112 units permitted in Brunswick County in 2024 (990 in 5+ unit buildings).
- This rent runs 34% of the median local income ($75k/yr) — at the standard rent-burdened threshold; future hikes will face affordability resistance.
Forward outlook
- Local home prices are declining (-3.0%/yr); year-one equity from $2k of loan paydown is wiped out by about $8k of value loss. Plan a longer hold.
- Brunswick County population projected at +36% by 2050 — long-run rental-demand tailwind backs the buy-and-hold thesis.
Negotiation context
- It's been on market 203 days — a 12% lower offer ($233k) is reasonable based on typical stale-listing flexibility.
Risks & watch-outs
- Climate carrying-cost: severe wind risk, 99% chance of damaging wind over 30y; extreme-heat days projected 7→18/yr by 2055 (HVAC capex compounding) — expect insurance premiums to compound above CPI over the hold.
Questions for the listing agent
- What do current leases actually rent for vs. the listed asking? Can we see a recent rent roll and the last 12 months of T-12 income?
- It's been on market 203 days. Have you received any prior offers? Is the seller open to a 19% concession, seller financing, or rate buy-down credit?
- What does the HOA fee cover, when was the last increase, and are there any pending special assessments or reserve-fund shortfalls?
- Why hasn't it sold? Are there any deal-killer items the seller is aware of (foundation, flood, title, zoning, code violations)?
- Is there a deadline driving the sale (1031 exchange, divorce, estate, relocation)? That informs how much negotiation room exists.
- Schools are F-rated, which usually means shorter tenancies and higher turnover. Who's the typical renter profile here, and what's been the actual vacancy rate?
- The area grade is low — what's the realistic commute time and amenity access for the typical tenant pool here? Any planned neighborhood developments (good or bad) we should know about?
- What's the average days-on-market for RENTAL listings here right now (not sales)? A rising rental-DOM trend means longer vacancies and softer asking-rent achievability than the comps imply.
- What's the recent tenant-quality profile in this submarket — average credit score on applications, eviction rate, late-payment / NSF rate, and stable-employment percentage? A property-management company in the area should have these aggregated.
- How much new for-sale + rental construction is in the pipeline within 1–3 miles? Heavy new supply typically softens prices + rents 12–24 months out; constrained supply supports both.
Investment metrics
- 1% rule
- 0.81% ✗
- Cap rate
- 5.64%
- Cash-on-cash
- -2.32%
- DSCR
- 0.90
- GRM
- 10.3
CMA / ARV
No comps found within radius.
Projected returns pro-forma
-3.0% appreciation · 3.0% rent growth · sell at horizon
- IRR
- -20.1%
- Equity multiple
- 0.30×
- Total profit
- $-52,036
- Equity at exit
- $39,497
- IRR
- -13.1%
- Equity multiple
- 0.23×
- Total profit
- $-56,949
- Equity at exit
- $22,904
Cash invested: $74,172 (down + closing). Projections, not guarantees.
Landlord ↔ Tenant lean methodology
- Overall (STATE)
- 85 Strongly Landlord-Friendly
- State North Carolina
- 85 Strongly Landlord-Friendly · R+3
- County
- — inherits STATE
- City
- — inherits STATE
ZIP-level market 28467
- Home prices YoY
- -33.7%
- Active inventory
- 703
- Price-to-rent
- 10.3×
Monthly cashflow live
- Estimated rent
- $2,139 high interval (Pro) →
- Mortgage (P&I)
- −$1,389
- Tax est. 1.5%
- −$331 /mo · $3,974/yr
- Insurance
- −$110
- HOA
- −$3
- Vacancy / Maint / Mgmt
- −$449
- Net cashflow
- $-144
Break-even live
Sensitivity live
| Price | -10% $39 | -5% $-52 | +0% $-144 | +5% $-235 | +10% $-327 |
|---|---|---|---|---|---|
| Rent | -10% $-313 | -5% $-228 | +0% $-144 | +5% $-59 | +10% $25 |
| Rate | -1.0pp $-10 | -0.5pp $-76 | base $-144 | +0.5pp $-212 | +1.0pp $-282 |
UW: 25.0% down · 7.5% · 30yr · 1.5% tax · 5.0% vac · 8.0% maint · 8.0% mgmt
Financing live
Cash to close
- Down payment
- $66,225
- Closing costs
- $7,947
- Reserves months
- —
- Total cash needed
- —
Loan-product check · same deal, 3 products live
Conventional
25% down · 7.5% · 30yr
- Down + closing
- —
- Monthly P&I
- —
- Monthly cashflow
- —
- DSCR
- —
- Eligible?
- —
Personal DTI + credit; lowest rate.
DSCR
20% down · 8.5% · 30yr
- Down + closing
- —
- Monthly P&I
- —
- Monthly cashflow
- —
- DSCR
- —
- Eligible?
- —
No personal income docs; deal must DSCR.
Hard money
10% down · 12.0% · 12mo
- Down + closing
- —
- Monthly P&I
- —
- Monthly cashflow
- —
- DSCR
- —
- Eligible?
- —
Short-term bridge; refi at stabilization.
Rent comps 8 comps
| Address | Beds | Baths | Sqft | Rent | $/sqft | DOM | Units | Dist |
|---|---|---|---|---|---|---|---|---|
| 1420 Sherman Dr Calabash, NC | 2.0–3.0 | 1.0–2.0 | 1011 | $770 | $0.76 | 15d | 3 | 0.43mi |
| 1063 Harbor Dr Calabash, NC | 3.0 | 2.0 | 1421 | $2,200 | $1.55 | 23d | 1 | 0.50mi |
| 834 Greenwood Ct Calabash, NC | 3.0 | 2.0 | 1475 | $2,100 | $1.42 | 15d | 1 | 0.54mi |
| 7112 Town Center Rd Sunset Beach, NC | 1.0–2.0 | 1.0–2.0 | 955 | $1,400 | $1.47 | 15d | 13 | 0.54mi |
| 1086 Mille Ave Calabash, NC | 3.0 | 2.0 | 1232 | $2,000 | $1.62 | 25d | 1 | 0.63mi |
| 1035 Brightwater Way Calabash, NC | 1.0–3.0 | 1.0–2.5 | 1327 | $2,145 | $1.62 | 25d | 1 | 0.86mi |
| 660 Aubrey Ln Calabash, NC | 1.0–2.0 | 1.0–2.0 | 1081 | $2,870 | $2.65 | 15d | 69 | 0.97mi |
| 891 Mh Marina Rd #3 Carolina Shores, NC | 2.0 | 2.0 | 1250 | $1,300 | $1.04 | 15d | 1 | 1.21mi |
HOA detail
- Monthly dues
- $3 · $36/yr
Listing history 19 events
-
2026-06-22days on market $264,900 Active 203 DOM
-
2026-06-18days on market $264,900 Active 200 DOM
-
2026-06-17days on market $264,900 Active 199 DOM
-
2026-06-16days on market $264,900 Active 198 DOM
-
2026-06-15days on market $264,900 Active 197 DOM
-
2026-06-14days on market $264,900 Active 195 DOM
-
2026-06-13days on market $264,900 Active 194 DOM
-
2026-06-10days on market $264,900 Active 192 DOM
-
2026-06-09days on market $264,900 Active 191 DOM
-
2026-06-08days on market $264,900 Active 190 DOM
-
2026-06-07days on market $264,900 Active 189 DOM
-
2026-06-05days on market $264,900 Active 186 DOM
-
2026-06-03days on market $264,900 Active 185 DOM
-
2026-06-02days on market $264,900 Active 184 DOM
-
2026-06-01days on market $264,900 Active 183 DOM
-
2026-05-31days on market $264,900 Active 182 DOM
-
2026-05-30days on market $264,900 Active 181 DOM
-
2026-04-02price $264,900
-
2025-11-30$315,000 Active
ⓘ Source: listings_history table (triggers on properties + properties_extension) + one-shot
backfill from property_details.listing_events for pre-trigger history.
Climate risk First Street
- Flood 1/10 Low FEMA zone X (unshaded) · 0% chance over 30 yrs
- Wildfire 3/10 Moderate
- Heat 9/10 Extreme 7 d/yr ≥106°F today · 18 d/yr by 30 yrs out
- Wind 8/10 Severe 99% chance of damaging wind over 30 yrs
- Air quality 2/10 Low 1 unhealthy d/yr today · 1 by 30 yrs out
Nearby sold comps map
Loading sold comps map…
Walkable amenities ~0.75 mi
Loading nearby amenities…
Taxation est. · year 1
- Rental income
- $25,672
- − Mortgage interest
- −$14,839
- − Property taxes
- −$3,974
- − Insurance
- −$1,324
- − Repairs & maintenance
- −$2,054
- − Management
- −$2,054
- − HOA
- −$36
- − Depreciation
- −$7,706
- Taxable loss
- −$6,314
- Est. tax savings @ 24.0%
- +$1,515
- After-tax cash flow
- $-208/yr
For passive investors: Depreciation is non-cash, so a rental often shows a tax loss while cash-flowing — sheltering income. Rental losses are passive: they offset passive income freely, and up to $25,000/yr can offset ordinary (W-2) income if you actively participate and your MAGI is under $100k (phasing out to $0 by $150k); unused losses carry forward. On sale, claimed depreciation is recaptured at up to 25%, and gains may owe capital-gains tax (a 1031 exchange can defer both). Figures are a year-1 estimate at your 24.0% rate — not tax advice; consult a CPA.
Schools (NCES district)
- District
- Brunswick County Schools
- NCES district ID
- 3700420
- Math proficiency
- 45% ▲ 4.00%
- Reading proficiency
- 47% ▲ 4.00%
- Median HH income
- $47,494
- Composite
- 39.23/100
- National rank
- #4011
- State rank
- #82 of 178 in NC
Livability — Calabash
- Score
- 61/100
- State rank
- #487
- US rank
- #17866
Category grades
Schools grade is shown separately in the Schools card above.
Census & demographics
- County
- Brunswick County · 131,536 people
- City population
- 13,313
- Metro
- Myrtle Beach-Conway-North Myrtle Beach, SC-NC
- Population (ZIP)
- 13,313
- Household income
- $75,341
- Rent vs Own
- Severe rent burden
- 81.0
Population outlook (Brunswick County) Hauer SSP2
- Today (2025)
- 152,111 people
- By 2030
- 165,705 · +8.9%
- By 2040
- 188,494 · +23.9%
- By 2050
- 206,228 · +35.6%
- By 2075
- 237,876 · +56.4%
- By 2100
- 251,451 · +65.3%
Race, ethnicity, and origin ACS 2023
- Neighborhood character
- Predominantly White (90%)
- Race & ethnicity
- White 90% Two or more races 4% Black 3% Hispanic / Latino 2%
- Common ancestry
- Slovak 5% Romanian 5% Lithuanian 3%
- Foreign-born
- 3% · Canada
- Languages at home
- 98% English-only · Spanish 1%
Political lean MEDSL · Brunswick
- 2024 margin
- Strong R (+24.9) · D 37.2% · R 62.0%
- 2008→2024 swing
- -6.9pp toward R · 2008: -17.9pp · 2024: -24.9pp
- All cycles
- 2024: R+24.9 2020: R+25.0 2016: R+28.7 2012: R+22.2 2008: R+17.9
Not yet ingested
- Civics
- —
Market trends
- HPI YoY
- ▼ -67.90%
- Current HPI
- 133.7186
- Rent YoY
- —
- Metro
- Myrtle Beach-Conway-North Myrtle Beach, SC-NC
- State GDP YoY
- ▲ 3.28%
- F500 in state
- 26
Industry mix (Fortune 500 HQ in NC)
| Industry | F500 HQs | Revenue |
|---|---|---|
| Financial Services | 2 | $213B |
|
||
| Retail | 2 | $95B |
|
||
| Industrial Conglomerate | 1 | $38B |
|
||
| Metals / Steel | 1 | $35B |
|
||
| Utilities | 1 | $30B |
|
||
| Industrial Machinery | 1 | $19B |
|
||
Price history
-15.9% since first listed2 events — show timeline
- 2026-04-02 Price Changed $264,900 Hive MLS
- 2025-11-30 Listed $315,000 Hive MLS
Property tax history
+20.5%/yrLatest (2025): $133 · +0.0% YoY. Source: county tax records.
Cash-flow waterfall
monthlySold comps — $/sqft
last 12 mo · ≤1 miLoading sold comps…