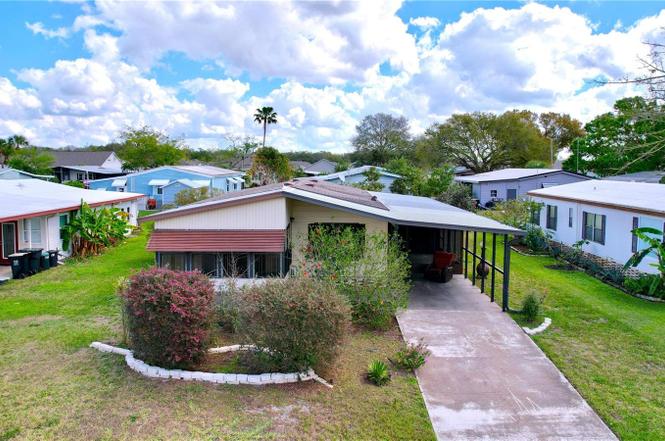
470 Village Cir SW · Eagle Lake, FL
Flood risk 3/10 · Minor
- FEMA flood zone
- X (unshaded)
- Chance of flooding over 30 yrs
- 0.2%
- Est. flood insurance / yr
- $507 – $1,088
Fire risk 4/10 · Minor
- Est. fire insurance / yr
- $947 – $1,759
Heat risk 8/10 · Major
- Hot days now (above 107°F)
- 7 days/yr
- Hot days in 30 yrs
- 24 days/yr
Wind risk 9/10 · Severe
- Chance of severe wind over 30 yrs
- 99.0%
Air-quality risk 2/10 · Minimal
- Unhealthy air days now
- 2 days/yr
- Unhealthy air days in 30 yrs
- 2 days/yr
Risk factors via First Street. Map © Google.
Why this score? — see what drove the B- grade
The composite is a weighted blend of 9 inputs, each scored 0–100. Each bar is that input's sub-score; the figure is the points it added to the 100-point composite (weight × sub-score).
- Cash flow +27.6/30.0
- DSCR +9.7/10.0
- 1% rule +8.3/10.0
- ARV discount +7.5/15.0
- Livability +3.9/5.0
- Schools +3.5/10.0
- Rent growth +3.1/5.0
- Condition / age +2.5/5.0
- Appreciation +0.0/10.0
$119,000
🖨 Deal sheet (PDF) 📄 Offer letter ✓ Due diligence
Listing remarks
Under contract-accepting backup offers. Move-In Ready! This charming home is nestled in a vibrant 55+ community, offering an array of amenities including a community pool, tennis courts, and much more. Featuring a desirable split floorplan, the home also boasts a bright bonus room that fills the space with natural light. The open layout is perfect for entertaining, and the inviting sunroom provides a serene space to relax. In addition to a covered carport, the home also includes a spacious garage, offering ample storage and convenience. Don't miss out on this perfect blend of comfort and community!
Key facts
- Community pool
- Covered carport
- Tennis courts
Tags
Property features AI
Finance
- Other: Total living area reported as 1,128 sq ft
- Financial info: Lease restrictions apply
- HOA & community: Village Park HOA with a $55 monthly fee; Community pool; Senior community; Pets allowed
Exterior
- Parking: Attached garage (1 car); Detached/carport (1 car)
- Utilities: Public water; Public sewer; Cable available; Broadband/high-speed internet available
- Home design: Manufactured double-wide home; Single-story; Faces west; Entry on one level
- Construction: Vinyl siding; Shingle roof; Crawlspace foundation; Built as a manufactured home
- Exterior features: Paved road access; Publicly maintained road; Lot dimensions about 60 x 100; Lot roughly 0.14 acre
Interior
- Kitchen: Range; Range hood; Refrigerator
- Bedrooms: 2 bedrooms
- Flooring: Carpet; Ceramic tile; Laminate
- Bathrooms: 2 full bathrooms
- Heating & cooling: Electric heat; Central air conditioning
- Interior features: Kitchen/family room combo; Open floor plan; 6 total rooms
- Laundry & utility: Inside laundry; Washer; Dryer; Irrigation equipment
Neighborhood map
What this means for you Summary
Snapshot
- This is a 2-bed/2.0-bath manufactured listed at $119k.
Deal economics
- At list price, monthly cash flow is $356 ($4k/yr) — positive.
- The deal already cash-flows at list — no discount required.
- Meets the 1% rule at list price ($2k rent vs $119k).
- Recommended offer: $105k (12.0% below list) — sets the bar for market timing.
Location & tenants
- Location reads 77/100 on livability (#196 in FL, #3,096 nationally) — a middle-class / working-renter tenant base. Strengths: crime A+, cost of living A+, housing A+; Watch: amenities F, commute F.
- Polk (suburban): math 39% / reading 43% proficiency, ranked #62 of 73 in FL (top 85%) — families likely to look elsewhere, expect single-tenant / working-renter base with shorter leases.
- Zoned schools: Eagle Lake Elementary School (math 49% / reading 40%, grade F, #1,288 of 2,144 statewide, top 62%, 697 students, 59% FRL); Westwood Middle School (math 19% / reading 26%, grade F, #546 of 571 statewide, top 96%, 878 students, 70% FRL); Lake Region High School (math 14% / reading 22%, grade F, #570 of 667 statewide, top 86%, 1,545 students, 61% FRL) — zoned schools at 64% FRL track the district average.
- Zoned-school proficiency averages 28% at this address vs 41% district-wide (-13 pts) — the specific schools serving this property underperform the Polk average; the district grade overstates school quality for this exact location.
- Market conditions: Rents rising (+2.5%/yr); 345 active listings in the ZIP; 10 comparable units currently listed for rent nearby; rentals at typical pace (median 25d on market — plan ~3-4 weeks tenant-placement turnaround); 10,384 units permitted in Polk County in 2024 (1,716 in 5+ unit buildings).
- This rent runs 34% of the median local income ($56k/yr) — at the standard rent-burdened threshold; future hikes will face affordability resistance.
Forward outlook
- Local home prices are declining (-3.0%/yr); year-one equity from $823 of loan paydown is wiped out by about $4k of value loss. Plan a longer hold.
- Polk County population projected at +33% by 2050 — long-run rental-demand tailwind backs the buy-and-hold thesis.
- At projected returns (-3.0% appreciation + 2.5% rent growth), your $33k cash investment doubles in ~10 years — after that, you're playing with house money.
Negotiation context
- It's been on market 465 days — a 12% lower offer ($105k) is reasonable based on typical stale-listing flexibility.
- Current owner paid $78k; list at $119k implies a 54% gain — meaningful room to come down on a strong offer.
Risks & watch-outs
- Climate carrying-cost: severe wind risk, 99% chance of damaging wind over 30y; extreme-heat days projected 7→24/yr by 2055 (HVAC capex compounding) — expect insurance premiums to compound above CPI over the hold.
Questions for the listing agent
- It's been on market 465 days. Have you received any prior offers? Is the seller open to a 12% concession, seller financing, or rate buy-down credit?
- What does the HOA fee cover, when was the last increase, and are there any pending special assessments or reserve-fund shortfalls?
- Why hasn't it sold? Are there any deal-killer items the seller is aware of (foundation, flood, title, zoning, code violations)?
- Is there a deadline driving the sale (1031 exchange, divorce, estate, relocation)? That informs how much negotiation room exists.
- Schools are D-rated, which usually means shorter tenancies and higher turnover. Who's the typical renter profile here, and what's been the actual vacancy rate?
- What's the average days-on-market for RENTAL listings here right now (not sales)? A rising rental-DOM trend means longer vacancies and softer asking-rent achievability than the comps imply.
- What's the recent tenant-quality profile in this submarket — average credit score on applications, eviction rate, late-payment / NSF rate, and stable-employment percentage? A property-management company in the area should have these aggregated.
- How much new for-sale + rental construction is in the pipeline within 1–3 miles? Heavy new supply typically softens prices + rents 12–24 months out; constrained supply supports both.
Investment metrics
- 1% rule
- 1.33% ✓
- Cap rate
- 9.88%
- Cash-on-cash
- 12.82%
- DSCR
- 1.57
- GRM
- 6.3
CMA / ARV
No comps found within radius.
Projected returns pro-forma
-3.0% appreciation · 2.47% rent growth · sell at horizon
- IRR
- 2.1%
- Equity multiple
- 1.08×
- Total profit
- $2,619
- Equity at exit
- $17,743
- IRR
- 11.1%
- Equity multiple
- 1.85×
- Total profit
- $28,344
- Equity at exit
- $10,289
Cash invested: $33,320 (down + closing). Projections, not guarantees.
Landlord ↔ Tenant lean methodology
- Overall (STATE)
- 87 Strongly Landlord-Friendly
- State Florida
- 87 Strongly Landlord-Friendly · R+3
- County
- — inherits STATE
- City
- — inherits STATE
ZIP-level market 33880
- Home prices YoY
- -16.2%
- Rents YoY
- 2.5%
- Active inventory
- 345
- Price-to-rent
- 6.3×
Monthly cashflow live
- Estimated rent
- $1,583 high interval (Pro) →
- Mortgage (P&I)
- −$624
- Tax from tax record
- −$166 /mo · $1,990/yr
- Insurance
- −$50
- HOA
- −$55
- Vacancy / Maint / Mgmt
- −$332
- Net cashflow
- $356
Break-even live
Sensitivity live
| Price | -10% $423 | -5% $390 | +0% $356 | +5% $322 | +10% $289 |
|---|---|---|---|---|---|
| Rent | -10% $231 | -5% $293 | +0% $356 | +5% $419 | +10% $481 |
| Rate | -1.0pp $416 | -0.5pp $386 | base $356 | +0.5pp $325 | +1.0pp $294 |
UW: 25.0% down · 7.5% · 30yr · 1.5% tax · 5.0% vac · 8.0% maint · 8.0% mgmt
Financing live
Cash to close
- Down payment
- $29,750
- Closing costs
- $3,570
- Reserves months
- —
- Total cash needed
- —
Loan-product check · same deal, 3 products live
Conventional
25% down · 7.5% · 30yr
- Down + closing
- —
- Monthly P&I
- —
- Monthly cashflow
- —
- DSCR
- —
- Eligible?
- —
Personal DTI + credit; lowest rate.
DSCR
20% down · 8.5% · 30yr
- Down + closing
- —
- Monthly P&I
- —
- Monthly cashflow
- —
- DSCR
- —
- Eligible?
- —
No personal income docs; deal must DSCR.
Hard money
10% down · 12.0% · 12mo
- Down + closing
- —
- Monthly P&I
- —
- Monthly cashflow
- —
- DSCR
- —
- Eligible?
- —
Short-term bridge; refi at stabilization.
Rent comps 10 comps
| Address | Beds | Baths | Sqft | Rent | $/sqft | DOM | Units | Dist |
|---|---|---|---|---|---|---|---|---|
| 108 Brad Cir Winter Haven, FL | 3.0 | 2.0 | 1325 | $1,720 | $1.30 | 25d | 1 | 0.25mi |
| 449 Red Hawk Loop Winter Haven, FL | 3.0 | 2.0 | 1109 | $1,581 | $1.43 | 5d | 1 | 0.56mi |
| 320 Spirit Landings Cir Winter Haven, FL | 1.0 | 1.0 | 900 | $1,295 | $1.44 | 25d | 1 | 1.09mi |
| 233 Kensington View Blvd Winter Haven, FL | 3.0 | 2.0 | 1491 | $1,975 | $1.32 | 25d | 1 | 1.16mi |
| 3062 Saint Paul Dr Jan Phyl Village, FL | 2.0 | 1.0 | 1100 | $1,323 | $1.20 | 5d | 1 | 1.43mi |
| 3060 Saint Paul Dr Jan Phyl Village, FL | 2.0 | 1.0 | 762 | $1,373 | $1.80 | 25d | 1 | 1.43mi |
| 3074 St Paul Dr Jan Phyl Village, FL | 2.0 | 1.0 | 860 | $1,149 | $1.34 | 16d | 1 | 1.44mi |
| 3039 Saint Paul Dr Jan Phyl Village, FL | 2.0 | 1.0 | 864 | $1,175 | $1.36 | 5d | 1 | 1.45mi |
| 1059 Spirit Lake Rd Winter Haven, FL | 2.0 | 1.0 | 900 | $1,378 | $1.53 | 25d | 1 | 1.46mi |
| 3320 Timberline Rd W Winter Haven, FL | 3.0 | 2.0 | 1316 | $1,735 | $1.32 | 5d | 1 | 1.49mi |
HOA detail
- Monthly dues
- $55 · $660/yr
- Likely covers
- pool
Listing history 18 events
-
2026-06-13remarks 605-char remark
-
2026-06-13statusdays on market $119,000 Pending 465 DOM
-
2026-06-10days on market $119,000 Active 464 DOM
-
2026-06-09days on market $119,000 Active 463 DOM
-
2026-06-08days on market $119,000 Active 462 DOM
-
2026-06-07days on market $119,000 Active 461 DOM
-
2026-06-05days on market $119,000 Active 458 DOM
-
2026-06-03days on market $119,000 Active 456 DOM
-
2026-06-01days on market $119,000 Active 455 DOM
-
2026-05-31days on market $119,000 Active 454 DOM
-
2026-03-27price $119,000
-
2025-11-10price $134,900
-
2025-04-29price $138,500
-
2025-03-03$140,000 Active
-
2007-08-23soldstatus $77,500
-
2003-12-30soldstatus $49,500
-
2000-10-05soldstatus $46,000
-
1998-07-10soldstatus $45,000
ⓘ Source: listings_history table (triggers on properties + properties_extension) + one-shot
backfill from property_details.listing_events for pre-trigger history.
Tax reassessment forecast FL · Resets to sale price
- Current annual tax
- $1,990 · $166/mo
- Projected year-2 tax
- $1,990 · $166/mo
- Expected delta
- $0/yr ($0/mo · 0.0%)
ⓘ Screening estimate from a state-policy table — verify with the county assessor before closing.
Climate risk First Street
- Flood 3/10 Moderate FEMA zone X (unshaded) · 20% chance over 30 yrs
- Wildfire 4/10 Moderate
- Heat 8/10 Severe 7 d/yr ≥107°F today · 24 d/yr by 30 yrs out
- Wind 9/10 Extreme 99% chance of damaging wind over 30 yrs
- Air quality 2/10 Low 2 unhealthy d/yr today · 2 by 30 yrs out
Nearby sold comps map
Loading sold comps map…
Walkable amenities ~0.75 mi
Loading nearby amenities…
Taxation est. · year 1
- Rental income
- $18,994
- − Mortgage interest
- −$6,666
- − Property taxes
- −$1,990
- − Insurance
- −$595
- − Repairs & maintenance
- −$1,520
- − Management
- −$1,520
- − HOA
- −$660
- − Depreciation
- −$3,462
- Taxable income
- $2,583
- Est. tax owed @ 24.0%
- −$620
- After-tax cash flow
- $3,652/yr
For passive investors: Depreciation is non-cash, so a rental often shows a tax loss while cash-flowing — sheltering income. Rental losses are passive: they offset passive income freely, and up to $25,000/yr can offset ordinary (W-2) income if you actively participate and your MAGI is under $100k (phasing out to $0 by $150k); unused losses carry forward. On sale, claimed depreciation is recaptured at up to 25%, and gains may owe capital-gains tax (a 1031 exchange can defer both). Figures are a year-1 estimate at your 24.0% rate — not tax advice; consult a CPA.
Schools (NCES district)
- District
- Polk
- NCES district ID
- 1201590
- Math proficiency
- 39% ▼ -11.00%
- Reading proficiency
- 43% ▼ -4.00%
- Median HH income
- $43,979
- Composite
- 34.74/100
- National rank
- #5132
- State rank
- #62 of 73 in FL
Livability — Eagle Lake
- Score
- 77/100
- State rank
- #196
- US rank
- #3096
Category grades
Schools grade is shown separately in the Schools card above.
Census & demographics
- County
- Polk County · 740,051 people
- City population
- 121,740
- Metro
- Lakeland-Winter Haven, FL
- Population (ZIP)
- 43,371
- Household income
- $56,390
- Rent vs Own
- Severe rent burden
- 1412.0
Population outlook (Polk County) Hauer SSP2
- Today (2025)
- 752,975 people
- By 2030
- 804,621 · +6.9%
- By 2040
- 906,117 · +20.3%
- By 2050
- 1,000,476 · +32.9%
- By 2075
- 1,197,520 · +59.0%
- By 2100
- 1,271,518 · +68.9%
Race, ethnicity, and origin ACS 2023
- Neighborhood character
- Diverse neighborhood (Simpson 0.65)
- Race & ethnicity
- White 49% Hispanic / Latino 27% Black 17% Two or more races 14% Asian 1%
- Hispanic origin (detail)
- Mexican 11% Puerto Rican 10% Cuban 2%
- Common ancestry
- Hispanic 2% Lithuanian 1% Italian 1%
- Foreign-born
- 9% · Canada, Jamaica
- Languages at home
- 74% English-only · Spanish 21% French/Haitian/Cajun 4%
Political lean MEDSL · Polk
- 2024 margin
- Strong R (+20.7) · D 39.2% · R 59.9%
- 2008→2024 swing
- -14.6pp toward R · 2008: -6.1pp · 2024: -20.7pp
- All cycles
- 2024: R+20.7 2020: R+14.4 2016: R+14.1 2012: R+6.8 2008: R+6.1
Not yet ingested
- Civics
- —
Market trends
- HPI YoY
- ▼ -61.41%
- Current HPI
- 317.8788
- Rent YoY
- ▲ 2.47%
- Metro
- Lakeland-Winter Haven, FL
- State GDP YoY
- ▲ 3.28%
- F500 in state
- 36
Industry mix (Fortune 500 HQ in FL)
| Industry | F500 HQs | Revenue |
|---|---|---|
| Industrial Technology | 2 | $29B |
|
||
| Insurance | 2 | $17B |
|
||
| Retail | 1 | $60B |
|
||
| Technology Distribution | 1 | $58B |
|
||
| Homebuilding | 1 | $35B |
|
||
| Technology Manufacturing | 1 | $35B |
|
||
Price history
+164.4% since first listed8 events — show timeline
- 2026-03-27 Price Changed $119,000 Stellar MLS as Distributed by MLS Grid
- 2025-11-10 Price Changed $134,900 Stellar MLS as Distributed by MLS Grid
- 2025-04-29 Price Changed $138,500 Stellar MLS as Distributed by MLS Grid
- 2025-03-03 Listed $140,000 Stellar MLS as Distributed by MLS Grid
- 2007-08-23 Sold (Public Records) $77,500 Public Records
- 2003-12-30 Sold (Public Records) $49,500 Public Records
- 2000-10-05 Sold (Public Records) $46,000 Public Records
- 1998-07-10 Sold (Public Records) $45,000 Public Records
Property tax history
+10.2%/yrLatest (2025): $1,990 · +14.5% YoY. Source: county tax records.
Cash-flow waterfall
monthlySold comps — $/sqft
last 12 mo · ≤1 miLoading sold comps…