1738 6th St · Bethlehem, PA
Flood risk 1/10 · Minimal
- FEMA flood zone
- X (unshaded)
- Chance of flooding over 30 yrs
- 0.0%
- Est. flood insurance / yr
- $473 – $860
Fire risk 1/10 · Minimal
- Est. fire insurance / yr
- $511 – $949
Heat risk 5/10 · Moderate
- Hot days now (above 100°F)
- 7 days/yr
- Hot days in 30 yrs
- 15 days/yr
Wind risk 4/10 · Minor
- Chance of severe wind over 30 yrs
- 19.0%
Air-quality risk 3/10 · Minor
- Unhealthy air days now
- 3 days/yr
- Unhealthy air days in 30 yrs
- 4 days/yr
Risk factors via First Street. Map © Google.
Why this score? — see what drove the D+ grade
The composite is a weighted blend of 9 inputs, each scored 0–100. Each bar is that input's sub-score; the figure is the points it added to the 100-point composite (weight × sub-score).
- Cash flow +14.2/30.0
- ARV discount +13.7/15.0
- DSCR +4.3/10.0
- Livability +4.1/5.0
- 1% rule +3.8/10.0
- Schools +3.5/10.0
- Rent growth +2.5/5.0
- Condition / age +2.5/5.0
- Appreciation +0.0/10.0
$299,500
🖨 Deal sheet 📄 Offer letter ✓ Due diligence
Listing remarks
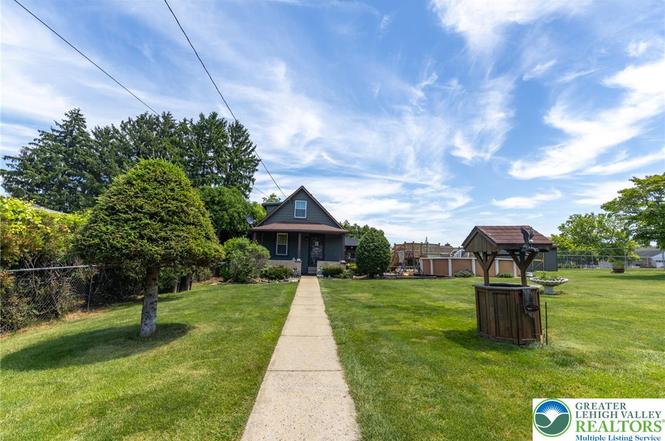
* * * MULTIPLE OFFERS RECEIVED - HIGHEST AND BEST DEADLINE WED 6/17 @ 12PM * * * Private backyard retreat in Bethlehem Township! This charming 3 Bed 2 Bath Cape Cod sits on an expansive lot built for recreation, featuring a sparkling above-ground pool with a spacious covered side deck, a serene koi pond with lily pads and rockery, a charming wishing well, covered porch, and a storage shed, all framed by mature landscaping and room to roam. A welcoming covered porch opens to a well-lit living room with cozy ventless gas fireplace, an eat-in kitchen with warm wood cabinetry, first- and second-floor bedrooms, a full bath with walk-in shower, and a powder room plus first-floor laundry and
Key facts
- Covered porch
- Serene koi pond
- Storage shed
Tags
Property features AI
Exterior
- Parking: Off-street parking; On-street parking
- Security: Smoke detector(s)
- Utilities: Public water; Public sewer; Cable available; 200+ amp electrical service with circuit breakers
- Home design: Single-story listed (interior includes multiple levels); Aluminum siding exterior; Asphalt/fiberglass roof
- Construction: Aluminum siding construction; Asphalt/Fiberglass roof
- Exterior features: Deck; Porch; Above-ground pool; Shed(s); Invisible fencing; Pond on lot
Interior
- Kitchen: Refrigerator
- Bedrooms: Two bedrooms on the second level; One bedroom on the first level; Additional finished rooms in basement (two rooms)
- Flooring: Carpet; Laminate; Resilient; Tile
- Bathrooms: One full bathroom on the second level; One half bathroom on the first level
- Heating & cooling: Baseboard heating; Ductless heating and cooling; Fireplace(s) for heating
- Interior features: Eat-in kitchen; Wired for data; Insert fireplace
- Laundry & utility: Laundry room on the first level; Electric water heater
Neighborhood map
What this means for you Summary
Snapshot
- This is a 3-bed/1.0-bath single-family listed at $300k.
Deal economics
- At list price, monthly cash flow is $49 ($585/yr) — positive.
- The deal already cash-flows at list — no discount required.
- To meet the 1% rule (rent ≥ 1% of price), the offer needs to be $263k (12.3% below list).
- Recommended offer: $263k (12.3% below list) — sets the bar for 1% rule.
- Cap rate 6.5% vs local median 4.3% in Bethlehem — top-decile yield for the area; either an underpriced asset or a hidden risk that comps aren't pricing in. Stress-test before assuming the spread holds.
Location & tenants
- Location reads 82/100 on livability (#138 in PA, #1,122 nationally) — a professional / high-income tenant draw. Strengths: amenities A+, cost of living A+, housing A+; Watch: commute F.
- Bethlehem Area SD (urban): math 31% / reading 49% proficiency, ranked #342 of 539 in PA (top 64%) — families likely to look elsewhere, expect single-tenant / working-renter base with shorter leases.
- Market conditions: 75 active listings in the ZIP; 14 comparable units currently listed for rent nearby; rentals at typical pace (median 14d on market — plan ~3-4 weeks tenant-placement turnaround); high-income renter base; 567 units permitted in Northampton County in 2024 (151 in 5+ unit buildings).
Forward outlook
- Local home prices are declining (-3.0%/yr); year-one equity from $2k of loan paydown is wiped out by about $9k of value loss. Plan a longer hold.
Negotiation context
- Only 6 days on market — expect competitive offers; lowballing is unlikely to land.
- Current owner paid $46k; list at $300k implies a 558% gain — meaningful room to come down on a strong offer.
Risks & watch-outs
- Watch-outs: built in 1926 — expect roof / HVAC / electrical / plumbing capex.
- Climate carrying-cost: extreme-heat days projected 7→15/yr by 2055 (HVAC capex compounding) — expect insurance premiums to compound above CPI over the hold.
Questions for the listing agent
- Built in 1926 — when were the roof, HVAC, electrical panel, plumbing, and water heater last replaced?
- Is there a deadline driving the sale (1031 exchange, divorce, estate, relocation)? That informs how much negotiation room exists.
- Schools are B-rated — typically a magnet for longer-tenancy family renters. What's the average tenant stay here, and is there a school-zone premium baked into asking?
- The area grade is low — what's the realistic commute time and amenity access for the typical tenant pool here? Any planned neighborhood developments (good or bad) we should know about?
- What's the average days-on-market for RENTAL listings here right now (not sales)? A rising rental-DOM trend means longer vacancies and softer asking-rent achievability than the comps imply.
- What's the recent tenant-quality profile in this submarket — average credit score on applications, eviction rate, late-payment / NSF rate, and stable-employment percentage? A property-management company in the area should have these aggregated.
- How much new for-sale + rental construction is in the pipeline within 1–3 miles? Heavy new supply typically softens prices + rents 12–24 months out; constrained supply supports both.
Investment metrics
- 1% rule
- 0.88% ✗
- Cap rate
- 6.49%
- Cash-on-cash
- 0.70%
- DSCR
- 1.03
- GRM
- 9.5
CMA / ARV
- ARV (on-the-fly)
- $347,083
- Comps found
- 12
Show comp detail 12 sales within ~0.75 mi
| Address | Dist | Beds/Ba | Sqft | Sold | Price | $/sf | Match |
|---|---|---|---|---|---|---|---|
| 1647 4th St | 0.17mi | 3/2.0 | 1,619 (+6%) | 2mo | $425,000 | $263 | 76 |
| 1639 11th St | 0.27mi | 3/1.0 | 1,425 (-7%) | 6mo | $311,000 | $218 | 72 |
| 3933 Norfolk Dr | 0.46mi | 3/2.0 | 1,572 (+3%) | 1mo | $356,000 | $226 | 69 |
| 1905 6th St | 0.19mi | 4/1.0 (+1) | 1,680 (+10%) | 7mo | $310,000 | $185 | 64 |
| 1922 9th St | 0.27mi | 3/1.0 | 1,392 (-9%) | 11mo | $349,900 | $251 | 63 |
| 3109 Fairview St | 0.46mi | 3/1.5 | 1,614 (+6%) | 5mo | $375,000 | $232 | 63 |
| 1553 1st St | 0.37mi | 4/2.0 (+1) | 1,551 (+1%) | 11mo | $365,000 | $235 | 63 |
| 1740 11th St | 0.27mi | 3/1.0 | 1,730 (+13%) | 7mo | $333,000 | $192 | 60 |
| 2145 15th St | 0.65mi | 3/1.0 | 1,612 (+5%) | 3mo | $365,500 | $227 | 58 |
| 3042 Middletown Rd | 0.63mi | 3/1.5 | 1,463 (-4%) | 4mo | $295,000 | $202 | 58 |
| 3973 Kenrick Dr | 0.74mi | 3/1.5 | 1,576 (+3%) | 6mo | $375,000 | $238 | 53 |
| 2118 6th St | 0.44mi | 4/1.0 (+1) | 1,690 (+10%) | 7mo | $355,000 | $210 | 51 |
Match score weights: distance 35% · size 25% · config 20% · recency 20%. Top-matched comps best support the ARV.
Projected returns pro-forma
-3.0% appreciation · 3.0% rent growth · sell at horizon
- IRR
- -15.2%
- Equity multiple
- 0.46×
- Total profit
- $-45,416
- Equity at exit
- $44,656
- IRR
- -6.6%
- Equity multiple
- 0.58×
- Total profit
- $-35,498
- Equity at exit
- $25,895
Cash invested: $83,860 (down + closing). Projections, not guarantees.
Landlord ↔ Tenant lean methodology
- Overall (STATE)
- 62 Landlord-Friendly
- State Pennsylvania
- 62 Landlord-Friendly · EVEN
- County
- — inherits STATE
- City
- — inherits STATE
ZIP-level market 18020
- Active inventory
- 75
- Price-to-rent
- 9.5×
Monthly cashflow live
- Estimated rent
- $2,627 high interval (Pro) →
- Mortgage (P&I)
- −$1,571
- Tax from tax record
- −$331 /mo · $3,975/yr
- Insurance
- −$125
- HOA
- −$0
- Vacancy / Maint / Mgmt
- −$552
- Net cashflow
- $49
Break-even live
UW: 25.0% down · 7.5% · 30yr · 1.5% tax · 5.0% vac · 8.0% maint · 8.0% mgmt
Financing live
Cash to close
- Down payment
- $74,875
- Closing costs
- $8,985
- Reserves months
- —
- Total cash needed
- —
Loan-product check · same deal, 3 products live
Conventional
25% down · 7.5% · 30yr
- Down + closing
- —
- Monthly P&I
- —
- Monthly cashflow
- —
- DSCR
- —
- Eligible?
- —
Personal DTI + credit; lowest rate.
DSCR
20% down · 8.5% · 30yr
- Down + closing
- —
- Monthly P&I
- —
- Monthly cashflow
- —
- DSCR
- —
- Eligible?
- —
No personal income docs; deal must DSCR.
Hard money
10% down · 12.0% · 12mo
- Down + closing
- —
- Monthly P&I
- —
- Monthly cashflow
- —
- DSCR
- —
- Eligible?
- —
Short-term bridge; refi at stabilization.
Rent comps 14 comps
| Address | Beds | Baths | Sqft | Rent | $/sqft | DOM | Units | Dist |
|---|---|---|---|---|---|---|---|---|
| 3638 Washington St Bethlehem, PA | 3.0 | 2.0 | 1881 | $2,450 | $1.30 | 23d | 1 | 0.13mi |
| 2121 7th St Bethlehem, PA | 3.0 | 2.0 | 1672 | $2,300 | $1.38 | 43d | 1 | 0.44mi |
| 1471 2nd St Bethlehem, PA | 4.0 | 1.5 | 1800 | $3,145 | $1.75 | 2d | 1 | 0.44mi |
| 2955 Middletown Rd Bethlehem, PA | 3.0 | 2.0 | 1639 | $2,100 | $1.28 | 14d | 1 | 0.73mi |
| 3547 Carter Rd Bethlehem, PA | 3.0 | 1.0 | 1800 | $2,495 | $1.39 | 43d | 1 | 0.86mi |
| 2815 Jefferson St Bethlehem, PA | 3.0 | 2.0 | 1200 | $3,000 | $2.50 | 2d | 1 | 0.87mi |
| 2897 Easton Ave Unit 303 Bethlehem, PA | 2.0 | 2.0 | 1148 | $2,100 | $1.83 | 23d | 1 | 0.94mi |
| 1416 Livingston St Bethlehem, PA | 1.0–4.0 | 1.0–2.0 | 1002 | $2,147 | $2.14 | 2d | 20 | 1.05mi |
| 440 New St Freemansburg, PA | 3.0 | 1.5 | 1744 | $2,400 | $1.38 | 2d | 1 | 1.06mi |
| 2627 Nottingham Rd Bethlehem, PA | 3.0 | 2.5 | 1756 | $2,800 | $1.59 | 2d | 1 | 1.10mi |
| 2229 Rodgers St Bethlehem, PA | 2.0 | 2.0 | 1415 | $2,300 | $1.63 | 23d | 1 | 1.17mi |
| 2234 Easton Ave Bethlehem, PA | 3.0 | 1.5 | 1254 | $2,395 | $1.91 | 2d | 1 | 1.42mi |
| 305 S Oak St Unit 305 Freemansburg, PA | 3.0 | 4.0 | 2088 | $2,750 | $1.32 | 14d | 1 | 1.43mi |
| 3157 Santee Rd Bethlehem, PA | 2.0 | 1.0 | 1100 | $1,995 | $1.81 | 43d | 1 | 1.46mi |
Listing history 7 events
-
2026-06-18status $299,500 Pending 6 DOM
-
2026-06-18days on market $299,500 Active 6 DOM
-
2026-06-17days on market $299,500 Active 5 DOM
-
2026-06-16days on market $299,500 Active 4 DOM
-
2026-06-15days on market $299,500 Active 3 DOM
-
2026-06-14remarks 699-char remark
-
2026-06-14$299,500 Active 1 DOM
ⓘ Source: listings_history table (triggers on properties + properties_extension) + one-shot
backfill from property_details.listing_events for pre-trigger history.
Tax reassessment forecast PA · Partial reset (capped growth)
- Current annual tax
- $3,975 · $331/mo
- Projected year-2 tax
- $4,354 · $363/mo
- Expected delta
- +$378/yr (+$32/mo · 9.5%)
ⓘ Screening estimate from a state-policy table — verify with the county assessor before closing.
Climate risk First Street
- Flood 1/10 Low FEMA zone X (unshaded) · 0% chance over 30 yrs
- Wildfire 1/10 Low
- Heat 5/10 Major 7 d/yr ≥100°F today · 15 d/yr by 30 yrs out
- Wind 4/10 Moderate 19% chance of damaging wind over 30 yrs
- Air quality 3/10 Moderate 3 unhealthy d/yr today · 4 by 30 yrs out
Nearby sold comps map
Loading sold comps map…
Walkable amenities ~0.75 mi
Loading nearby amenities…
Taxation est. · year 1
- Rental income
- $31,525
- − Mortgage interest
- −$16,777
- − Property taxes
- −$3,975
- − Insurance
- −$1,498
- − Repairs & maintenance
- −$2,522
- − Management
- −$2,522
- − Depreciation
- −$8,713
- Taxable loss
- −$4,481
- Est. tax savings @ 24.0%
- +$1,075
- After-tax cash flow
- $1,660/yr
For passive investors: Depreciation is non-cash, so a rental often shows a tax loss while cash-flowing — sheltering income. Rental losses are passive: they offset passive income freely, and up to $25,000/yr can offset ordinary (W-2) income if you actively participate and your MAGI is under $100k (phasing out to $0 by $150k); unused losses carry forward. On sale, claimed depreciation is recaptured at up to 25%, and gains may owe capital-gains tax (a 1031 exchange can defer both). Figures are a year-1 estimate at your 24.0% rate — not tax advice; consult a CPA.
Schools (NCES district)
- District
- Bethlehem Area SD
- NCES district ID
- 4203570
- Math proficiency
- 31% ▼ -2.00%
- Reading proficiency
- 49% ▼ -6.00%
- Median HH income
- $55,124
- Composite
- 34.92/100
- National rank
- #5068
- State rank
- #342 of 539 in PA
Livability — Bethlehem
- Score
- 82/100
- State rank
- #138
- US rank
- #1122
Category grades
Schools grade is shown separately in the Schools card above.
Census & demographics
- Census place
- Middletown, PA
- County
- Northampton County · 236,814 people
- City population
- 129,661
- Metro
- Allentown-Bethlehem-Easton, PA-NJ
- Population (ZIP)
- 21,204
- Household income
- $126,166
- Rent vs Own
- Severe rent burden
- 249.0
Population outlook (Northampton County) Hauer SSP2
- Today (2025)
- 312,227 people
- By 2030
- 314,769 · +0.8%
- By 2040
- 316,914 · +1.5%
- By 2050
- 318,037 · +1.9%
- By 2075
- 334,003 · +7.0%
- By 2100
- 344,696 · +10.4%
Race, ethnicity, and origin ACS 2023
- Neighborhood character
- Predominantly White (70%)
- Race & ethnicity
- White 70% Hispanic / Latino 15% Two or more races 10% Black 5% Asian 5%
- Hispanic origin (detail)
- Mexican 1% Puerto Rican 7% Dominican 2%
- Common ancestry
- Romanian 8% Russian 2% Slovak 1%
- Foreign-born
- 10% · Canada, China, Jamaica
- Languages at home
- 86% English-only · Spanish 6% Other Indo-European 4% Russian/Polish/Slavic 1%
Political lean MEDSL · Northampton
- 2024 margin
- Toss-up / Even · D 48.6% · R 50.4%
- 2008→2024 swing
- -14.1pp toward R · 2008: 12.3pp · 2024: -1.8pp
- All cycles
- 2024: R+1.8 2020: D+0.7 2016: R+3.8 2012: D+4.6 2008: D+12.3
Not yet ingested
- Civics
- —
Market trends
- HPI YoY
- ▼ -240.51%
- Current HPI
- 206.2873
- Rent YoY
- —
- Metro
- Allentown-Bethlehem-Easton, PA-NJ
- State GDP YoY
- ▲ 1.68%
- F500 in state
- 34
Industry mix (Fortune 500 HQ in PA)
| Industry | F500 HQs | Revenue |
|---|---|---|
| Healthcare | 2 | $309B |
|
||
| Insurance | 2 | $27B |
|
||
| Telecommunications / Media | 1 | $124B |
|
||
| Industrial Distribution | 1 | $22B |
|
||
| Financial Services | 1 | $20B |
|
||
| Chemicals / Materials | 1 | $18B |
|
||
Price history
+558.2% since first listed2 events — show timeline
- 2026-06-13 Listed $299,500 GLVRMLS
- 1979-11-01 Sold (Public Records) $45,500 Public Records
Property tax history
+1.6%/yrLatest (2026): $3,975 · +4.2% YoY. Source: county tax records.
Cash-flow waterfall
monthlySold comps — $/sqft
last 12 mo · ≤1 miLoading sold comps…