1215 Edington Pl Unit N2 · Marco Island, FL
Flood risk 10/10 · Severe
- FEMA flood zone
- AE
- Chance of flooding over 30 yrs
- 0.99%
- Est. flood insurance / yr
- $1,737 – $8,500
Fire risk 3/10 · Minor
- Est. fire insurance / yr
- $947 – $1,759
Heat risk 10/10 · Severe
- Hot days now (above 108°F)
- 7 days/yr
- Hot days in 30 yrs
- 30 days/yr
Wind risk 10/10 · Severe
- Chance of severe wind over 30 yrs
- 99.0%
Air-quality risk 3/10 · Minor
- Unhealthy air days now
- 3 days/yr
- Unhealthy air days in 30 yrs
- 3 days/yr
Risk factors via First Street. Map © Google.
Why this score? — see what drove the C grade
The composite is a weighted blend of 9 inputs, each scored 0–100. Each bar is that input's sub-score; the figure is the points it added to the 100-point composite (weight × sub-score).
- Cash flow +20.7/30.0
- 1% rule +8.5/10.0
- ARV discount +7.5/15.0
- DSCR +6.6/10.0
- Schools +5.0/10.0
- Rent growth +4.1/5.0
- Livability +3.6/5.0
- Condition / age +2.5/5.0
- Appreciation +0.0/10.0
$295,000
🖨 Deal sheet 📄 Offer letter ✓ Due diligence
Listing remarks
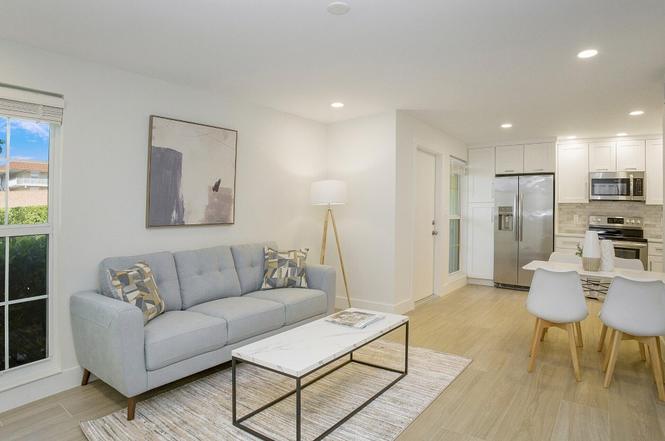
This one 1BR, 1BA first floor condo has been beautifully renovated. As you enter the condo, you will see an open concept layout with great upgraded finishes. New tile throughout the unit. The kitchen is equipped with white shaker wood cabinets, stainless steel appliances, quartz countertops and marble backsplash. The bedroom offers great natural light and two closets. The bath has beautiful 24x48 tile on the walls with hexagon shaped tile on shower floor and quartz countertop. This unit offers a private laundry with new stacked washer and dryer. Windows and sliding doors are impact resistant. Ville de Marco is located on Marco River in Old Marco area in walking distance to restaurants and s
Key facts
- Marble backsplash
- Quartz countertops
- Natural light
Tags
Property features AI
Finance
- HOA & community: Community amenities: bike storage, boat launch, car wash area, fishing pier, pool
Exterior
- Parking: Open parking (no attached garage)
- Security: Gated community
- Home design: Waterfront property with seawall; Access to common dock, common ramp, and gulf access
- Exterior features: Impact doors and impact sliding windows; Patio; Gated community
Interior
- Kitchen: Includes oven, dishwasher, microwave, refrigerator with ice maker
- Bedrooms: 1 bedroom
- Flooring: Tile
- Bathrooms: 1 full bathroom
- Heating & cooling: Central heating; Central air conditioning
- Interior features: Oven, Dishwasher, Dryer, Microwave, Refrigerator with ice maker, Washer; Tile flooring
- Laundry & utility: Washer and dryer included
Neighborhood map
What this means for you Summary
Snapshot
- This is a 1-bed/1.0-bath condo listed at $295k.
Deal economics
- At list price, monthly cash flow is $-28 ($-331/yr) — negative.
- The deal already cash-flows at list — no discount required.
- Meets the 1% rule at list price ($4k rent vs $295k).
- Recommended offer: $260k (12.0% below list) — sets the bar for market timing.
Location & tenants
- Location reads 71/100 on livability (#404 in FL) — a middle-class / working-renter tenant base. Strengths: crime A+, employment A+, health & safety A+; Watch: amenities F, commute F, cost of living F.
- Collier (suburban): math 60% / reading 56% proficiency, ranked #16 of 73 in FL (top 22%) — acceptable for families but not a draw, mixed tenant base, ~2y average lease.
- Market conditions: Rents rising fast (+6.6%/yr); 687 active listings in the ZIP; 2 comparable units currently listed for rent nearby; solid renter incomes; 3,520 units permitted in Collier County in 2024 (959 in 5+ unit buildings).
- At $3,993/mo this rent would consume 47% of the median local household income ($102k/yr) (locally 314% of renters already pay >50% of income on rent) — very limited rent-growth headroom before tenants either downsize or default.
Forward outlook
- Local home prices are declining (-3.0%/yr); year-one equity from $2k of loan paydown is wiped out by about $9k of value loss. Plan a longer hold.
- Collier County population projected at +30% by 2050 — long-run rental-demand tailwind backs the buy-and-hold thesis.
Negotiation context
- It's been on market 161 days — a 12% lower offer ($260k) is reasonable based on typical stale-listing flexibility.
- 6 sale attempts since 3y ago; this cycle's ask has dropped $34k (10%) from the opening price — seller is motivated, your offer sets the floor, not the list.
Risks & watch-outs
- Watch-outs: flood insurance adds $427/mo; HOA is 23% of rent.
- Climate carrying-cost: in FEMA flood zone AE (mandatory federal flood insurance); severe wind risk, 99% chance of damaging wind over 30y; extreme-heat days projected 7→30/yr by 2055 (HVAC capex compounding) — expect insurance premiums to compound above CPI over the hold.
Questions for the listing agent
- What do current leases actually rent for vs. the listed asking? Can we see a recent rent roll and the last 12 months of T-12 income?
- It's been on market 161 days. Have you received any prior offers? Is the seller open to a 12% concession, seller financing, or rate buy-down credit?
- Built in 1970 — when were the roof, HVAC, electrical panel, plumbing, and water heater last replaced?
- What's the actual annual flood-insurance premium (NFIP or private), and is the property in a SFHA with mandatory coverage?
- What does the HOA fee cover, when was the last increase, and are there any pending special assessments or reserve-fund shortfalls?
- Any open or pending special assessments — roof, HVAC, plumbing, elevator, façade? What's the per-unit balance and payoff schedule, and is the seller paying it off at close or rolling it to the buyer?
- Why hasn't it sold? Are there any deal-killer items the seller is aware of (foundation, flood, title, zoning, code violations)?
- Is there a deadline driving the sale (1031 exchange, divorce, estate, relocation)? That informs how much negotiation room exists.
- Schools are A-rated — typically a magnet for longer-tenancy family renters. What's the average tenant stay here, and is there a school-zone premium baked into asking?
- What's the average days-on-market for RENTAL listings here right now (not sales)? A rising rental-DOM trend means longer vacancies and softer asking-rent achievability than the comps imply.
- What's the recent tenant-quality profile in this submarket — average credit score on applications, eviction rate, late-payment / NSF rate, and stable-employment percentage? A property-management company in the area should have these aggregated.
- How much new apartment / multifamily construction is in the pipeline within 1–3 miles? Heavy new supply (>2% of stock underway) typically softens rents 12–24 months out; light construction supports rent growth.
Investment metrics
- 1% rule
- 1.35% ✓
- Cap rate
- 7.92%
- Cash-on-cash
- 5.80%
- DSCR
- 1.26
- GRM
- 6.2
CMA / ARV
No comps found within radius.
Projected returns pro-forma
-3.0% appreciation · 6.59% rent growth · sell at horizon
- IRR
- -10.7%
- Equity multiple
- 0.59×
- Total profit
- $-33,854
- Equity at exit
- $43,985
- IRR
- 5.0%
- Equity multiple
- 1.45×
- Total profit
- $37,378
- Equity at exit
- $25,506
Cash invested: $82,600 (down + closing). Projections, not guarantees.
Landlord ↔ Tenant lean methodology
- Overall (STATE)
- 87 Strongly Landlord-Friendly
- State Florida
- 87 Strongly Landlord-Friendly · R+3
- County
- — inherits STATE
- City
- — inherits STATE
ZIP-level market 34145
- Rents YoY
- 6.6%
- Active inventory
- 687
- Price-to-rent
- 6.2×
Monthly cashflow live
- Estimated rent
- $3,993 medium interval (Pro) →
- Mortgage (P&I)
- −$1,547
- Tax from tax record
- −$168 /mo · $2,010/yr
- Insurance
- −$123
- Flood insurance flood zone
- −$427 /mo · $5,118/yr
- HOA est. from 4 same-building comps
- −$918
- Vacancy / Maint / Mgmt
- −$839
- Net cashflow
- $-28
Break-even live
UW: 25.0% down · 7.5% · 30yr · 1.5% tax · 5.0% vac · 8.0% maint · 8.0% mgmt
Financing live
Cash to close
- Down payment
- $73,750
- Closing costs
- $8,850
- Reserves months
- —
- Total cash needed
- —
Loan-product check · same deal, 3 products live
Conventional
25% down · 7.5% · 30yr
- Down + closing
- —
- Monthly P&I
- —
- Monthly cashflow
- —
- DSCR
- —
- Eligible?
- —
Personal DTI + credit; lowest rate.
DSCR
20% down · 8.5% · 30yr
- Down + closing
- —
- Monthly P&I
- —
- Monthly cashflow
- —
- DSCR
- —
- Eligible?
- —
No personal income docs; deal must DSCR.
Hard money
10% down · 12.0% · 12mo
- Down + closing
- —
- Monthly P&I
- —
- Monthly cashflow
- —
- DSCR
- —
- Eligible?
- —
Short-term bridge; refi at stabilization.
Rent comps 2 comps
| Address | Beds | Baths | Sqft | Rent | $/sqft | DOM | Units | Dist |
|---|---|---|---|---|---|---|---|---|
| 1215 Edington Pl Unit A6 Marco Island, FL | 1.0 | 1.0 | 570 | $4,500 | $7.89 | 21d | 1 | 0.03mi |
| 850 Palm St Unit C5 Marco Island, FL | 1.0 | 1.0 | 494 | $2,400 | $4.86 | 23d | 1 | 0.05mi |
HOA detail condo
- Monthly dues
- $0 · $0/yr
- Assessments
- None detected in remarks — confirm with the listing agent.
Listing history 31 events
-
2026-06-18days on market $295,000 Active 161 DOM
-
2026-06-17days on market $295,000 Active 160 DOM
-
2026-06-16days on market $295,000 Active 159 DOM
-
2026-06-15days on market $295,000 Active 158 DOM
-
2026-06-14days on market $295,000 Active 156 DOM
-
2026-06-10days on market $295,000 Active 153 DOM
-
2026-06-09days on market $295,000 Active 152 DOM
-
2026-06-08days on market $295,000 Active 151 DOM
-
2026-06-07days on market $295,000 Active 150 DOM
-
2026-06-03days on market $295,000 Active 146 DOM
-
2026-06-02days on market $295,000 Active 145 DOM
-
2026-06-01days on market $295,000 Active 144 DOM
-
2026-05-31days on market $295,000 Active 143 DOM
-
2026-05-30days on market $295,000 Active 142 DOM
-
2026-02-04price $295,000
-
2026-01-08$329,000 Active
-
2025-02-14$349,000 Active
-
2024-10-17historical
-
2024-07-16price $359,000
-
2024-07-16price $359,000
-
2024-06-03$379,000 Active
-
2024-06-03$379,000 Active
-
2024-05-02historical
-
2024-03-18price $389,000
-
2024-03-18price $389,000
-
2024-02-11price $419,000
-
2024-02-11price $419,000
-
2023-05-04$459,000 Active
-
2023-05-02$459,000 Active
-
2023-03-03soldstatus $285,000
-
2004-05-24soldstatus $153,000
ⓘ Source: listings_history table (triggers on properties + properties_extension) + one-shot
backfill from property_details.listing_events for pre-trigger history.
Tax reassessment forecast FL · Resets to sale price
- Current annual tax
- $2,010 · $168/mo
- Projected year-2 tax
- $2,448 · $204/mo
- Expected delta
- +$438/yr (+$37/mo · 21.8%)
ⓘ Screening estimate from a state-policy table — verify with the county assessor before closing.
Climate risk First Street
- Flood 10/10 Extreme FEMA zone AE · 99% chance over 30 yrs
- Wildfire 3/10 Moderate
- Heat 10/10 Extreme 7 d/yr ≥108°F today · 30 d/yr by 30 yrs out
- Wind 10/10 Extreme 99% chance of damaging wind over 30 yrs
- Air quality 3/10 Moderate 3 unhealthy d/yr today · 3 by 30 yrs out
Nearby sold comps map
Loading sold comps map…
Walkable amenities ~0.75 mi
Loading nearby amenities…
Taxation est. · year 1
- Rental income
- $47,915
- − Mortgage interest
- −$16,525
- − Property taxes
- −$2,010
- − Insurance
- −$6,594
- − Repairs & maintenance
- −$3,833
- − Management
- −$3,833
- − HOA
- −$11,016
- − Depreciation
- −$8,582
- Taxable loss
- −$4,477
- Est. tax savings @ 24.0%
- +$1,075
- After-tax cash flow
- $744/yr
For passive investors: Depreciation is non-cash, so a rental often shows a tax loss while cash-flowing — sheltering income. Rental losses are passive: they offset passive income freely, and up to $25,000/yr can offset ordinary (W-2) income if you actively participate and your MAGI is under $100k (phasing out to $0 by $150k); unused losses carry forward. On sale, claimed depreciation is recaptured at up to 25%, and gains may owe capital-gains tax (a 1031 exchange can defer both). Figures are a year-1 estimate at your 24.0% rate — not tax advice; consult a CPA.
Schools (NCES district)
- District
- Collier
- NCES district ID
- 1200330
- Math proficiency
- 60% ▼ -4.00%
- Reading proficiency
- 56% ▼ -2.00%
- Median HH income
- $58,275
- Composite
- 50.23/100
- National rank
- #1892
- State rank
- #16 of 73 in FL
Livability — Marco Island
- Score
- 71/100
- State rank
- #404
- US rank
- #7149
Category grades
Schools grade is shown separately in the Schools card above.
Census & demographics
- Census place
- Marco Island, FL
- County
- Collier County · 396,295 people
- City population
- 16,205
- Metro
- Naples-Marco Island, FL
- Population (ZIP)
- 16,205
- Household income
- $101,523
- Rent vs Own
- Severe rent burden
- 314.0
Population outlook (Collier County) Hauer SSP2
- Today (2025)
- 420,858 people
- By 2030
- 450,054 · +6.9%
- By 2040
- 502,232 · +19.3%
- By 2050
- 544,932 · +29.5%
- By 2075
- 627,203 · +49.0%
- By 2100
- 659,015 · +56.6%
Race, ethnicity, and origin ACS 2023
- Neighborhood character
- Predominantly White (90%)
- Race & ethnicity
- White 90% Hispanic / Latino 7% Two or more races 6%
- Hispanic origin (detail)
- Mexican 1% Puerto Rican 1% Cuban 2%
- Common ancestry
- Romanian 5% Lithuanian 2% Slovak 2%
- Foreign-born
- 9% · Canada
- Languages at home
- 90% English-only · Spanish 5% Other Indo-European 1% German/W. Germanic 1%
Political lean MEDSL · Collier
- 2024 margin
- Solid R (+33.1) · D 33.1% · R 66.2%
- 2008→2024 swing
- -10.6pp toward R · 2008: -22.5pp · 2024: -33.1pp
- All cycles
- 2024: R+33.1 2020: R+24.7 2016: R+26.0 2012: R+30.1 2008: R+22.5
Not yet ingested
- Civics
- —
Market trends
- HPI YoY
- ▼ -374.55%
- Current HPI
- 284.7538
- Rent YoY
- ▲ 6.59%
- Metro
- Naples-Marco Island, FL
- State GDP YoY
- ▲ 3.28%
- F500 in state
- 36
Industry mix (Fortune 500 HQ in FL)
| Industry | F500 HQs | Revenue |
|---|---|---|
| Industrial Technology | 2 | $29B |
|
||
| Insurance | 2 | $17B |
|
||
| Retail | 1 | $60B |
|
||
| Technology Distribution | 1 | $58B |
|
||
| Homebuilding | 1 | $35B |
|
||
| Technology Manufacturing | 1 | $35B |
|
||
Price history
+92.8% since first listed17 events — show timeline
- 2026-02-04 Price Changed $295,000 MIML
- 2026-01-08 Listed $329,000 MIML
- 2025-02-14 Listed $349,000 MIML
- 2024-10-17 Listing Removed — NAPLESMLS
- 2024-07-16 Price Changed $359,000 NAPLESMLS
- 2024-07-16 Price Changed $359,000 MIML
- 2024-06-03 Listed $379,000 NAPLESMLS
- 2024-06-03 Listed $379,000 MIML
- 2024-05-02 Listing Removed — NAPLESMLS
- 2024-03-18 Price Changed $389,000 NAPLESMLS
- 2024-03-18 Price Changed $389,000 MIML
- 2024-02-11 Price Changed $419,000 NAPLESMLS
- 2024-02-11 Price Changed $419,000 MIML
- 2023-05-04 Listed $459,000 NAPLESMLS
- 2023-05-02 Listed $459,000 MIML
- 2023-03-03 Sold (Public Records) $285,000 Public Records
- 2004-05-24 Sold (Public Records) $153,000 Public Records
Property tax history
+9.0%/yrLatest (2025): $2,010 · -16.0% YoY. Source: county tax records.
Cash-flow waterfall
monthlySold comps — $/sqft
last 12 mo · ≤1 miLoading sold comps…