 Multi-family
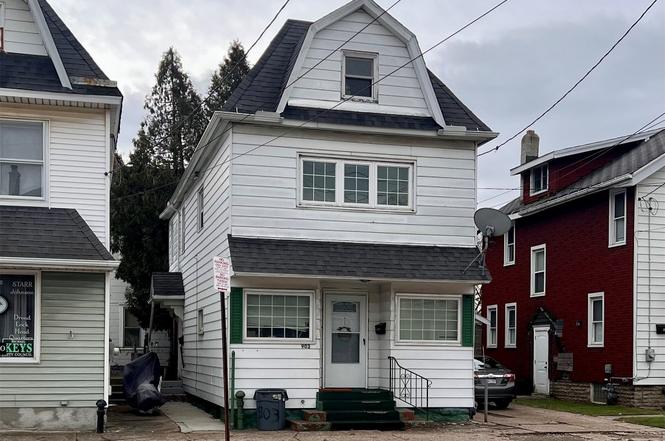
903 W 26th St · Erie, PA
Flood risk 1/10 · Minimal
- FEMA flood zone
- X (unshaded)
- Chance of flooding over 30 yrs
- 0.0%
- Est. flood insurance / yr
- $473 – $860
Fire risk 1/10 · Minimal
- Est. fire insurance / yr
- $511 – $949
Heat risk 3/10 · Minor
- Hot days now (above 89°F)
- 7 days/yr
- Hot days in 30 yrs
- 17 days/yr
Wind risk 1/10 · Minimal
- Chance of severe wind over 30 yrs
- —
Air-quality risk 2/10 · Minimal
- Unhealthy air days now
- 1 days/yr
- Unhealthy air days in 30 yrs
- 3 days/yr
Risk factors via First Street. Map © Google.
Why this score? — see what drove the C+ grade
The composite is a weighted blend of 9 inputs, each scored 0–100. Each bar is that input's sub-score; the figure is the points it added to the 100-point composite (weight × sub-score).
- Cash flow +30.0/30.0
- 1% rule +10.0/10.0
- DSCR +10.0/10.0
- Livability +4.2/5.0
- Rent growth +2.5/5.0
- Condition / age +2.5/5.0
- Schools +1.3/10.0
- ARV discount +0.5/15.0
- Appreciation +0.0/10.0
$117,500
🖨 Deal sheet 📄 Offer letter ✓ Due diligence
Multi-family units
County records classify this as Multi-Family (2-4 Unit). Listing-text estimate: 1 unit. estimate disagrees with records
Listing remarks
MAJORLY RENOVATED IN 2019, THIS TWO-UNIT INCOME PRODUCING PROPERTY IS CONVENIENTLY LOCATED NEAR AHN/ST VINCENT HOSPITAL. IMPROVEMENTS MADE INCLUDED TWO NEW FURNACES, TWO HOT WATER TANKS, ALL WINDOWS & EXTERIOR DOORS, CABINETRY, APPLIANCES, FLOORING AND MORE. COMMON EXTERIOR ENTRANCE TO SHARED BASEMENT WITH LAUNDRY HOOK-UPS. PHOTOS OF FIRST FLOOR TAKEN BY OWNER PRIOR TO OCCUPANCY.
Key facts
- Renovated in 2019
- New hot water tanks
- Cabinetry
Tags
Property features AI
Finance
- Other: Listed as residential income (duplex)
- Financial info: Two income units currently rented: one at $575 and one at $600
- HOA & community: No HOA information provided
Exterior
- Parking: No specific parking details provided
- Security: No security features provided
- Utilities: Public water; Public sewer
- Home design: Duplex residential income property; 22 x 66 lot dimensions; R-1 zoning
- Construction: Aluminum siding and frame construction; Asphalt roof; Built as a duplex (year built not provided)
- Exterior features: Level lot; Paved road access
Interior
- Kitchen: Each unit includes a range/oven and refrigerator
- Bedrooms: Two 1-bedroom units (each unit contains 1 bedroom)
- Flooring: No flooring details provided
- Bathrooms: Two 1-bath units (each unit contains 1 bathroom)
- Heating & cooling: Forced air heating; No central cooling
- Interior features: Basement tenant use (lower-level rental spaces)
- Laundry & utility: No specific laundry details provided
Neighborhood map
What this means for you Summary
Snapshot
- This is a 4-bed/2.0-bath multifamily listed at $118k.
Deal economics
- At list price, monthly cash flow is $593 ($7k/yr) — positive.
- The deal already cash-flows at list — no discount required.
- Meets the 1% rule at list price ($2k rent vs $118k).
- Recommended offer: $107k (9.0% below list) — sets the bar for market timing.
- Cap rate 12.4% vs local median 5.2% in Erie — top-decile yield for the area; either an underpriced asset or a hidden risk that comps aren't pricing in. Stress-test before assuming the spread holds.
Location & tenants
- Location reads 83/100 on livability (#109 in PA, #840 nationally) — a professional / high-income tenant draw. Strengths: amenities A+, commute A+, cost of living A+; Watch: crime D+, employment F.
- Erie City SD (urban): math 12% / reading 19% proficiency, ranked #510 of 539 in PA (top 95%) — low school quality limits family demand, transient renter base, plan for 1-2y turnover; 81% free/reduced lunch — lower-income household profile, screen leases tightly.
- Market conditions: 76 active listings in the ZIP; 9 comparable units currently listed for rent nearby; rentals lingering (median 44d on market — plan ~5-8 weeks vacancy on turnover, expect pricing pressure); 100% of comp listings sitting > 30 days — soft ceiling on asking rent; 364 units permitted in Erie County in 2024 (188 in 5+ unit buildings).
- This rent runs 40% of the median local income ($56k/yr) — at the standard rent-burdened threshold; future hikes will face affordability resistance.
Forward outlook
- Local home prices are declining (-3.0%/yr); year-one equity from $812 of loan paydown is wiped out by about $4k of value loss. Plan a longer hold.
- Erie County population projected at -14% by 2050 — secular population decline; favor cash flow + early exit over multi-decade hold.
- At projected returns (-3.0% appreciation + 3.0% rent growth), your $33k cash investment doubles in ~6 years — after that, you're playing with house money.
Negotiation context
- It's been on market 100 days — a 9% lower offer ($107k) is reasonable based on typical stale-listing flexibility.
- 4 sale attempts since 9y ago with the ask held roughly flat each time — persistent listings suggest the price (not the market) is what's stuck; bring a comps-based counter.
- Current owner paid $32k; list at $118k implies a 267% gain — meaningful room to come down on a strong offer.
Risks & watch-outs
- Watch-outs: built in 1917 — expect roof / HVAC / electrical / plumbing capex.
Questions for the listing agent
- It's been on market 100 days. Have you received any prior offers? Is the seller open to a 9% concession, seller financing, or rate buy-down credit?
- Built in 1917 — when were the roof, HVAC, electrical panel, plumbing, and water heater last replaced?
- Why hasn't it sold? Are there any deal-killer items the seller is aware of (foundation, flood, title, zoning, code violations)?
- Is there a deadline driving the sale (1031 exchange, divorce, estate, relocation)? That informs how much negotiation room exists.
- Crime grade is D in this area — have there been break-ins, vandalism, or insurance claims at this property in the last 3 years? What carrier currently insures it and at what premium?
- What's the average days-on-market for RENTAL listings here right now (not sales)? A rising rental-DOM trend means longer vacancies and softer asking-rent achievability than the comps imply.
- What's the recent tenant-quality profile in this submarket — average credit score on applications, eviction rate, late-payment / NSF rate, and stable-employment percentage? A property-management company in the area should have these aggregated.
- How much new apartment / multifamily construction is in the pipeline within 1–3 miles? Heavy new supply (>2% of stock underway) typically softens rents 12–24 months out; light construction supports rent growth.
Investment metrics
- 1% rule
- 1.60% ✓
- Cap rate
- 12.35%
- Cash-on-cash
- 21.64%
- DSCR
- 1.96
- GRM
- 5.2
CMA / ARV
- ARV (on-the-fly)
- $101,640
- Comps found
- 8
Show comp detail 8 sales within ~0.75 mi
| Address | Dist | Beds/Ba | Sqft | Sold | Price | $/sf | Match |
|---|---|---|---|---|---|---|---|
| 2412 2414 Poplar St | 0.20mi | 4/2.0 | 1,536 (-0%) | 11mo | $131,000 | $85 | 81 |
| 667 W 32nd St | 0.41mi | 3/2.0 (-1) | 1,638 (+6%) | 0mo | $139,000 | $85 | 65 |
| 1923 Liberty St | 0.42mi | 3/2.0 (-1) | 1,356 (-12%) | 3mo | $90,000 | $66 | 53 |
| 1922 Cherry St | 0.50mi | 4/3.0 | 1,600 (+4%) | 16mo | $68,500 | $43 | 53 |
| 431 W 18th St | 0.71mi | 4/2.0 | 1,485 (-4%) | 13mo | $58,000 | $39 | 50 |
| 355 W 24th St | 0.61mi | 4/2.0 | 1,672 (+9%) | 11mo | $81,000 | $48 | 48 |
| 1905 Liberty St | 0.45mi | 4/2.0 | 1,696 (+10%) | 22mo | $35,000 | $21 | 44 |
| 1156 W 21st St | 0.51mi | 5/3.0 (+1) | 1,693 (+10%) | 19mo | $129,900 | $77 | 35 |
Match score weights: distance 35% · size 25% · config 20% · recency 20%. Top-matched comps best support the ARV.
Projected returns pro-forma
-3.0% appreciation · 3.0% rent growth · sell at horizon
- IRR
- 14.3%
- Equity multiple
- 1.57×
- Total profit
- $18,828
- Equity at exit
- $17,520
- IRR
- 23.1%
- Equity multiple
- 2.99×
- Total profit
- $65,368
- Equity at exit
- $10,159
Cash invested: $32,900 (down + closing). Projections, not guarantees.
Landlord ↔ Tenant lean methodology
- Overall (STATE)
- 62 Landlord-Friendly
- State Pennsylvania
- 62 Landlord-Friendly · EVEN
- County
- — inherits STATE
- City
- — inherits STATE
ZIP-level market 16508
- Home prices YoY
- -22.8%
- Active inventory
- 76
- Price-to-rent
- 10.4×
Monthly cashflow live
- Estimated rent
- $1,878 high interval (Pro) →
- Mortgage (P&I)
- −$616
- Tax from tax record
- −$225 /mo · $2,701/yr
- Insurance
- −$49
- HOA
- −$0
- Vacancy / Maint / Mgmt
- −$394
- Net cashflow
- $593
Break-even live
2-unit breakdown (identical units grouped — click to expand)
| Units | Beds | Baths | Est. rent |
|---|---|---|---|
| 2× units | 2 | 1 | $1,878 |
| #1 | 2 | 1 | $939 |
| #2 | 2 | 1 | $939 |
| Total (2 units) | $1,878 | ||
UW: 25.0% down · 7.5% · 30yr · 1.5% tax · 5.0% vac · 8.0% maint · 8.0% mgmt
Financing live
Cash to close
- Down payment
- $29,375
- Closing costs
- $3,525
- Reserves months
- —
- Total cash needed
- —
Loan-product check · same deal, 3 products live
Conventional
25% down · 7.5% · 30yr
- Down + closing
- —
- Monthly P&I
- —
- Monthly cashflow
- —
- DSCR
- —
- Eligible?
- —
Personal DTI + credit; lowest rate.
DSCR
20% down · 8.5% · 30yr
- Down + closing
- —
- Monthly P&I
- —
- Monthly cashflow
- —
- DSCR
- —
- Eligible?
- —
No personal income docs; deal must DSCR.
Hard money
10% down · 12.0% · 12mo
- Down + closing
- —
- Monthly P&I
- —
- Monthly cashflow
- —
- DSCR
- —
- Eligible?
- —
Short-term bridge; refi at stabilization.
Rent comps 9 comps
| Address | Beds | Baths | Sqft | Rent | $/sqft | DOM | Units | Dist |
|---|---|---|---|---|---|---|---|---|
| 2702 Raspberry St Unit 1 Erie, PA | 3.0 | 1.0 | 2000 | $1,200 | $0.60 | 44d | 1 | 0.28mi |
| 504 W 29th St Unit 2 Erie, PA | 3.0 | 1.0 | 1200 | $1,500 | $1.25 | 44d | 1 | 0.45mi |
| 1610 Poplar St Unit Downstairs Erie, PA | 3.0 | 1.0 | 1200 | $875 | $0.73 | 44d | 1 | 0.63mi |
| 115 W 32nd St Erie, PA | 3.0 | 2.0 | 1844 | $1,050 | $0.57 | 44d | 1 | 1.03mi |
| 729 W 9th St Erie, PA | 4.0 | 2.0 | 1782 | $3,000 | $1.68 | 44d | 1 | 1.13mi |
| 126 W 38th St Erie, PA | 4.0 | 2.0 | 1850 | $4,000 | $2.16 | 44d | 1 | 1.19mi |
| 923 Chestnut St Unit 2 Erie, PA | 4.0 | 2.0 | 1100 | $1,150 | $1.05 | 44d | 1 | 1.23mi |
| 538 W 8th St Unit 1 Erie, PA | 3.0 | 1.0 | 2000 | $1,650 | $0.82 | 44d | 1 | 1.27mi |
| 1164 W 7th St Erie, PA | 3.0 | 1.0 | 1248 | $1,600 | $1.28 | 44d | 1 | 1.35mi |
Listing history 11 events
-
2026-05-01status Pending
-
2026-03-20price $117,500
-
2026-01-21$122,500 Active
-
2019-05-09soldstatus $32,000
-
2018-11-01$36,900
-
2017-11-01$39,900
-
2017-06-05$47,900
-
2004-01-28soldstatus $59,000
-
2003-10-02soldstatus $47,000
-
1994-05-12soldstatus $44,500
-
1981-04-30soldstatus $30,500
ⓘ Source: listings_history table (triggers on properties + properties_extension) + one-shot
backfill from property_details.listing_events for pre-trigger history.
Tax reassessment forecast PA · Partial reset (capped growth)
- Current annual tax
- $2,701 · $225/mo
- Projected year-2 tax
- $2,701 · $225/mo
- Expected delta
- $0/yr ($0/mo · 0.0%)
ⓘ Screening estimate from a state-policy table — verify with the county assessor before closing.
Climate risk First Street
- Flood 1/10 Low FEMA zone X (unshaded) · 0% chance over 30 yrs
- Wildfire 1/10 Low
- Heat 3/10 Moderate 7 d/yr ≥89°F today · 17 d/yr by 30 yrs out
- Wind 1/10 Low
- Air quality 2/10 Low 1 unhealthy d/yr today · 3 by 30 yrs out
Nearby sold comps map
Loading sold comps map…
Walkable amenities ~0.75 mi
Loading nearby amenities…
Taxation est. · year 1
- Rental income
- $22,536
- − Mortgage interest
- −$6,582
- − Property taxes
- −$2,701
- − Insurance
- −$588
- − Repairs & maintenance
- −$1,803
- − Management
- −$1,803
- − Depreciation
- −$3,418
- Taxable income
- $5,641
- Est. tax owed @ 24.0%
- −$1,354
- After-tax cash flow
- $5,766/yr
For passive investors: Depreciation is non-cash, so a rental often shows a tax loss while cash-flowing — sheltering income. Rental losses are passive: they offset passive income freely, and up to $25,000/yr can offset ordinary (W-2) income if you actively participate and your MAGI is under $100k (phasing out to $0 by $150k); unused losses carry forward. On sale, claimed depreciation is recaptured at up to 25%, and gains may owe capital-gains tax (a 1031 exchange can defer both). Figures are a year-1 estimate at your 24.0% rate — not tax advice; consult a CPA.
Schools (NCES district)
- District
- Erie City SD
- NCES district ID
- 4209300
- Math proficiency
- 12% ▼ -11.00%
- Reading proficiency
- 19% ▼ -16.00%
- Median HH income
- $33,625
- Composite
- 12.59/100
- National rank
- #9617
- State rank
- #510 of 539 in PA
Livability — Erie
- Score
- 83/100
- State rank
- #109
- US rank
- #840
Category grades
Schools grade is shown separately in the Schools card above.
Census & demographics
- Census place
- Erie, PA
- County
- Erie County · 92,215 people
- City population
- 92,215
- Metro
- Erie, PA
- Population (ZIP)
- 14,958
- Household income
- $56,391
- Rent vs Own
- Severe rent burden
- 420.0
Population outlook (Erie County) Hauer SSP2
- Today (2025)
- 272,159 people
- By 2030
- 266,299 · -2.2%
- By 2040
- 250,987 · -7.8%
- By 2050
- 234,925 · -13.7%
- By 2075
- 199,164 · -26.8%
- By 2100
- 162,985 · -40.1%
Race, ethnicity, and origin ACS 2023
- Neighborhood character
- Predominantly White (80%)
- Race & ethnicity
- White 80% Two or more races 12% Black 5% Hispanic / Latino 4% Asian 1%
- Common ancestry
- Romanian 13% Lithuanian 2% Scotch-Irish 2%
- Foreign-born
- 3% · Canada
- Languages at home
- 95% English-only · Spanish 2% Russian/Polish/Slavic 1% Other Indo-European 1%
Political lean MEDSL · Erie
- 2024 margin
- Toss-up / Even · D 49.0% · R 50.0%
- 2008→2024 swing
- -20.9pp toward R · 2008: 19.9pp · 2024: -1.0pp
- All cycles
- 2024: R+1.0 2020: D+1.0 2016: R+2.0 2012: D+16.9 2008: D+19.9
Not yet ingested
- Civics
- —
Market trends
- HPI YoY
- ▼ -74.05%
- Current HPI
- 250.759
- Rent YoY
- —
- Metro
- Erie, PA
- State GDP YoY
- ▲ 1.68%
- F500 in state
- 34
Industry mix (Fortune 500 HQ in PA)
| Industry | F500 HQs | Revenue |
|---|---|---|
| Healthcare | 2 | $309B |
|
||
| Insurance | 2 | $27B |
|
||
| Telecommunications / Media | 1 | $124B |
|
||
| Industrial Distribution | 1 | $22B |
|
||
| Financial Services | 1 | $20B |
|
||
| Chemicals / Materials | 1 | $18B |
|
||
Price history
+285.2% since first listed11 events — show timeline
- 2026-05-01 Pending — GEBOR
- 2026-03-20 Price Changed $117,500 GEBOR
- 2026-01-21 Listed $122,500 GEBOR
- 2019-05-09 Sold (MLS) $32,000 GEBOR
- 2018-11-01 Listed $36,900 GEBOR
- 2017-11-01 Listed $39,900 GEBOR
- 2017-06-05 Listed $47,900 GEBOR
- 2004-01-28 Sold (Public Records) $59,000 Public Records
- 2003-10-02 Sold (Public Records) $47,000 Public Records
- 1994-05-12 Sold (Public Records) $44,500 Public Records
- 1981-04-30 Sold (Public Records) $30,500 Public Records
Property tax history
+1.9%/yrLatest (2026): $2,701 · +3.4% YoY. Source: county tax records.
Cash-flow waterfall
monthlySold comps — $/sqft
last 12 mo · ≤1 miLoading sold comps…