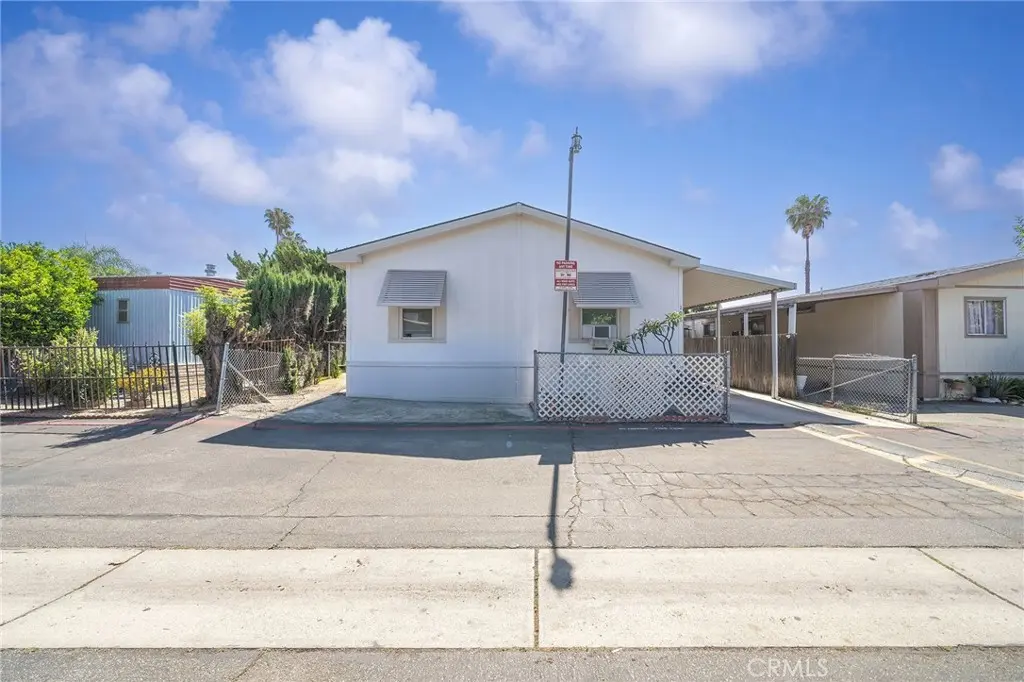
1401 W 9th #103 · Pomona, CA
Flood risk 3/10 · Minor
- FEMA flood zone
- X (unshaded)
- Chance of flooding over 30 yrs
- 0.18%
- Est. flood insurance / yr
- $507 – $1,088
Fire risk 1/10 · Minimal
- Est. fire insurance / yr
- $659 – $1,223
Heat risk 7/10 · Major
- Hot days now (above 99°F)
- 7 days/yr
- Hot days in 30 yrs
- 18 days/yr
Wind risk 1/10 · Minimal
- Chance of severe wind over 30 yrs
- —
Air-quality risk 8/10 · Major
- Unhealthy air days now
- 17 days/yr
- Unhealthy air days in 30 yrs
- 21 days/yr
Risk factors via First Street. Map © Google.
Why this score? — see what drove the B- grade
The composite is a weighted blend of 9 inputs, each scored 0–100. Each bar is that input's sub-score; the figure is the points it added to the 100-point composite (weight × sub-score).
- Cash flow +30.0/30.0
- 1% rule +10.0/10.0
- DSCR +10.0/10.0
- ARV discount +5.9/15.0
- Rent growth +2.9/5.0
- Livability +2.9/5.0
- Condition / age +2.5/5.0
- Schools +2.0/10.0
- Appreciation +0.0/10.0
$189,900
🖨 Deal sheet 📄 Offer letter ✓ Due diligence
Listing remarks MLS
Come see this spacious home with 4 bedrooms and 2 bathrooms! Kitchen has an island, a pantry with a skylight. The LARGE Master bedroom (WHOA!) has 2 closets and a very SPACIOUS master bathroom with a skylight. Plenty of closet space all around including a laundry room and 2 linen closets. Also has a shed unit outside with a carport that fits two cars easily. Fully fenced to have your adorable pets roam around. This is a MUST SEE!!!
Key facts
- Island in kitchen
- Stores
- Restaurants
Tags
Property features AI
Finance
- Other: Living area source: Assessor's data; Directions: S. Dudley St. / Vejar St.
- Financial info: Land lease amount: $1,312.50 monthly (park source)
- HOA & community: Land lease in park (monthly); Park name: Westland Estates Pomona Mobile Home Park; Rent includes pool and sewer; Manager approval required
Exterior
- Parking: Carport; Has parking; Located in Westland Estates Pomona Mobile Home Park
- Security: Automatic gate; Carbon monoxide detector(s); Smoke detector
- Utilities: Private and district/public water available; Private sewer and public sewer available
- Home design: Mobile home (2004 model); Double-body mobile home; Single-story; Entry level: 1
- Construction: Mobile home remains on site; Model year 2004
- Exterior features: In-ground community pool; Walkstreet lot feature; Street lighting in community
Interior
- Kitchen: Gas oven; Dishwasher
- Bedrooms: Primary bedroom
- Bathrooms: 2 full bathrooms
- Heating & cooling: Central furnace
- Interior features: One-level interior; Entry accessed via stair; Automatic gate; Carbon monoxide detector(s); Smoke detector
- Laundry & utility: Laundry inside in an individual room
Neighborhood map
What this means for you Summary
Snapshot
- This is a 4-bed/2.0-bath manufactured listed at $190k.
Deal economics
- At list price, monthly cash flow is $2k ($21k/yr) — positive.
- The deal already cash-flows at list — no discount required.
- Meets the 1% rule at list price ($4k rent vs $190k).
- Cap rate 17.3% vs local median 2.8% in Pomona — top-decile yield for the area; either an underpriced asset or a hidden risk that comps aren't pricing in. Stress-test before assuming the spread holds.
Location & tenants
- Location reads 58/100 on livability (#676 in CA) — a working-class tenant base; expect higher turnover. Strengths: commute A+; Watch: schools D, crime F, amenities F.
- Pomona Unified (suburban): math 12% / reading 31% proficiency, ranked #444 of 517 in CA (top 86%) — low school quality limits family demand, transient renter base, plan for 1-2y turnover; 73% free/reduced lunch — lower-income household profile, screen leases tightly.
- Market conditions: Rents rising (+1.7%/yr); 110 active listings in the ZIP; 17 comparable units currently listed for rent nearby; rentals at typical pace (median 25d on market — plan ~3-4 weeks tenant-placement turnaround); 47% of comp listings sitting > 30 days — soft ceiling on asking rent; solid renter incomes; 19,697 units permitted in Los Angeles County in 2024 (9,426 in 5+ unit buildings).
- At $3,645/mo this rent would consume 53% of the median local household income ($82k/yr) (locally 2479% of renters already pay >50% of income on rent) — very limited rent-growth headroom before tenants either downsize or default.
Forward outlook
- Local home prices are declining (-3.0%/yr); year-one equity from $1k of loan paydown is wiped out by about $6k of value loss. Plan a longer hold.
- Los Angeles County population projected at +9% by 2050 — modest demand growth; plan on rents tracking national, not racing it.
- At projected returns (-3.0% appreciation + 1.7% rent growth), your $53k cash investment doubles in ~4 years — after that, you're playing with house money.
Negotiation context
- Only 6 days on market — expect competitive offers; lowballing is unlikely to land.
- 7 sale attempts since 20y ago with the ask held roughly flat each time — persistent listings suggest the price (not the market) is what's stuck; bring a comps-based counter.
- Current owner paid $148k; 28% above their basis — modest negotiation headroom, anchor on the comps not their cost.
Risks & watch-outs
- Climate carrying-cost: extreme-heat days projected 7→18/yr by 2055 (HVAC capex compounding) — expect insurance premiums to compound above CPI over the hold.
Questions for the listing agent
- Is there a deadline driving the sale (1031 exchange, divorce, estate, relocation)? That informs how much negotiation room exists.
- Schools are D-rated, which usually means shorter tenancies and higher turnover. Who's the typical renter profile here, and what's been the actual vacancy rate?
- Crime grade is F in this area — have there been break-ins, vandalism, or insurance claims at this property in the last 3 years? What carrier currently insures it and at what premium?
- What's the average days-on-market for RENTAL listings here right now (not sales)? A rising rental-DOM trend means longer vacancies and softer asking-rent achievability than the comps imply.
- What's the recent tenant-quality profile in this submarket — average credit score on applications, eviction rate, late-payment / NSF rate, and stable-employment percentage? A property-management company in the area should have these aggregated.
- How much new for-sale + rental construction is in the pipeline within 1–3 miles? Heavy new supply typically softens prices + rents 12–24 months out; constrained supply supports both.
Investment metrics
- 1% rule
- 1.92% ✓
- Cap rate
- 17.31%
- Cash-on-cash
- 39.34%
- DSCR
- 2.75
- GRM
- 4.3
CMA / ARV
- ARV (on-the-fly)
- $183,456
- Comps found
- 2
Show comp detail 2 sales within ~0.75 mi
| Address | Dist | Beds/Ba | Sqft | Sold | Price | $/sf | Match |
|---|---|---|---|---|---|---|---|
| 1401 W 9th #59 | 0.00mi | 4/2.0 | 1,536 (-2%) | 2mo | $180,000 | $117 | 95 |
| 1401 W 9th St #75 | 0.00mi | 4/2.0 | 1,440 (-8%) | 6mo | $156,000 | $108 | 82 |
Match score weights: distance 35% · size 25% · config 20% · recency 20%. Top-matched comps best support the ARV.
Projected returns pro-forma
-3.0% appreciation · 1.66% rent growth · sell at horizon
- IRR
- 34.1%
- Equity multiple
- 2.42×
- Total profit
- $75,337
- Equity at exit
- $28,315
- IRR
- 40.3%
- Equity multiple
- 4.55×
- Total profit
- $188,961
- Equity at exit
- $16,419
Cash invested: $53,172 (down + closing). Projections, not guarantees.
Landlord ↔ Tenant lean methodology
- Overall (STATE)
- 18 Strongly Tenant-Friendly
- State California
- 18 Strongly Tenant-Friendly · D+13
- County
- — inherits STATE
- City
- — inherits STATE
ZIP-level market 91766
- Rents YoY
- 1.7%
- Active inventory
- 110
- Price-to-rent
- 4.3×
Monthly cashflow live
- Estimated rent
- $3,645 high interval (Pro) →
- Mortgage (P&I)
- −$996
- Tax from tax record
- −$62 /mo · $743/yr
- Insurance
- −$79
- HOA
- −$0
- Vacancy / Maint / Mgmt
- −$766
- Net cashflow
- $1,743
Break-even live
UW: 25.0% down · 7.5% · 30yr · 1.5% tax · 5.0% vac · 8.0% maint · 8.0% mgmt
Financing live
Cash to close
- Down payment
- $47,475
- Closing costs
- $5,697
- Reserves months
- —
- Total cash needed
- —
Loan-product check · same deal, 3 products live
Conventional
25% down · 7.5% · 30yr
- Down + closing
- —
- Monthly P&I
- —
- Monthly cashflow
- —
- DSCR
- —
- Eligible?
- —
Personal DTI + credit; lowest rate.
DSCR
20% down · 8.5% · 30yr
- Down + closing
- —
- Monthly P&I
- —
- Monthly cashflow
- —
- DSCR
- —
- Eligible?
- —
No personal income docs; deal must DSCR.
Hard money
10% down · 12.0% · 12mo
- Down + closing
- —
- Monthly P&I
- —
- Monthly cashflow
- —
- DSCR
- —
- Eligible?
- —
Short-term bridge; refi at stabilization.
Rent comps 17 comps
| Address | Beds | Baths | Sqft | Rent | $/sqft | DOM | Units | Dist |
|---|---|---|---|---|---|---|---|---|
| 1543 Mc Comas St Pomona, CA | 3.0 | 2.0 | 1199 | $3,500 | $2.92 | 17d | 1 | 0.27mi |
| 1325 W Grand Ave Unit 3 Pomona, CA | 3.0 | 2.5 | 1628 | $3,350 | $2.06 | 43d | 1 | 0.35mi |
| 1036 W Fernleaf Ave Pomona, CA | 3.0 | 3.0 | 1605 | $3,200 | $1.99 | 43d | 1 | 0.71mi |
| 761 Lewis St Pomona, CA | 3.0 | 2.5 | 1726 | $7,000 | $4.06 | 20d | 1 | 0.88mi |
| 642 W Grand Ave Pomona, CA | 4.0 | 3.0 | 1689 | $3,495 | $2.07 | 17d | 1 | 0.94mi |
| 1908 Grier St Pomona, CA | 3.0 | 1.0 | 1106 | $3,200 | $2.89 | 2d | 1 | 0.97mi |
| 1010 W Wilson St Pomona, CA | 4.0 | 3.5 | 2013 | $3,250 | $1.61 | 43d | 1 | 0.97mi |
| 1333 S Park Ave Pomona, CA | 4.0 | 2.0 | 1200 | $3,395 | $2.83 | 24d | 1 | 1.01mi |
| 1333 S Park Ave Pomona, CA | 4.0 | 2.0 | 1200 | $3,500 | $2.92 | 43d | 1 | 1.01mi |
| 1331 S Park Ave Unit 1333 Pomona, CA | 4.0 | 2.0 | 1200 | $2,959 | $2.47 | 11d | 1 | 1.01mi |
| 1331 S Park Ave Unit 1333 Pomona, CA | 4.0 | 2.0 | 1200 | $3,395 | $2.83 | 43d | 1 | 1.01mi |
| 998 Rodeo Rd Pomona, CA | 4.0 | 3.0 | 2019 | $3,695 | $1.83 | 24d | 1 | 1.21mi |
| 1741 Warwick St Pomona, CA | 3.0 | 2.0 | 1200 | $4,500 | $3.75 | 43d | 1 | 1.21mi |
| 417 W Franklin Ave Pomona, CA | 3.0 | 2.0 | 1181 | $3,300 | $2.79 | 43d | 1 | 1.29mi |
| 1318 Jacqueline Dr Pomona, CA | 3.0 | 2.0 | 1328 | $3,500 | $2.64 | 1d | 1 | 1.38mi |
| 1339 Nimbus Ct Pomona, CA | 3.0 | 3.0 | 1500 | $3,320 | $2.21 | 10d | 1 | 1.38mi |
| 1501 Stratus Dr Pomona, CA | 3.0 | 3.5 | 1791 | $3,150 | $1.76 | 43d | 1 | 1.44mi |
Listing history 6 events
-
2026-06-18days on market $189,900 Active 6 DOM
-
2026-06-17days on market $189,900 Active 5 DOM
-
2026-06-16days on market $189,900 Active 4 DOM
-
2026-06-15days on market $189,900 Active 3 DOM
-
2026-06-13remarks 365-char remark
-
2026-06-13$189,900 Active 1 DOM
ⓘ Source: listings_history table (triggers on properties + properties_extension) + one-shot
backfill from property_details.listing_events for pre-trigger history.
Tax reassessment forecast CA · Resets to sale price
- Current annual tax
- $743 · $62/mo
- Projected year-2 tax
- $1,443 · $120/mo
- Expected delta
- +$701/yr (+$58/mo · 94.3%)
ⓘ Screening estimate from a state-policy table — verify with the county assessor before closing.
Climate risk First Street
- Flood 3/10 Moderate FEMA zone X (unshaded) · 18% chance over 30 yrs
- Wildfire 1/10 Low
- Heat 7/10 Severe 7 d/yr ≥99°F today · 18 d/yr by 30 yrs out
- Wind 1/10 Low
- Air quality 8/10 Severe 17 unhealthy d/yr today · 21 by 30 yrs out
Nearby sold comps map
Loading sold comps map…
Walkable amenities ~0.75 mi
Loading nearby amenities…
Taxation est. · year 1
- Rental income
- $43,745
- − Mortgage interest
- −$10,637
- − Property taxes
- −$743
- − Insurance
- −$950
- − Repairs & maintenance
- −$3,500
- − Management
- −$3,500
- − Depreciation
- −$5,524
- Taxable income
- $18,892
- Est. tax owed @ 24.0%
- −$4,534
- After-tax cash flow
- $16,382/yr
For passive investors: Depreciation is non-cash, so a rental often shows a tax loss while cash-flowing — sheltering income. Rental losses are passive: they offset passive income freely, and up to $25,000/yr can offset ordinary (W-2) income if you actively participate and your MAGI is under $100k (phasing out to $0 by $150k); unused losses carry forward. On sale, claimed depreciation is recaptured at up to 25%, and gains may owe capital-gains tax (a 1031 exchange can defer both). Figures are a year-1 estimate at your 24.0% rate — not tax advice; consult a CPA.
Schools (NCES district)
- District
- Pomona Unified
- NCES district ID
- 0631320
- Math proficiency
- 12% ▼ -15.00%
- Reading proficiency
- 31% ▼ -10.00%
- Median HH income
- $54,839
- Composite
- 19.54/100
- National rank
- #8761
- State rank
- #444 of 517 in CA
Livability — Pomona
- Score
- 58/100
- State rank
- #676
- US rank
- #20782
Category grades
Schools grade is shown separately in the Schools card above.
Census & demographics
- Census place
- Pomona, CA
- County
- Los Angeles County · 9,444,647 people
- City population
- 152,679
- Metro
- Los Angeles-Long Beach-Anaheim, CA
- Population (ZIP)
- 69,327
- Household income
- $81,991
- Rent vs Own
- Severe rent burden
- 2479.0
Population outlook (Los Angeles County) Hauer SSP2
- Today (2025)
- 10,940,515 people
- By 2030
- 11,256,481 · +2.9%
- By 2040
- 11,729,929 · +7.2%
- By 2050
- 11,948,407 · +9.2%
- By 2075
- 11,818,114 · +8.0%
- By 2100
- 10,842,928 · -0.9%
Race, ethnicity, and origin ACS 2023
- Neighborhood character
- Predominantly Hispanic (72%)
- Race & ethnicity
- Hispanic / Latino 72% Two or more races 20% Asian 13% White 8% Black 5% Native American 2%
- Hispanic origin (detail)
- Mexican 62%
- Foreign-born
- 37% · Canada, China, South Korea
- Languages at home
- 31% English-only · Spanish 57% Chinese 5% Tagalog/Filipino 2%
Political lean MEDSL · Los Angeles
- 2024 margin
- Solid D (+32.9) · D 64.8% · R 31.9% · Other 3.3%
- 2008→2024 swing
- -7.4pp toward R · 2008: 40.4pp · 2024: 32.9pp
- All cycles
- 2024: D+32.9 2020: D+44.2 2016: D+48.0 2012: D+40.0 2008: D+40.4
Not yet ingested
- Civics
- —
Market trends
- HPI YoY
- ▼ -691.41%
- Current HPI
- 405.6315
- Rent YoY
- ▲ 1.66%
- Metro
- Los Angeles-Long Beach-Anaheim, CA
- State GDP YoY
- ▲ 3.21%
- F500 in state
- 116
Industry mix (Fortune 500 HQ in CA)
| Industry | F500 HQs | Revenue |
|---|---|---|
| Technology | 27 | $1,492B |
|
||
| Financial Services | 3 | $174B |
|
||
| Retail | 3 | $44B |
|
||
| Insurance | 3 | $26B |
|
||
| Media / Entertainment | 2 | $115B |
|
||
| Pharmaceuticals / Biotech | 2 | $62B |
|
||
Price history
+58.9% since first listed20 events — show timeline
- 2026-06-12 Listed $189,900 CRMLS
- 2026-05-11 Listing Removed — CRMLS
- 2026-05-09 Listed $180,000 CRMLS
- 2022-10-05 Sold (MLS) $148,000 CRMLS
- 2022-09-10 Contingent — CRMLS
- 2022-09-07 Pending — CRMLS
- 2022-08-24 Listed $135,000 CRMLS
- 2022-08-18 Coming Soon $135,000 CRMLS
- 2009-09-10 Sold (MLS) $64,500 CRMLS
- 2009-08-25 Pending — CRMLS
- 2009-07-02 Listed $75,000 CRMLS
- 2007-11-01 Listing Removed — CRMLS
- 2007-10-04 Price Changed $105,000 CRMLS
- 2007-08-10 Price Changed $110,000 CRMLS
- 2007-06-07 Price Changed $115,000 CRMLS
- 2007-05-14 Listed $120,000 CRMLS
- 2006-09-15 Sold (MLS) $109,000 CRMLS
- 2006-07-26 Listing Removed — CRMLS
- 2006-07-14 Listed $109,000 CRMLS
- 2006-04-26 Listed $119,500 CRMLS
Property tax history
+27.4%/yrLatest (2025): $743 · +27.4% YoY. Source: county tax records.
Cash-flow waterfall
monthlySold comps — $/sqft
last 12 mo · ≤1 miLoading sold comps…