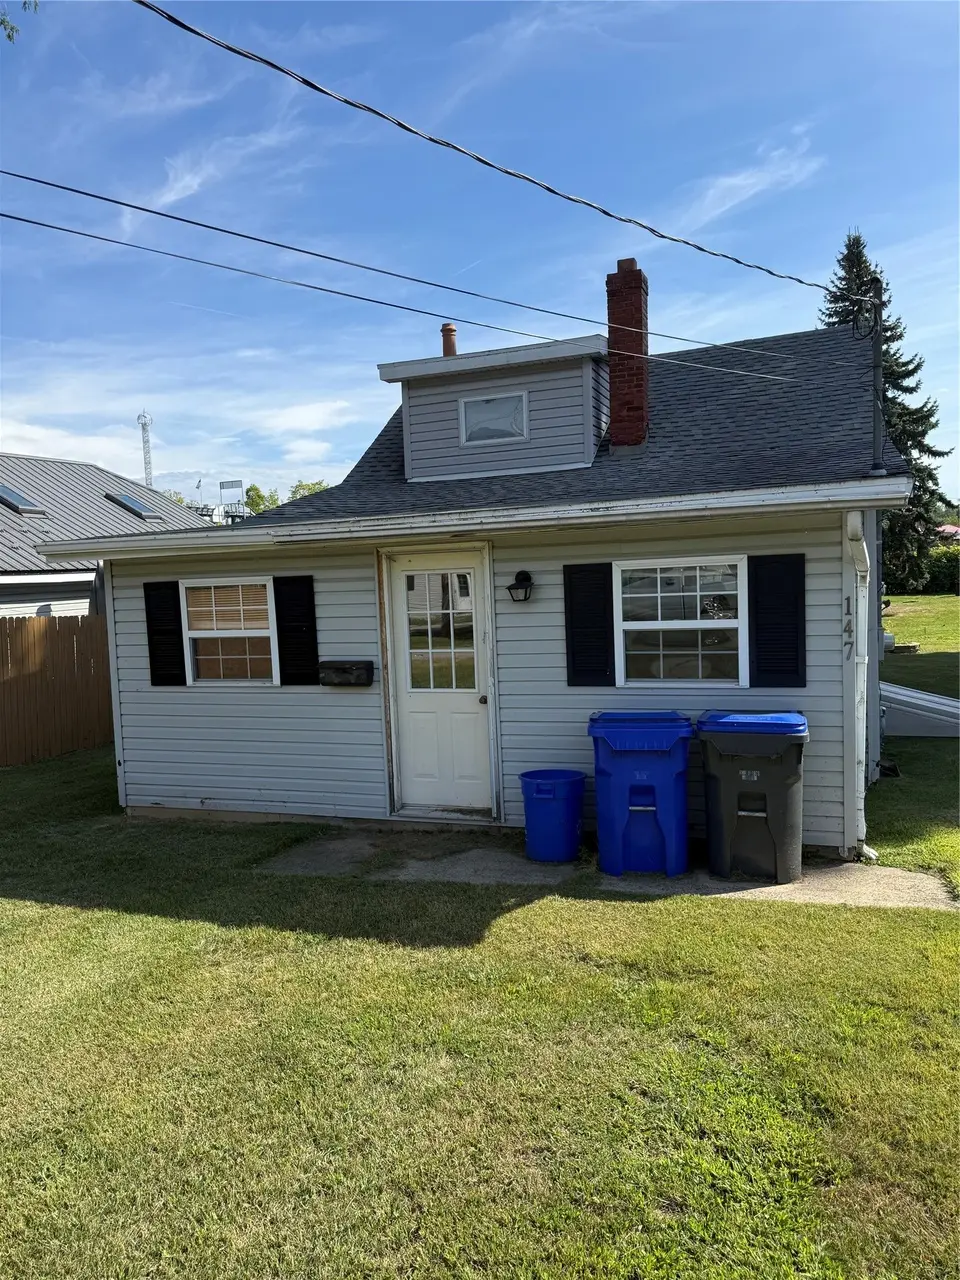
147 Kelso Dr E · Erie, PA
Flood risk 1/10 · Minimal
- FEMA flood zone
- X (unshaded)
- Chance of flooding over 30 yrs
- 0.0%
- Est. flood insurance / yr
- $473 – $860
Fire risk 1/10 · Minimal
- Est. fire insurance / yr
- $511 – $949
Heat risk 2/10 · Minimal
- Hot days now (above 90°F)
- 7 days/yr
- Hot days in 30 yrs
- 17 days/yr
Wind risk 1/10 · Minimal
- Chance of severe wind over 30 yrs
- —
Air-quality risk 3/10 · Minor
- Unhealthy air days now
- 3 days/yr
- Unhealthy air days in 30 yrs
- 3 days/yr
Risk factors via First Street. Map © Google.
Why this score? — see what drove the D grade
The composite is a weighted blend of 9 inputs, each scored 0–100. Each bar is that input's sub-score; the figure is the points it added to the 100-point composite (weight × sub-score).
- Cash flow +14.7/30.0
- ARV discount +7.5/15.0
- Schools +4.8/10.0
- DSCR +4.5/10.0
- Livability +4.2/5.0
- 1% rule +3.8/10.0
- Rent growth +2.5/5.0
- Condition / age +2.5/5.0
- Appreciation +0.0/10.0
$174,900
🖨 Deal sheet 📄 Offer letter ✓ Due diligence
Listing remarks MLS
Opportunity abound with this two story home located in the heart of the tourism district. With some TLC , this 3 bedroom, open concept property, will make for a perfect summer get away or rental. With Waldameer on the other side of the fence in the back yard, its not hard to see that location is key here! Imagination and paint can bring this "diamond in the rough" back to life!
Key facts
- Open concept
- Two story home
- 5,793 sq ft lot
Tags
Neighborhood map
What this means for you Summary
Snapshot
- This is a 2-bed/1.0-bath single-family listed at $175k.
Deal economics
- At list price, monthly cash flow is $44 ($529/yr) — positive.
- The deal already cash-flows at list — no discount required.
- To meet the 1% rule (rent ≥ 1% of price), the offer needs to be $154k (12.1% below list).
- Recommended offer: $154k (12.1% below list) — sets the bar for 1% rule.
- Cap rate 6.6% vs local median 5.2% in Erie — meaningfully above typical; check what's discounted (condition, days-on-market, listing class) to confirm the premium yield is real.
Location & tenants
- Location reads 83/100 on livability (#109 in PA, #840 nationally) — a professional / high-income tenant draw. Strengths: amenities A+, commute A+, cost of living A+; Watch: crime D+, employment F.
- Millcreek Township SD (suburban): math 46% / reading 65% proficiency, ranked #105 of 539 in PA (top 20%) — acceptable for families but not a draw, mixed tenant base, ~2y average lease.
- Market conditions: 71 active listings in the ZIP; 6 comparable units currently listed for rent nearby; rentals lingering (median 44d on market — plan ~5-8 weeks vacancy on turnover, expect pricing pressure); 100% of comp listings sitting > 30 days — soft ceiling on asking rent; 364 units permitted in Erie County in 2024 (188 in 5+ unit buildings).
Forward outlook
- Local home prices are declining (-3.0%/yr); year-one equity from $1k of loan paydown is wiped out by about $5k of value loss. Plan a longer hold.
- Erie County population projected at -14% by 2050 — secular population decline; favor cash flow + early exit over multi-decade hold.
Negotiation context
- It's been on market 294 days — a 12% lower offer ($154k) is reasonable based on typical stale-listing flexibility.
Risks & watch-outs
- Watch-outs: built in 1940 — expect roof / HVAC / electrical / plumbing capex.
Questions for the listing agent
- It's been on market 294 days. Have you received any prior offers? Is the seller open to a 12% concession, seller financing, or rate buy-down credit?
- Built in 1940 — when were the roof, HVAC, electrical panel, plumbing, and water heater last replaced?
- What does the HOA fee cover, when was the last increase, and are there any pending special assessments or reserve-fund shortfalls?
- Why hasn't it sold? Are there any deal-killer items the seller is aware of (foundation, flood, title, zoning, code violations)?
- Is there a deadline driving the sale (1031 exchange, divorce, estate, relocation)? That informs how much negotiation room exists.
- Crime grade is D in this area — have there been break-ins, vandalism, or insurance claims at this property in the last 3 years? What carrier currently insures it and at what premium?
- The area grade is low — what's the realistic commute time and amenity access for the typical tenant pool here? Any planned neighborhood developments (good or bad) we should know about?
- What's the average days-on-market for RENTAL listings here right now (not sales)? A rising rental-DOM trend means longer vacancies and softer asking-rent achievability than the comps imply.
- What's the recent tenant-quality profile in this submarket — average credit score on applications, eviction rate, late-payment / NSF rate, and stable-employment percentage? A property-management company in the area should have these aggregated.
- How much new for-sale + rental construction is in the pipeline within 1–3 miles? Heavy new supply typically softens prices + rents 12–24 months out; constrained supply supports both.
Investment metrics
- 1% rule
- 0.88% ✗
- Cap rate
- 6.60%
- Cash-on-cash
- 1.08%
- DSCR
- 1.05
- GRM
- 9.5
CMA / ARV
- ARV (median comp)
- $174,900
- List price
- $174,900
- Delta
- —
- Verdict
- FAIR
- Comps
- 20 within 1.0 mi
Show comp detail 10 sales within ~0.75 mi
| Address | Dist | Beds/Ba | Sqft | Sold | Price | $/sf | Match |
|---|---|---|---|---|---|---|---|
| 101 Kelso Dr E | 0.09mi | 2/1.0 | 882 (-1%) | 10mo | $125,000 | $142 | 86 |
| 3130 Sunnylane Dr | 0.06mi | 2/1.0 | 844 (-5%) | 10mo | $235,000 | $278 | 80 |
| 3152 Bank Dr | 0.11mi | 2/1.0 | 825 (-7%) | 5mo | $174,900 | $212 | 79 |
| 3156 Bank Dr | 0.11mi | 2/1.0 | 802 (-10%) | 5mo | $174,900 | $218 | 74 |
| 138 Kelso Dr | 0.03mi | 2/1.0 | 756 (-15%) | 11mo | $230,000 | $304 | 65 |
| 301 Blackstone Dr | 0.58mi | 2/1.0 | 928 (+4%) | 7mo | $194,000 | $209 | 60 |
| 911 Michigan Blvd | 0.52mi | 2/1.0 | 936 (+5%) | 13mo | $200,000 | $214 | 56 |
| 3024 W 11th St | 0.65mi | 3/1.0 (+1) | 881 (-1%) | 20mo | $110,000 | $125 | 46 |
| 3024 Haas Ave | 0.56mi | 3/2.0 (+1) | 980 (+10%) | 24mo | $132,100 | $135 | 28 |
| 3034 W 11th St | 0.65mi | 3/2.0 (+1) | 1,008 (+14%) | 14mo | $210,000 | $208 | 27 |
Match score weights: distance 35% · size 25% · config 20% · recency 20%. Top-matched comps best support the ARV.
Projected returns pro-forma
-3.0% appreciation · 3.0% rent growth · sell at horizon
- IRR
- -14.6%
- Equity multiple
- 0.48×
- Total profit
- $-25,533
- Equity at exit
- $26,078
- IRR
- -5.9%
- Equity multiple
- 0.62×
- Total profit
- $-18,620
- Equity at exit
- $15,122
Cash invested: $48,972 (down + closing). Projections, not guarantees.
Landlord ↔ Tenant lean methodology
- Overall (STATE)
- 62 Landlord-Friendly
- State Pennsylvania
- 62 Landlord-Friendly · EVEN
- County
- — inherits STATE
- City
- — inherits STATE
ZIP-level market 16505
- Home prices YoY
- -33.5%
- Active inventory
- 71
- Price-to-rent
- 9.5×
Monthly cashflow live
- Estimated rent
- $1,537 high interval (Pro) →
- Mortgage (P&I)
- −$917
- Tax from tax record
- −$142 /mo · $1,701/yr
- Insurance
- −$73
- HOA
- −$38
- Vacancy / Maint / Mgmt
- −$323
- Net cashflow
- $44
Break-even live
UW: 25.0% down · 7.5% · 30yr · 1.5% tax · 5.0% vac · 8.0% maint · 8.0% mgmt
Financing live
Cash to close
- Down payment
- $43,725
- Closing costs
- $5,247
- Reserves months
- —
- Total cash needed
- —
Loan-product check · same deal, 3 products live
Conventional
25% down · 7.5% · 30yr
- Down + closing
- —
- Monthly P&I
- —
- Monthly cashflow
- —
- DSCR
- —
- Eligible?
- —
Personal DTI + credit; lowest rate.
DSCR
20% down · 8.5% · 30yr
- Down + closing
- —
- Monthly P&I
- —
- Monthly cashflow
- —
- DSCR
- —
- Eligible?
- —
No personal income docs; deal must DSCR.
Hard money
10% down · 12.0% · 12mo
- Down + closing
- —
- Monthly P&I
- —
- Monthly cashflow
- —
- DSCR
- —
- Eligible?
- —
Short-term bridge; refi at stabilization.
Rent comps 6 comps
| Address | Beds | Baths | Sqft | Rent | $/sqft | DOM | Units | Dist |
|---|---|---|---|---|---|---|---|---|
| 3257 Lake Front Dr Erie, PA | 3.0 | 2.0 | 880 | $2,000 | $2.27 | 43d | 1 | 0.24mi |
| 509 Beachgrove Dr Apt 4 Erie, PA | 1.0 | 1.0 | 750 | $850 | $1.13 | 43d | 1 | 0.59mi |
| 3063 W 11th St Apt 30 Erie, PA | 1.0 | 1.0 | 650 | $925 | $1.42 | 43d | 1 | 0.68mi |
| 2540 W 8th St Erie, PA | 1.0–2.0 | 1.0–2.0 | 550 | $1,711 | $3.11 | 43d | 1 | 0.99mi |
| 3738 W 12th St Unit 1 Erie, PA | 2.0 | 1.0 | 925 | $1,180 | $1.28 | 43d | 1 | 1.07mi |
| 4060 Chilton Ct Unit 2 Erie, PA | 2.0 | 1.0 | 768 | $1,400 | $1.82 | 43d | 1 | 1.35mi |
HOA detail
- Monthly dues
- $38 · $456/yr
Listing history 19 events
-
2026-06-19days on market $174,900 Active 294 DOM
-
2026-06-18days on market $174,900 Active 293 DOM
-
2026-06-17days on market $174,900 Active 292 DOM
-
2026-06-16days on market $174,900 Active 291 DOM
-
2026-06-15days on market $174,900 Active 290 DOM
-
2026-06-14days on market $174,900 Active 288 DOM
-
2026-06-13days on market $174,900 Active 287 DOM
-
2026-06-10days on market $174,900 Active 285 DOM
-
2026-06-09days on market $174,900 Active 284 DOM
-
2026-06-08days on market $174,900 Active 283 DOM
-
2026-06-07days on market $174,900 Active 282 DOM
-
2026-06-03days on market $174,900 Active 278 DOM
-
2026-06-02days on market $174,900 Active 277 DOM
-
2026-06-01days on market $174,900 Active 276 DOM
-
2026-05-31days on market $174,900 Active 275 DOM
-
2026-05-30days on market $174,900 Active 274 DOM
-
2025-08-29$174,900 Active 390-char remark
Show marketing remark (390 chars)
Opportunity abound with this two story home located in the heart of the tourism district. With some TLC , this 3 bedroom, open concept property, will make for a perfect summer get away or rental. With Waldameer on the other side of the fence in the back yard, its not hard to see that location is key here! Imagination and paint can bring this "diamond in the rough" back to life!
-
2023-06-29soldstatus $754,000
-
1990-12-06soldstatus $25,000
ⓘ Source: listings_history table (triggers on properties + properties_extension) + one-shot
backfill from property_details.listing_events for pre-trigger history.
Tax reassessment forecast PA · Partial reset (capped growth)
- Current annual tax
- $1,701 · $142/mo
- Projected year-2 tax
- $2,232 · $186/mo
- Expected delta
- +$531/yr (+$44/mo · 31.3%)
ⓘ Screening estimate from a state-policy table — verify with the county assessor before closing.
Climate risk First Street
- Flood 1/10 Low FEMA zone X (unshaded) · 0% chance over 30 yrs
- Wildfire 1/10 Low
- Heat 2/10 Low 7 d/yr ≥90°F today · 17 d/yr by 30 yrs out
- Wind 1/10 Low
- Air quality 3/10 Moderate 3 unhealthy d/yr today · 3 by 30 yrs out
Nearby sold comps map
Loading sold comps map…
Walkable amenities ~0.75 mi
Loading nearby amenities…
Taxation est. · year 1
- Rental income
- $18,439
- − Mortgage interest
- −$9,797
- − Property taxes
- −$1,701
- − Insurance
- −$874
- − Repairs & maintenance
- −$1,475
- − Management
- −$1,475
- − HOA
- −$456
- − Depreciation
- −$5,088
- Taxable loss
- −$2,428
- Est. tax savings @ 24.0%
- +$583
- After-tax cash flow
- $1,112/yr
For passive investors: Depreciation is non-cash, so a rental often shows a tax loss while cash-flowing — sheltering income. Rental losses are passive: they offset passive income freely, and up to $25,000/yr can offset ordinary (W-2) income if you actively participate and your MAGI is under $100k (phasing out to $0 by $150k); unused losses carry forward. On sale, claimed depreciation is recaptured at up to 25%, and gains may owe capital-gains tax (a 1031 exchange can defer both). Figures are a year-1 estimate at your 24.0% rate — not tax advice; consult a CPA.
Schools (NCES district)
- District
- Millcreek Township SD
- NCES district ID
- 4215330
- Math proficiency
- 46% ▼ -13.00%
- Reading proficiency
- 65% ▼ -9.00%
- Median HH income
- $55,734
- Composite
- 47.82/100
- National rank
- #2224
- State rank
- #105 of 539 in PA
Livability — Erie
- Score
- 83/100
- State rank
- #109
- US rank
- #840
Category grades
Schools grade is shown separately in the Schools card above.
Census & demographics
- City population
- 92,215
- Population (ZIP)
- 15,631
Population outlook (Erie County) Hauer SSP2
- Today (2025)
- 272,159 people
- By 2030
- 266,299 · -2.2%
- By 2040
- 250,987 · -7.8%
- By 2050
- 234,925 · -13.7%
- By 2075
- 199,164 · -26.8%
- By 2100
- 162,985 · -40.1%
Race, ethnicity, and origin ACS 2023
- Neighborhood character
- Predominantly White (93%)
- Race & ethnicity
- White 93% Hispanic / Latino 3% Two or more races 3% Asian 2% Black 1%
- Common ancestry
- Romanian 12% Slovak 3% Italian 2%
- Foreign-born
- 3% · Canada
- Languages at home
- 94% English-only · Other Indo-European 1% French/Haitian/Cajun 1% Spanish 1%
Political lean MEDSL · Erie
- 2024 margin
- Toss-up / Even · D 49.0% · R 50.0%
- 2008→2024 swing
- -20.9pp toward R · 2008: 19.9pp · 2024: -1.0pp
- All cycles
- 2024: R+1.0 2020: D+1.0 2016: R+2.0 2012: D+16.9 2008: D+19.9
Not yet ingested
- Civics
- —
Market trends
- HPI YoY
- ▼ -121.22%
- Current HPI
- 240.6976
- Rent YoY
- —
- Metro
- —
- State GDP YoY
- ▲ 1.68%
- F500 in state
- 34
Industry mix (Fortune 500 HQ in PA)
| Industry | F500 HQs | Revenue |
|---|---|---|
| Healthcare | 2 | $309B |
|
||
| Insurance | 2 | $27B |
|
||
| Telecommunications / Media | 1 | $124B |
|
||
| Industrial Distribution | 1 | $22B |
|
||
| Financial Services | 1 | $20B |
|
||
| Chemicals / Materials | 1 | $18B |
|
||
Price history
+599.6% since first listed3 events — show timeline
- 2025-08-29 Listed $174,900 GEBOR
- 2023-06-29 Sold (Public Records) $754,000 Public Records
- 1990-12-06 Sold (Public Records) $25,000 Public Records
Property tax history
+2.5%/yrLatest (2026): $1,701 · +3.6% YoY. Source: county tax records.
Cash-flow waterfall
monthlySold comps — $/sqft
last 12 mo · ≤1 miLoading sold comps…