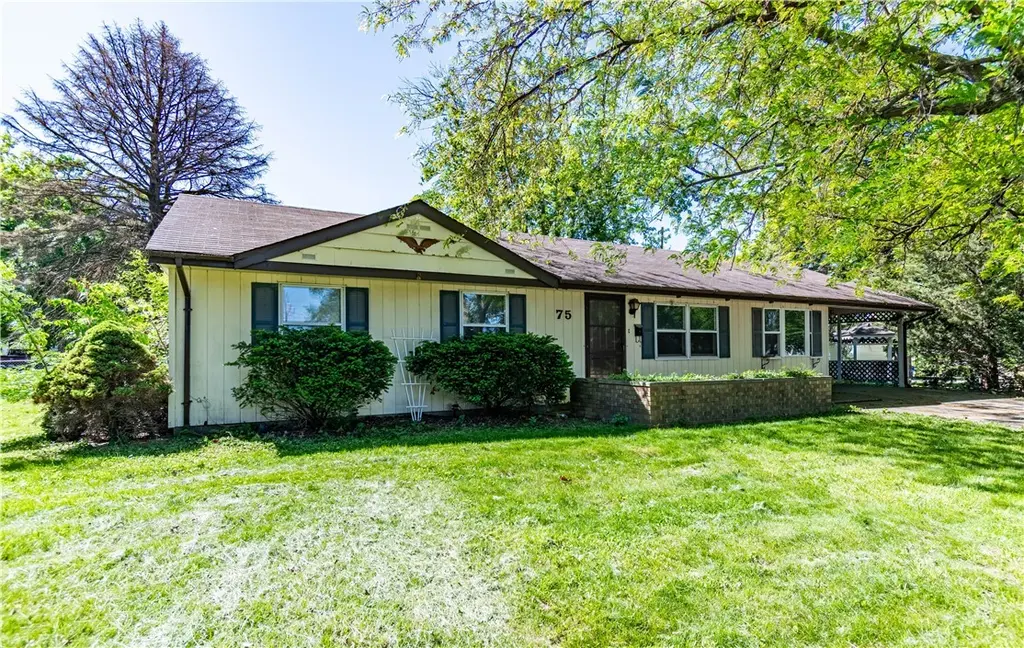
75 Whippoorwill Dr · Decatur, IL
Flood risk 1/10 · Minimal
- FEMA flood zone
- X (unshaded)
- Chance of flooding over 30 yrs
- 0.0%
- Est. flood insurance / yr
- $507 – $1,088
Fire risk 1/10 · Minimal
- Est. fire insurance / yr
- $804 – $1,492
Heat risk 3/10 · Minor
- Hot days now (above 106°F)
- 7 days/yr
- Hot days in 30 yrs
- 19 days/yr
Wind risk 2/10 · Minimal
- Chance of severe wind over 30 yrs
- 2.0%
Air-quality risk 2/10 · Minimal
- Unhealthy air days now
- 1 days/yr
- Unhealthy air days in 30 yrs
- 1 days/yr
Risk factors via First Street. Map © Google.
Why this score? — see what drove the B+ grade
The composite is a weighted blend of 9 inputs, each scored 0–100. Each bar is that input's sub-score; the figure is the points it added to the 100-point composite (weight × sub-score).
- Cash flow +30.0/30.0
- ARV discount +15.0/15.0
- 1% rule +10.0/10.0
- DSCR +10.0/10.0
- Appreciation +3.9/10.0
- Livability +3.0/5.0
- Rent growth +2.5/5.0
- Condition / age +2.5/5.0
- Schools +0.4/10.0
$69,000
🖨 Deal sheet (PDF) 📄 Offer letter ✓ Due diligence
Listing remarks
Main floor living! This 3 bedroom 1 bath ranch on a corner lot in Meadowlark is a blank slate and ready for new owners. Step inside to a spacious living room that flows right into your dedicated dining room. There is a bonus space off of the living room that will make the perfect office or playroom. Down the hall are all 3 bedrooms and full bath. Selling AS-IS. Schedule your private showing today!
Key facts
- Bonus space
- Corner lot
- 0.23 acre lot
Tags
Property features AI
Exterior
- Parking: Attached garage (1 car); Carport (1 car)
- Utilities: Public water; Public sewer; Electric service available; Natural gas
- Home design: Single-family, one-story home; Entry level: One
- Construction: Vinyl and wood siding; Slab foundation; Built with asphalt shingle roof
- Exterior features: Asphalt shingle roof; Concrete road access; Lot approximately 0.23 acres
Interior
- Kitchen: Oven; Range
- Bathrooms: 1 full bathroom
- Heating & cooling: Natural gas forced-air heating; Central air conditioning
- Interior features: Gas water heater; Oven; Range
- Laundry & utility: Washer and dryer (main level)
Neighborhood map
What this means for you Summary
Snapshot
- This is a 3-bed/1.0-bath single-family listed at $69k.
Deal economics
- At list price, monthly cash flow is $557 ($7k/yr) — positive.
- The deal already cash-flows at list — no discount required.
- Meets the 1% rule at list price ($1k rent vs $69k).
- Cap rate 16.0% vs local median 7.0% in Decatur — top-decile yield for the area; either an underpriced asset or a hidden risk that comps aren't pricing in. Stress-test before assuming the spread holds.
Location & tenants
- Location reads 59/100 on livability (#1,076 in IL) — a working-class tenant base; expect higher turnover. Strengths: cost of living A+, housing A+; Watch: crime F, amenities F, commute F.
- Decatur SD 61 (urban): math 3% / reading 6% proficiency, ranked #605 of 620 in IL (top 98%) — low school quality limits family demand, transient renter base, plan for 1-2y turnover; 73% free/reduced lunch — lower-income household profile, screen leases tightly.
- Zoned schools: Stephen Decatur Middle School (math 0% / reading 5%, grade F, #658 of 665 statewide, top 99%, 459 students, 0% FRL) — zoned schools average 0% FRL vs 73% district-wide (73 pts lower); this property's tenant base skews higher-income than the district average.
- Market conditions: 136 active listings in the ZIP; 2 comparable units currently listed for rent nearby; 63 units permitted in Macon County in 2024 (0 in 5+ unit buildings).
- This rent runs 32% of the median local income ($49k/yr) — at the standard rent-burdened threshold; future hikes will face affordability resistance.
Forward outlook
- Local home prices are declining (-2.2%/yr); year-one equity from $477 of loan paydown is wiped out by about $2k of value loss. Plan a longer hold.
- Macon County population projected at -24% by 2050 — secular population decline; favor cash flow + early exit over multi-decade hold.
- At projected returns (-2.2% appreciation + 3.0% rent growth), your $19k cash investment doubles in ~4 years — after that, you're playing with house money.
Negotiation context
- Only 11 days on market — expect competitive offers; lowballing is unlikely to land.
- 3 sale attempts since 3y ago with the ask held roughly flat each time — persistent listings suggest the price (not the market) is what's stuck; bring a comps-based counter.
- Current owner paid $60k; 15% above their basis — modest negotiation headroom, anchor on the comps not their cost.
Questions for the listing agent
- Built in 1962 — when were the roof, HVAC, electrical panel, plumbing, and water heater last replaced?
- Is there a deadline driving the sale (1031 exchange, divorce, estate, relocation)? That informs how much negotiation room exists.
- Schools are F-rated, which usually means shorter tenancies and higher turnover. Who's the typical renter profile here, and what's been the actual vacancy rate?
- Crime grade is F in this area — have there been break-ins, vandalism, or insurance claims at this property in the last 3 years? What carrier currently insures it and at what premium?
- What's the average days-on-market for RENTAL listings here right now (not sales)? A rising rental-DOM trend means longer vacancies and softer asking-rent achievability than the comps imply.
- What's the recent tenant-quality profile in this submarket — average credit score on applications, eviction rate, late-payment / NSF rate, and stable-employment percentage? A property-management company in the area should have these aggregated.
- How much new for-sale + rental construction is in the pipeline within 1–3 miles? Heavy new supply typically softens prices + rents 12–24 months out; constrained supply supports both.
Investment metrics
- 1% rule
- 1.87% ✓
- Cap rate
- 15.98%
- Cash-on-cash
- 34.59%
- DSCR
- 2.54
- GRM
- 4.5
CMA / ARV
- ARV (median comp)
- $91,693
- List price
- $69,000
- Delta
- -24.75%
- Verdict
- UNDERPRICED
- Comps
- 20 within 1.0 mi
Show comp detail 10 sales within ~0.75 mi
| Address | Dist | Beds/Ba | Sqft | Sold | Price | $/sf | Match |
|---|---|---|---|---|---|---|---|
| 75 Whippoorwill Dr | 0.00mi | 3/1.0 | 1,192 (-1%) | 1mo | $60,000 | $50 | 98 |
| 3604 Hummingbird Drs | 0.14mi | 3/1.5 | 1,200 (0%) | 0mo | $111,000 | $93 | 91 |
| 78 Oriole Dr | 0.05mi | 3/1.0 | 1,173 (-2%) | 17mo | $100,000 | $85 | 79 |
| 3488 Dove Dr | 0.24mi | 3/2.0 | 1,218 (+2%) | 13mo | $57,000 | $47 | 72 |
| 56 Whippoorwill Dr | 0.08mi | 3/1.0 | 1,094 (-9%) | 12mo | $99,897 | $91 | 72 |
| 22 Tanager Dr | 0.12mi | 3/1.0 | 1,108 (-8%) | 16mo | $30,000 | $27 | 69 |
| 3480 Plover Dr | 0.29mi | 3/2.0 | 1,195 (-0%) | 20mo | $131,000 | $110 | 65 |
| 3484 Monarch Dr | 0.34mi | 3/2.0 | 1,220 (+2%) | 18mo | $90,000 | $74 | 63 |
| 3379 E Condor Dr | 0.39mi | 3/2.0 | 1,141 (-5%) | 13mo | $128,000 | $112 | 59 |
| 3278 E Dove Dr | 0.33mi | 4/1.0 (+1) | 1,365 (+14%) | 11mo | $117,000 | $86 | 48 |
Match score weights: distance 35% · size 25% · config 20% · recency 20%. Top-matched comps best support the ARV.
Projected returns pro-forma
-2.21% appreciation · 3.0% rent growth · sell at horizon
- IRR
- 31.5%
- Equity multiple
- 2.38×
- Total profit
- $26,595
- Equity at exit
- $12,729
- IRR
- 37.7%
- Equity multiple
- 4.67×
- Total profit
- $70,899
- Equity at exit
- $10,244
Cash invested: $19,320 (down + closing). Projections, not guarantees.
Landlord ↔ Tenant lean methodology
- Overall (STATE)
- 43 Moderately Tenant-Leaning
- State Illinois
- 43 Moderately Tenant-Leaning · D+7
- County
- — inherits STATE
- City
- — inherits STATE
ZIP-level market 62526
- Home prices YoY
- -1.2%
- Active inventory
- 136
- Price-to-rent
- 4.5×
Monthly cashflow live
- Estimated rent
- $1,289 medium interval (Pro) →
- Mortgage (P&I)
- −$362
- Tax from tax record
- −$71 /mo · $849/yr
- Insurance
- −$29
- HOA
- −$0
- Vacancy / Maint / Mgmt
- −$271
- Net cashflow
- $557
Break-even live
Sensitivity live
| Price | -10% $596 | -5% $576 | +0% $557 | +5% $537 | +10% $518 |
|---|---|---|---|---|---|
| Rent | -10% $455 | -5% $506 | +0% $557 | +5% $608 | +10% $659 |
| Rate | -1.0pp $592 | -0.5pp $574 | base $557 | +0.5pp $539 | +1.0pp $521 |
UW: 25.0% down · 7.5% · 30yr · 1.5% tax · 5.0% vac · 8.0% maint · 8.0% mgmt
Financing live
Cash to close
- Down payment
- $17,250
- Closing costs
- $2,070
- Reserves months
- —
- Total cash needed
- —
Loan-product check · same deal, 3 products live
Conventional
25% down · 7.5% · 30yr
- Down + closing
- —
- Monthly P&I
- —
- Monthly cashflow
- —
- DSCR
- —
- Eligible?
- —
Personal DTI + credit; lowest rate.
DSCR
20% down · 8.5% · 30yr
- Down + closing
- —
- Monthly P&I
- —
- Monthly cashflow
- —
- DSCR
- —
- Eligible?
- —
No personal income docs; deal must DSCR.
Hard money
10% down · 12.0% · 12mo
- Down + closing
- —
- Monthly P&I
- —
- Monthly cashflow
- —
- DSCR
- —
- Eligible?
- —
Short-term bridge; refi at stabilization.
Rent comps 2 comps
| Address | Beds | Baths | Sqft | Rent | $/sqft | DOM | Units | Dist |
|---|---|---|---|---|---|---|---|---|
| 4145 N Camelot Dr Decatur, IL | 4.0 | 1.5 | 1449 | $1,400 | $0.97 | 23d | 1 | 1.15mi |
| 1350 E Wellington Way Unit 1330-3A Decatur, IL | 2.0 | 1.0 | 858 | $825 | $0.96 | 45d | 1 | 1.26mi |
Listing history 7 events
-
2026-05-18status Pending 400-char remark
-
2026-05-07$69,000 Active 400-char remark
-
2023-02-28status Pending
-
2023-02-28status Pending
-
2023-02-24historical
-
2023-02-10Active
-
2023-02-10$66,000 Active
ⓘ Source: listings_history table (triggers on properties + properties_extension) + one-shot
backfill from property_details.listing_events for pre-trigger history.
Tax reassessment forecast IL · Partial reset (capped growth)
- Current annual tax
- $849 · $71/mo
- Projected year-2 tax
- $1,208 · $101/mo
- Expected delta
- +$359/yr (+$30/mo · 42.3%)
ⓘ Screening estimate from a state-policy table — verify with the county assessor before closing.
Climate risk First Street
- Flood 1/10 Low FEMA zone X (unshaded) · 0% chance over 30 yrs
- Wildfire 1/10 Low
- Heat 3/10 Moderate 7 d/yr ≥106°F today · 19 d/yr by 30 yrs out
- Wind 2/10 Low 2% chance of damaging wind over 30 yrs
- Air quality 2/10 Low 1 unhealthy d/yr today · 1 by 30 yrs out
Nearby sold comps map
Loading sold comps map…
Walkable amenities ~0.75 mi
Loading nearby amenities…
Taxation est. · year 1
- Rental income
- $15,468
- − Mortgage interest
- −$3,865
- − Property taxes
- −$849
- − Insurance
- −$345
- − Repairs & maintenance
- −$1,237
- − Management
- −$1,237
- − Depreciation
- −$2,007
- Taxable income
- $5,927
- Est. tax owed @ 24.0%
- −$1,422
- After-tax cash flow
- $5,261/yr
For passive investors: Depreciation is non-cash, so a rental often shows a tax loss while cash-flowing — sheltering income. Rental losses are passive: they offset passive income freely, and up to $25,000/yr can offset ordinary (W-2) income if you actively participate and your MAGI is under $100k (phasing out to $0 by $150k); unused losses carry forward. On sale, claimed depreciation is recaptured at up to 25%, and gains may owe capital-gains tax (a 1031 exchange can defer both). Figures are a year-1 estimate at your 24.0% rate — not tax advice; consult a CPA.
Schools (NCES district)
- District
- Decatur SD 61
- NCES district ID
- 1711850
- Math proficiency
- 3% ▼ -4.00%
- Reading proficiency
- 6% ▼ -6.00%
- Median HH income
- $38,864
- Composite
- 3.99/100
- National rank
- #10059
- State rank
- #605 of 620 in IL
Livability — Decatur
- Score
- 59/100
- State rank
- #1076
- US rank
- #20533
Category grades
Schools grade is shown separately in the Schools card above.
Census & demographics
- Census place
- Decatur, IL
- County
- Macon County · 78,333 people
- City population
- 78,333
- Metro
- Decatur, IL
- Population (ZIP)
- 30,483
- Household income
- $49,062
- Rent vs Own
- Severe rent burden
- 1041.0
Population outlook (Macon County) Hauer SSP2
- Today (2025)
- 99,568 people
- By 2030
- 94,973 · -4.6%
- By 2040
- 85,250 · -14.4%
- By 2050
- 75,920 · -23.8%
- By 2075
- 55,962 · -43.8%
- By 2100
- 36,468 · -63.4%
Race, ethnicity, and origin ACS 2023
- Neighborhood character
- Predominantly White (68%)
- Race & ethnicity
- White 68% Black 22% Two or more races 6% Hispanic / Latino 3% Asian 2%
- Common ancestry
- Lithuanian 2% Italian 2% Slovak 2%
- Foreign-born
- 4% · Canada
- Languages at home
- 95% English-only · Spanish 2% Other Indo-European 1%
Political lean MEDSL · Macon
- 2024 margin
- R (+18.9) · D 39.8% · R 58.7% · Other 1.4%
- 2008→2024 swing
- -20.0pp toward R · 2008: 1.1pp · 2024: -18.9pp
- All cycles
- 2024: R+18.9 2020: R+17.7 2016: R+18.1 2012: R+5.2 2008: D+1.1
Not yet ingested
- Civics
- —
Market trends
- HPI YoY
- ▼ -2.21%
- Current HPI
- 182.871
- Rent YoY
- —
- Metro
- Decatur, IL
- State GDP YoY
- ▲ 1.59%
- F500 in state
- 60
Industry mix (Fortune 500 HQ in IL)
| Industry | F500 HQs | Revenue |
|---|---|---|
| Insurance | 4 | $201B |
|
||
| Consumer Goods | 4 | $87B |
|
||
| Industrial Machinery | 3 | $64B |
|
||
| Healthcare | 2 | $55B |
|
||
| Retail / Pharmacy | 1 | $148B |
|
||
| Agriculture / Food | 1 | $86B |
|
||
Price history
-9.1% since first listed9 events — show timeline
- 2026-06-04 Sold (Public Records) $60,000 Public Records
- 2026-06-01 Sold (MLS) $60,000 CIBR
- 2026-05-18 Pending — CIBR
- 2026-05-07 Listed $69,000 CIBR
- 2023-02-28 Pending — MRED as Distributed by MLS Grid
- 2023-02-28 Pending — CIBR
- 2023-02-24 Listing Removed — MRED as Distributed by MLS Grid
- 2023-02-10 Listed $66,000 CIBR
- 2023-02-10 Listed — MRED as Distributed by MLS Grid
Property tax history
-4.0%/yrLatest (2024): $849 · -34.6% YoY. Source: county tax records.
Cash-flow waterfall
monthlySold comps — $/sqft
last 12 mo · ≤1 miLoading sold comps…