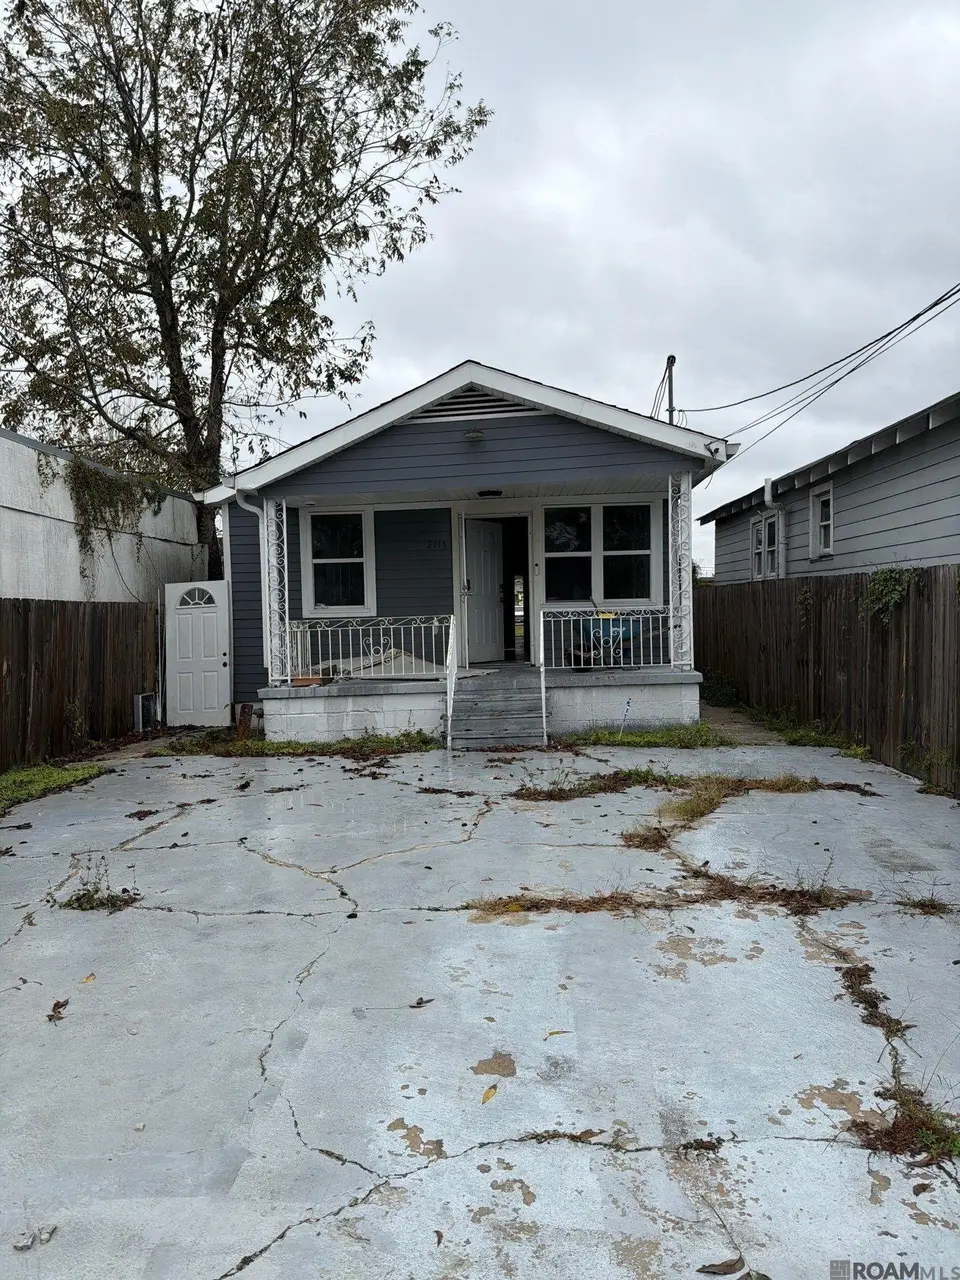
2115 N Rocheblave St · New Orleans, LA
Flood risk 8/10 · Major
- FEMA flood zone
- X (shaded)
- Chance of flooding over 30 yrs
- 0.78%
- Est. flood insurance / yr
- $507 – $1,088
Fire risk 1/10 · Minimal
- Est. fire insurance / yr
- $1,269 – $2,357
Heat risk 10/10 · Severe
- Hot days now (above 108°F)
- 7 days/yr
- Hot days in 30 yrs
- 21 days/yr
Wind risk 10/10 · Severe
- Chance of severe wind over 30 yrs
- 99.0%
Air-quality risk 4/10 · Minor
- Unhealthy air days now
- 4 days/yr
- Unhealthy air days in 30 yrs
- 4 days/yr
Risk factors via First Street. Map © Google.
Why this score? — see what drove the B- grade
The composite is a weighted blend of 9 inputs, each scored 0–100. Each bar is that input's sub-score; the figure is the points it added to the 100-point composite (weight × sub-score).
- Cash flow +30.0/30.0
- 1% rule +10.0/10.0
- DSCR +10.0/10.0
- ARV discount +7.5/15.0
- Livability +4.0/5.0
- Rent growth +2.5/5.0
- Condition / age +2.5/5.0
- Schools +1.6/10.0
- Appreciation +0.0/10.0
$45,900
🖨 Deal sheet (PDF) 📄 Offer letter ✓ Due diligence
Listing remarks MLS
Excellent opportunity to own a 3-bedroom, 2-bath Cottage located just minutes from the French Quarter and Downtown CBD. This property offers strong upside potential in a highly desirable area. The home has experienced fire damage limited to a portion of the structure, with the remaining areas primarily affected by smoke damage. Property is situated in a secluded setting, providing added privacy while maintaining close proximity to dining, entertainment, and major employment centers. Ideal for investors, rehabbers, or owner-occupants looking to renovate and add value. Property is being sold as-is, where-is, with no repairs to be made by the seller.
Key facts
- French quarter
- Downtown cbd
- Cottage
Tags
Neighborhood map
What this means for you Summary
Snapshot
- This is a 3-bed/2.0-bath single-family listed at $46k.
Deal economics
- At list price, monthly cash flow is $765 ($9k/yr) — positive.
- The deal already cash-flows at list — no discount required.
- Meets the 1% rule at list price ($2k rent vs $46k).
- Recommended offer: $40k (12.0% below list) — sets the bar for market timing.
- Cap rate 28.0% vs local median 4.4% in New Orleans — top-decile yield for the area; either an underpriced asset or a hidden risk that comps aren't pricing in. Stress-test before assuming the spread holds.
Location & tenants
- Location reads 81/100 on livability (#3 in LA, #1,383 nationally) — a professional / high-income tenant draw. Strengths: amenities A+, commute A+, health & safety A+; Watch: crime C-, employment D.
- Orleans Parish (urban): math 11% / reading 27% proficiency, ranked #69 of 98 in LA (top 70%) — low school quality limits family demand, transient renter base, plan for 1-2y turnover; 68% free/reduced lunch — lower-income household profile, screen leases tightly.
- Market conditions: Rents soft (-0.2%/yr); 381 active listings in the ZIP; 40 comparable units currently listed for rent nearby; rentals at typical pace (median 21d on market — plan ~3-4 weeks tenant-placement turnaround); 710 units permitted in Orleans Parish in 2024 (244 in 5+ unit buildings).
- This rent runs 35% of the median local income ($53k/yr) — at the standard rent-burdened threshold; future hikes will face affordability resistance.
Forward outlook
- Local home prices are declining (-3.0%/yr); year-one equity from $317 of loan paydown is wiped out by about $1k of value loss. Plan a longer hold.
- Orleans County population projected at +61% by 2050 — long-run rental-demand tailwind backs the buy-and-hold thesis.
- At projected returns (-3.0% appreciation + 0.0% rent growth), your $13k cash investment doubles in ~2 years — after that, you're playing with house money.
Negotiation context
- It's been on market 165 days — a 12% lower offer ($40k) is reasonable based on typical stale-listing flexibility.
- 7 sale attempts since 9y ago; this cycle's ask has dropped $4k (8%) from the opening price — seller is motivated, your offer sets the floor, not the list.
Risks & watch-outs
- Watch-outs: property tax is 3.7% of price; flood insurance adds $66/mo.
- Climate carrying-cost: severe flood risk; severe wind risk, 99% chance of damaging wind over 30y; extreme-heat days projected 7→21/yr by 2055 (HVAC capex compounding) — expect insurance premiums to compound above CPI over the hold.
Questions for the listing agent
- It's been on market 165 days. Have you received any prior offers? Is the seller open to a 12% concession, seller financing, or rate buy-down credit?
- Built in 1960 — when were the roof, HVAC, electrical panel, plumbing, and water heater last replaced?
- Property tax is high relative to price — has the assessment been appealed recently, and will the sale trigger a re-assessment?
- What's the actual annual flood-insurance premium (NFIP or private), and is the property in a SFHA with mandatory coverage?
- Why hasn't it sold? Are there any deal-killer items the seller is aware of (foundation, flood, title, zoning, code violations)?
- Is there a deadline driving the sale (1031 exchange, divorce, estate, relocation)? That informs how much negotiation room exists.
- What's the average days-on-market for RENTAL listings here right now (not sales)? A rising rental-DOM trend means longer vacancies and softer asking-rent achievability than the comps imply.
- What's the recent tenant-quality profile in this submarket — average credit score on applications, eviction rate, late-payment / NSF rate, and stable-employment percentage? A property-management company in the area should have these aggregated.
- How much new for-sale + rental construction is in the pipeline within 1–3 miles? Heavy new supply typically softens prices + rents 12–24 months out; constrained supply supports both.
Investment metrics
- 1% rule
- 3.40% ✓
- Cap rate
- 28.03%
- Cash-on-cash
- 77.62%
- DSCR
- 4.45
- GRM
- 2.5
CMA / ARV
- ARV (median comp)
- $176,353
- List price
- $45,900
- Delta
- -73.97%
- Verdict
- UNDERPRICED
- Comps
- 20 within 1.0 mi
Show comp detail 12 sales within ~0.75 mi
| Address | Dist | Beds/Ba | Sqft | Sold | Price | $/sf | Match |
|---|---|---|---|---|---|---|---|
| 2215 Mandeville St | 0.37mi | 3/2.0 | 1,067 (+2%) | 3mo | $85,000 | $80 | 78 |
| 1714 Aubry St | 0.48mi | 3/1.0 | 1,008 (-4%) | 3mo | $73,000 | $72 | 64 |
| 2227 D'abadie St | 0.59mi | 3/2.0 | 1,080 (+3%) | 7mo | $215,000 | $199 | 62 |
| 2037 Saint Anthony St | 0.25mi | 2/1.0 (-1) | 960 (-9%) | 4mo | $126,000 | $131 | 62 |
| 1744 Duels St | 0.52mi | 3/1.0 | 1,141 (+9%) | 1mo | $138,000 | $121 | 57 |
| 2618 N Rocheblave St | 0.57mi | 3/2.0 | 1,168 (+11%) | 1mo | $115,000 | $98 | 54 |
| 1601 Mandeville St | 0.66mi | 3/1.0 | 1,118 (+6%) | 2mo | $155,000 | $139 | 53 |
| 2633 New Orleans St | 0.35mi | 3/1.0 | 925 (-12%) | 12mo | $45,000 | $49 | 50 |
| 2116 New Orleans St | 0.37mi | 2/2.0 (-1) | 1,156 (+10%) | 15mo | $90,000 | $78 | 48 |
| 2436 Republic St | 0.55mi | 2/2.5 (-1) | 1,157 (+10%) | 8mo | $258,000 | $223 | 44 |
| 2423 Arts St | 0.61mi | 2/1.0 (-1) | 896 (-15%) | 13mo | $95,000 | $106 | 27 |
| 1714 N Broad St | 0.75mi | 2/3.0 (-1) | 912 (-13%) | 10mo | $245,000 | $269 | 26 |
Match score weights: distance 35% · size 25% · config 20% · recency 20%. Top-matched comps best support the ARV.
Projected returns pro-forma
-3.0% appreciation · 0.0% rent growth · sell at horizon
- IRR
- 67.2%
- Equity multiple
- 3.86×
- Total profit
- $36,820
- Equity at exit
- $6,844
- IRR
- 70.4%
- Equity multiple
- 7.04×
- Total profit
- $77,587
- Equity at exit
- $3,969
Cash invested: $12,852 (down + closing). Projections, not guarantees.
Landlord ↔ Tenant lean methodology
- Overall (STATE)
- 90 Strongly Landlord-Friendly
- State Louisiana
- 90 Strongly Landlord-Friendly · R+12
- County
- — inherits STATE
- City
- — inherits STATE
ZIP-level market 70119
- Home prices YoY
- -34.8%
- Rents YoY
- -0.2%
- Active inventory
- 381
- Price-to-rent
- 2.5×
Monthly cashflow live
- Estimated rent
- $1,561 high interval (Pro) →
- Mortgage (P&I)
- −$241
- Tax from tax record
- −$142 /mo · $1,701/yr
- Insurance
- −$19
- Flood insurance flood zone
- −$66 /mo · $798/yr
- HOA
- −$0
- Vacancy / Maint / Mgmt
- −$328
- Net cashflow
- $765
Break-even live
Sensitivity live
| Price | -10% $791 | -5% $778 | +0% $765 | +5% $752 | +10% $739 |
|---|---|---|---|---|---|
| Rent | -10% $642 | -5% $703 | +0% $765 | +5% $827 | +10% $888 |
| Rate | -1.0pp $788 | -0.5pp $777 | base $765 | +0.5pp $753 | +1.0pp $741 |
UW: 25.0% down · 7.5% · 30yr · 1.5% tax · 5.0% vac · 8.0% maint · 8.0% mgmt
Financing live
Cash to close
- Down payment
- $11,475
- Closing costs
- $1,377
- Reserves months
- —
- Total cash needed
- —
Loan-product check · same deal, 3 products live
Conventional
25% down · 7.5% · 30yr
- Down + closing
- —
- Monthly P&I
- —
- Monthly cashflow
- —
- DSCR
- —
- Eligible?
- —
Personal DTI + credit; lowest rate.
DSCR
20% down · 8.5% · 30yr
- Down + closing
- —
- Monthly P&I
- —
- Monthly cashflow
- —
- DSCR
- —
- Eligible?
- —
No personal income docs; deal must DSCR.
Hard money
10% down · 12.0% · 12mo
- Down + closing
- —
- Monthly P&I
- —
- Monthly cashflow
- —
- DSCR
- —
- Eligible?
- —
Short-term bridge; refi at stabilization.
Rent comps 40 comps
| Address | Beds | Baths | Sqft | Rent | $/sqft | DOM | Units | Dist |
|---|---|---|---|---|---|---|---|---|
| 3110 Pauger St New Orleans, LA | 2.0 | 2.0 | 992 | $1,300 | $1.31 | 24d | 1 | 0.05mi |
| 2434 Saint Anthony St New Orleans, LA | 2.0 | 1.0 | 768 | $1,300 | $1.69 | 15d | 1 | 0.11mi |
| 2432 Saint Anthony St New Orleans, LA | 2.0 | 1.0 | 768 | $1,300 | $1.69 | 15d | 1 | 0.11mi |
| 2311 Saint Anthony St Unit 1A New Orleans, LA | 2.0 | 1.0 | 1100 | $1,450 | $1.32 | 24d | 1 | 0.11mi |
| 2311 Saint Anthony St Unit 1B New Orleans, LA | 2.0 | 1.0 | 750 | $1,350 | $1.80 | 24d | 1 | 0.11mi |
| 2510 Saint Anthony St New Orleans, LA | 2.0 | 1.0 | 850 | $1,500 | $1.76 | 3d | 1 | 0.12mi |
| 2510 Saint Anthony St New Orleans, LA | 2.0 | 1.0 | 850 | $1,500 | $1.76 | 4d | 1 | 0.12mi |
| 2514 Saint Anthony St New Orleans, LA | 2.0 | 1.0 | 850 | $1,500 | $1.76 | 3d | 1 | 0.13mi |
| 2514 Saint Anthony St New Orleans, LA | 2.0 | 1.0 | 850 | $1,500 | $1.76 | 4d | 1 | 0.13mi |
| 2239 Saint Anthony St New Orleans, LA | 2.0 | 1.0 | 900 | $1,100 | $1.22 | 24d | 1 | 0.14mi |
| 2512 Elysian Fields Ave Unit 1 New Orleans, LA | 2.0 | 1.0 | 879 | $1,400 | $1.59 | 17d | 1 | 0.17mi |
| 2512 Elysian Fields Ave Unit C New Orleans, LA | 2.0 | 1.0 | 800 | $1,300 | $1.62 | 4d | 1 | 0.17mi |
| 2512 Elysian Fields Ave Unit C New Orleans, LA | 2.0 | 1.0 | 800 | $1,300 | $1.62 | 3d | 1 | 0.17mi |
| 2338 Annette St Unit 1 New Orleans, LA | 3.0 | 1.0 | 1150 | $1,400 | $1.22 | 20d | 1 | 0.19mi |
| 2048 Florida Ave New Orleans, LA | 2.0 | 1.0 | 1200 | $2,000 | $1.67 | 17d | 1 | 0.29mi |
| 2115 Elysian Fields Ave Unit 2115 New Orleans, LA | 3.0 | 1.0 | 1100 | $1,450 | $1.32 | 24d | 1 | 0.30mi |
| 1996 Hope St New Orleans, LA | 3.0 | 1.0 | 910 | $1,550 | $1.70 | 4d | 1 | 0.30mi |
| 2817 Annette St New Orleans, LA | 3.0 | 1.0 | 1100 | $1,350 | $1.23 | 24d | 1 | 0.33mi |
| 1922 Industry St Unit B New Orleans, LA | 2.0 | 2.0 | 963 | $1,325 | $1.38 | 2d | 1 | 0.36mi |
| 2305 A P Tureaud Ave Unit 2307 A P Tureaud New Orleans, LA | 3.0 | 2.0 | 700 | $2,112 | $3.02 | 24d | 1 | 0.37mi |
| 1933 Industry St New Orleans, LA | 3.0 | 2.0 | 1400 | $1,595 | $1.14 | 16d | 1 | 0.38mi |
| 1910 Elysian Fields Ave New Orleans, LA | 3.0 | 1.0 | 1000 | $1,450 | $1.45 | 24d | 1 | 0.39mi |
| 2115 Mandeville St New Orleans, LA | 3.0 | 2.0 | 1400 | $1,650 | $1.18 | 24d | 1 | 0.41mi |
| 2024 Mandeville St New Orleans, LA | 2.0 | 2.0 | 1072 | $1,950 | $1.82 | 24d | 1 | 0.42mi |
| 2109 A P Tureaud Ave New Orleans, LA | 2.0 | 1.0 | 936 | $1,450 | $1.55 | 15d | 1 | 0.43mi |
| 1810 Touro St New Orleans, LA | 2.0 | 1.0 | 700 | $1,140 | $1.63 | 24d | 1 | 0.43mi |
| 1776 N Miro St New Orleans, LA | 2.0 | 1.0 | 700 | $1,100 | $1.57 | 24d | 1 | 0.44mi |
| 2129 Spain St New Orleans, LA | 2.0 | 1.0 | 861 | $1,500 | $1.74 | 24d | 1 | 0.45mi |
| 2338 40 Annette St New Orleans, LA | 3.0 | 1.0 | 1150 | $1,385 | $1.20 | 21d | 1 | 0.45mi |
| 2406 Saint Roch Ave New Orleans, LA | 2.0 | 1.0 | 1000 | $1,600 | $1.60 | 17d | 1 | 0.45mi |
| 2220 N Prieur St New Orleans, LA | 3.0 | 2.0 | 1334 | $2,000 | $1.50 | 24d | 1 | 0.46mi |
| 2152 Abundance St Unit A New Orleans, LA | 3.0 | 1.0 | 800 | $1,599 | $2.00 | 4d | 1 | 0.46mi |
| 2152 Abundance St Unit 2152 New Orleans, LA | 3.0 | 2.0 | 1100 | $1,599 | $1.45 | 4d | 1 | 0.46mi |
| 2325 Florida Ave New Orleans, LA | 2.0 | 1.0 | 796 | $1,025 | $1.29 | 4d | 1 | 0.47mi |
| 2222 Saint Roch Ave New Orleans, LA | 3.0 | 1.0 | 900 | $1,200 | $1.33 | 24d | 1 | 0.47mi |
| 2423 Saint Roch Ave New Orleans, LA | 2.0 | 1.0 | 925 | $1,350 | $1.46 | 24d | 1 | 0.49mi |
| 2120 Saint Roch Ave Unit 2120 New Orleans, LA | 2.0 | 1.0 | 1000 | $1,650 | $1.65 | 24d | 1 | 0.49mi |
| 2134 Saint Roch Ave New Orleans, LA | 2.0 | 2.0 | 850 | $1,500 | $1.76 | 17d | 1 | 0.49mi |
| 2269 N Prieur St New Orleans, LA | 2.0 | 1.0 | 756 | $1,250 | $1.65 | 24d | 1 | 0.49mi |
| 2310 George Nick Connor Dr New Orleans, LA | 3.0 | 2.0 | 1050 | $1,600 | $1.52 | 24d | 1 | 0.50mi |
Listing history 27 events
-
2026-06-18days on market $45,900 Active 165 DOM
-
2026-06-17days on market $45,900 Active 164 DOM
-
2026-06-16days on market $45,900 Active 163 DOM
-
2026-06-15days on market $45,900 Active 162 DOM
-
2026-06-13days on market $45,900 Active 160 DOM
-
2026-06-10days on market $45,900 Active 157 DOM
-
2026-06-09days on market $45,900 Active 156 DOM
-
2026-06-08days on market $45,900 Active 155 DOM
-
2026-06-07days on market $45,900 Active 154 DOM
-
2026-06-05days on market $45,900 Active 151 DOM
-
2026-06-03days on market $45,900 Active 150 DOM
-
2026-06-02days on market $45,900 Active 149 DOM
-
2026-06-01days on market $45,900 Active 148 DOM
-
2026-05-31days on market $45,900 Active 147 DOM
-
2026-01-29price $45,900 655-char remark
Show marketing remark (655 chars)
Excellent opportunity to own a 3-bedroom, 2-bath Cottage located just minutes from the French Quarter and Downtown CBD. This property offers strong upside potential in a highly desirable area. The home has experienced fire damage limited to a portion of the structure, with the remaining areas primarily affected by smoke damage. Property is situated in a secluded setting, providing added privacy while maintaining close proximity to dining, entertainment, and major employment centers. Ideal for investors, rehabbers, or owner-occupants looking to renovate and add value. Property is being sold as-is, where-is, with no repairs to be made by the seller.
-
2025-12-26$49,900 Active 655-char remark
Show marketing remark (655 chars)
Excellent opportunity to own a 3-bedroom, 2-bath Cottage located just minutes from the French Quarter and Downtown CBD. This property offers strong upside potential in a highly desirable area. The home has experienced fire damage limited to a portion of the structure, with the remaining areas primarily affected by smoke damage. Property is situated in a secluded setting, providing added privacy while maintaining close proximity to dining, entertainment, and major employment centers. Ideal for investors, rehabbers, or owner-occupants looking to renovate and add value. Property is being sold as-is, where-is, with no repairs to be made by the seller.
-
2023-08-08price $175,000
-
2023-07-01$175,000
-
2023-01-30historical
-
2022-12-22$109,900 Active
-
2022-12-22$109,900
-
2017-11-06historical
-
2017-10-18status Under Contract
-
2017-07-05$85,000 Active
-
2017-07-05$85,000
ⓘ Source: listings_history table (triggers on properties + properties_extension) + one-shot
backfill from property_details.listing_events for pre-trigger history.
Tax reassessment forecast LA · Resets to sale price
- Current annual tax
- $1,701 · $142/mo
- Projected year-2 tax
- $1,701 · $142/mo
- Expected delta
- $0/yr ($0/mo · -0.0%)
ⓘ Screening estimate from a state-policy table — verify with the county assessor before closing.
Climate risk First Street
- Flood 8/10 Severe FEMA zone X (shaded) · 78% chance over 30 yrs
- Wildfire 1/10 Low
- Heat 10/10 Extreme 7 d/yr ≥108°F today · 21 d/yr by 30 yrs out
- Wind 10/10 Extreme 99% chance of damaging wind over 30 yrs
- Air quality 4/10 Moderate 4 unhealthy d/yr today · 4 by 30 yrs out
Nearby sold comps map
Loading sold comps map…
Walkable amenities ~0.75 mi
Loading nearby amenities…
Taxation est. · year 1
- Rental income
- $18,727
- − Mortgage interest
- −$2,571
- − Property taxes
- −$1,701
- − Insurance
- −$1,027
- − Repairs & maintenance
- −$1,498
- − Management
- −$1,498
- − Depreciation
- −$1,335
- Taxable income
- $9,097
- Est. tax owed @ 24.0%
- −$2,183
- After-tax cash flow
- $6,995/yr
For passive investors: Depreciation is non-cash, so a rental often shows a tax loss while cash-flowing — sheltering income. Rental losses are passive: they offset passive income freely, and up to $25,000/yr can offset ordinary (W-2) income if you actively participate and your MAGI is under $100k (phasing out to $0 by $150k); unused losses carry forward. On sale, claimed depreciation is recaptured at up to 25%, and gains may owe capital-gains tax (a 1031 exchange can defer both). Figures are a year-1 estimate at your 24.0% rate — not tax advice; consult a CPA.
Schools (NCES district)
- District
- Orleans Parish
- NCES district ID
- 2201170
- Math proficiency
- 11% ▼ -52.00%
- Reading proficiency
- 27% ▼ -46.00%
- Median HH income
- $37,011
- Composite
- 15.78/100
- National rank
- #9271
- State rank
- #69 of 98 in LA
Livability — New Orleans
- Score
- 81/100
- State rank
- #3
- US rank
- #1383
Category grades
Schools grade is shown separately in the Schools card above.
Census & demographics
- Census place
- New Orleans, LA
- County
- Orleans Parish · 338,817 people
- City population
- 338,817
- Metro
- New Orleans-Metairie, LA
- Population (ZIP)
- 37,253
- Household income
- $53,143
- Rent vs Own
- Severe rent burden
- 3381.0
Population outlook (Orleans County) Hauer SSP2
- Today (2025)
- 513,025 people
- By 2030
- 575,781 · +12.2%
- By 2040
- 700,174 · +36.5%
- By 2050
- 826,541 · +61.1%
- By 2075
- 1,123,374 · +119.0%
- By 2100
- 1,355,609 · +164.2%
Race, ethnicity, and origin ACS 2023
- Neighborhood character
- Diverse neighborhood (Simpson 0.64)
- Race & ethnicity
- Black 44% White 40% Two or more races 10% Hispanic / Latino 9% Asian 1%
- Hispanic origin (detail)
- Mexican 2%
- Common ancestry
- Lithuanian 8% Slovak 2% Romanian 1%
- Foreign-born
- 6% · Canada, Jamaica
- Languages at home
- 91% English-only · Spanish 6% French/Haitian/Cajun 1% Other Indo-European 0%
Political lean MEDSL · Orleans
- 2024 margin
- Solid D (+67.0) · D 82.2% · R 15.2% · Other 2.7%
- 2008→2024 swing
- +6.7pp toward D · 2008: 60.3pp · 2024: 67.0pp
- All cycles
- 2024: D+67.0 2020: D+68.2 2016: D+66.2 2012: D+62.5 2008: D+60.3
Not yet ingested
- Civics
- —
Market trends
- HPI YoY
- ▼ -135.38%
- Current HPI
- 253.1929
- Rent YoY
- ▼ -0.20%
- Metro
- New Orleans-Metairie, LA
- State GDP YoY
- ▲ 3.29%
- F500 in state
- 10
Industry mix (Fortune 500 HQ in LA)
| Industry | F500 HQs | Revenue |
|---|---|---|
| Telecommunications | 2 | $23B |
|
||
| Utilities | 1 | $12B |
|
||
| Wholesale / Distribution | 1 | $5B |
|
||
| Advertising | 1 | $2B |
|
||
Price history
-46.0% since first listed13 events — show timeline
- 2026-01-29 Price Changed $45,900 AcadianaMLS
- 2026-01-29 Price Changed $45,900 GBRMLS
- 2025-12-26 Listed $49,900 GBRMLS
- 2025-12-26 Listed $49,900 AcadianaMLS
- 2023-08-08 Price Changed $175,000 GSREIN
- 2023-07-01 Listed $175,000 AcadianaMLS
- 2023-01-30 Delisted — GBRMLS
- 2022-12-22 Listed $109,900 AcadianaMLS
- 2022-12-22 Listed $109,900 GBRMLS
- 2017-11-06 Listing Removed — GSREIN
- 2017-10-18 Pending — GSREIN
- 2017-07-05 Listed $85,000 GSREIN
- 2017-07-05 Listed $85,000 AcadianaMLS
Property tax history
+18.6%/yrLatest (2026): $1,701 · +1.1% YoY. Source: county tax records.
Cash-flow waterfall
monthlySold comps — $/sqft
last 12 mo · ≤1 miLoading sold comps…