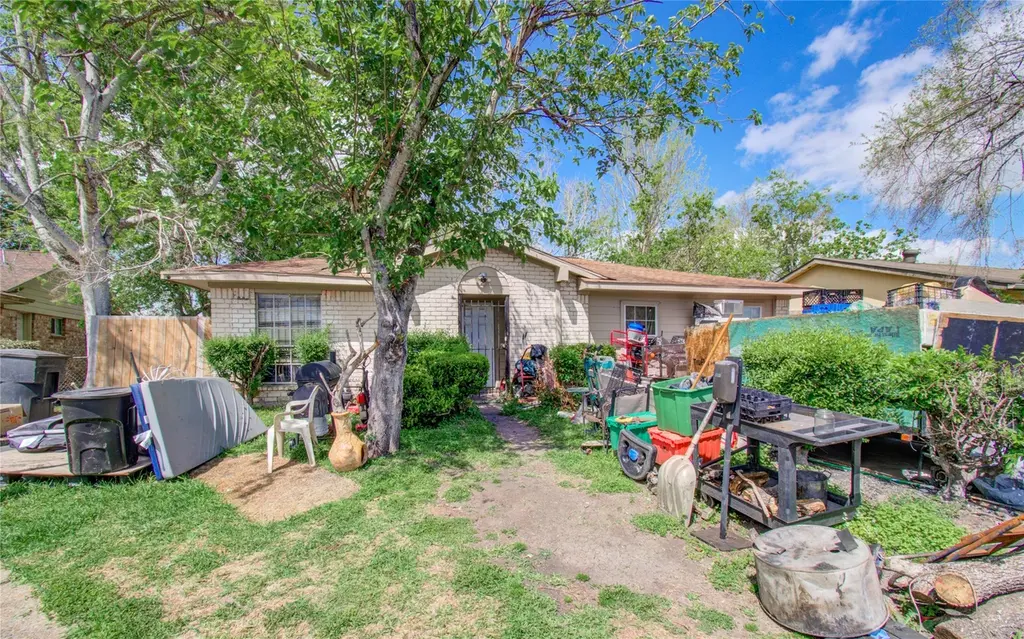
5011 Cresthaven Cir · Houston, TX
Flood risk 4/10 · Minor
- FEMA flood zone
- X (shaded)
- Chance of flooding over 30 yrs
- 0.22%
- Est. flood insurance / yr
- $507 – $1,088
Fire risk 1/10 · Minimal
- Est. fire insurance / yr
- $1,222 – $2,270
Heat risk 9/10 · Severe
- Hot days now (above 109°F)
- 7 days/yr
- Hot days in 30 yrs
- 24 days/yr
Wind risk 9/10 · Severe
- Chance of severe wind over 30 yrs
- 99.0%
Air-quality risk 2/10 · Minimal
- Unhealthy air days now
- 2 days/yr
- Unhealthy air days in 30 yrs
- 2 days/yr
Risk factors via First Street. Map © Google.
Why this score? — see what drove the C grade
The composite is a weighted blend of 9 inputs, each scored 0–100. Each bar is that input's sub-score; the figure is the points it added to the 100-point composite (weight × sub-score).
- Cash flow +17.8/30.0
- ARV discount +12.1/15.0
- Appreciation +6.3/10.0
- 1% rule +5.7/10.0
- DSCR +5.6/10.0
- Livability +3.7/5.0
- Rent growth +2.8/5.0
- Schools +2.7/10.0
- Condition / age +2.5/5.0
$149,000
🖨 Deal sheet (PDF) 📄 Offer letter ✓ Due diligence
Listing remarks
* * No HOA * * Welcome to 5011 Cresthaven Cir; a 4-bedroom, 2.5-bath home offering 1,447 SF of functional living space on a 6,099 SF lot in a cul-de-sac. This property is currently tenant-occupied, providing immediate rental income potential. The home features a practical layout and presents an opportunity for renovation to enhance overall condition and value. Located in an established area with steady rental demand, this property offers both stability and future upside. Comparable properties in the area indicate potential for increased value with improvements, making this a strong option for buyers seeking an income-producing property with value-add potential.
Key facts
- Established area
- Cul-de-sac
- No hoa
Tags
Property features AI
Finance
- Financial info: Lease not considered
Exterior
- Parking: Additional parking available
- Utilities: Public water; Public sewer
- Home design: Residential property; Faces south; One-story; Entry level: first floor
- Construction: Brick construction; Composition roof; Slab foundation; Built in 1971
- Exterior features: Cul-de-sac lot
Interior
- Kitchen: Gas range
- Bedrooms: Primary bedroom on first floor (16 x 13); Additional bedrooms on first floor (11 x 12; 13 x 9; 9 x 13)
- Flooring: Concrete; Vinyl
- Bathrooms: Two full bathrooms; One half bathroom
- Heating & cooling: Central heating (gas); Central electric air conditioning
- Interior features: Seller disclosure provided
- Laundry & utility: Washer hookup; Gas dryer hookup
Neighborhood map
What this means for you Summary
Snapshot
- This is a 3-bed/2.0-bath single-family listed at $149k.
Deal economics
- At list price, monthly cash flow is $124 ($1k/yr) — positive.
- The deal already cash-flows at list — no discount required.
- Meets the 1% rule at list price ($2k rent vs $149k).
- Cap rate 7.3% vs local median 3.2% in Houston — top-decile yield for the area; either an underpriced asset or a hidden risk that comps aren't pricing in. Stress-test before assuming the spread holds.
Location & tenants
- Location reads 74/100 on livability (#184 in TX, #4,771 nationally) — a middle-class / working-renter tenant base. Strengths: amenities A+, cost of living A+, housing A+; Watch: crime F.
- Houston ISD (urban): math 27% / reading 35% proficiency, ranked #593 of 826 in TX (top 72%) — families likely to look elsewhere, expect single-tenant / working-renter base with shorter leases; 71% free/reduced lunch — lower-income household profile, screen leases tightly.
- Zoned schools: Woodson School (math 17% / reading 22%, grade F, #3,583 of 4,322 statewide, top 86%, 572 students, 99% FRL); Thomas Middle (math 3% / reading 13%, grade F, #1,654 of 1,662 statewide, top 100%, 526 students, 98% FRL); Sterling H S (math 16% / reading 27%, grade F, #1,377 of 1,632 statewide, top 85%, 1,421 students, 92% FRL) — zoned schools average 96% FRL vs 71% district-wide (25 pts higher); higher-poverty schools than district average — tighter screening recommended.
- Zoned-school proficiency averages 16% at this address vs 31% district-wide (-15 pts) — the specific schools serving this property underperform the Houston ISD average; the district grade overstates school quality for this exact location.
- Market conditions: Rents rising (+1.2%/yr); 305 active listings in the ZIP; 25 comparable units currently listed for rent nearby; rentals leasing fast (median 13d on market — plan ~1-2 weeks tenant-placement turnaround); 29,883 units permitted in Harris County in 2024 (8,621 in 5+ unit buildings).
Forward outlook
- In year one you build about $5k of equity ($1k loan paydown + $4k appreciation (2.6% local appreciation)).
- Harris County population projected at +47% by 2050 — long-run rental-demand tailwind backs the buy-and-hold thesis.
- At projected returns (2.6% appreciation + 1.2% rent growth), your $42k cash investment doubles in ~6 years — after that, you're playing with house money.
- By year 7, paydown + projected appreciation supports a ~$31k cash-out refi (75% LTV) — recoverable capital for the next deal without selling this one.
Negotiation context
- Only 2 days on market — expect competitive offers; lowballing is unlikely to land.
- 2 sale attempts with the ask held roughly flat each time — persistent listings suggest the price (not the market) is what's stuck; bring a comps-based counter.
- Current owner paid $29k; list at $149k implies a 409% gain — meaningful room to come down on a strong offer.
Risks & watch-outs
- Climate carrying-cost: severe wind risk, 99% chance of damaging wind over 30y; extreme-heat days projected 7→24/yr by 2055 (HVAC capex compounding) — expect insurance premiums to compound above CPI over the hold.
Questions for the listing agent
- Built in 1971 — when were the roof, HVAC, electrical panel, plumbing, and water heater last replaced?
- Is there a deadline driving the sale (1031 exchange, divorce, estate, relocation)? That informs how much negotiation room exists.
- Schools are D-rated, which usually means shorter tenancies and higher turnover. Who's the typical renter profile here, and what's been the actual vacancy rate?
- Crime grade is F in this area — have there been break-ins, vandalism, or insurance claims at this property in the last 3 years? What carrier currently insures it and at what premium?
- What's the average days-on-market for RENTAL listings here right now (not sales)? A rising rental-DOM trend means longer vacancies and softer asking-rent achievability than the comps imply.
- What's the recent tenant-quality profile in this submarket — average credit score on applications, eviction rate, late-payment / NSF rate, and stable-employment percentage? A property-management company in the area should have these aggregated.
- How much new for-sale + rental construction is in the pipeline within 1–3 miles? Heavy new supply typically softens prices + rents 12–24 months out; constrained supply supports both.
Investment metrics
- 1% rule
- 1.07% ✓
- Cap rate
- 7.29%
- Cash-on-cash
- 3.55%
- DSCR
- 1.16
- GRM
- 7.8
CMA / ARV
- ARV (median comp)
- $165,937
- List price
- $149,000
- Delta
- -3.58%
- Verdict
- FAIR
- Comps
- 20 within 1.0 mi
Show comp detail 12 sales within ~0.75 mi
| Address | Dist | Beds/Ba | Sqft | Sold | Price | $/sf | Match |
|---|---|---|---|---|---|---|---|
| 5011 Brisbane Dr | 0.12mi | 3/2.0 | 1,049 (-2%) | 1mo | $110,000 | $105 | 90 |
| 11403 Mosscrest Dr | 0.10mi | 3/1.0 | 1,128 (+5%) | 6mo | $154,900 | $137 | 78 |
| 11423 Roandale Drive Dr | 0.14mi | 3/1.0 | 1,104 (+3%) | 12mo | $185,000 | $168 | 75 |
| 11822 Greenshire Dr | 0.36mi | 3/2.0 | 1,100 (+2%) | 11mo | $215,000 | $195 | 70 |
| 5150 Howcher St | 0.28mi | 3/2.0 | 1,192 (+11%) | 8mo | $135,000 | $113 | 63 |
| 4419 Botany Ln | 0.47mi | 3/2.0 | 1,173 (+9%) | 3mo | $190,000 | $162 | 60 |
| 4235 Dacca Dr | 0.66mi | 3/2.0 | 1,110 (+3%) | 4mo | $177,000 | $159 | 60 |
| 5107 Bungalow Ln | 0.32mi | 3/2.0 | 1,189 (+11%) | 10mo | $199,000 | $167 | 58 |
| 5223 Grace Point Ln | 0.48mi | 3/1.0 | 978 (-9%) | 1mo | $130,000 | $133 | 58 |
| 4414 Tavenor Ln | 0.50mi | 3/1.0 | 970 (-10%) | 3mo | $149,000 | $154 | 54 |
| 5319 Bungalow Ln | 0.57mi | 3/2.0 | 1,146 (+7%) | 11mo | $209,900 | $183 | 53 |
| 5135 Fairgreen Ln | 0.41mi | 3/1.0 | 938 (-13%) | 6mo | $151,500 | $162 | 51 |
Match score weights: distance 35% · size 25% · config 20% · recency 20%. Top-matched comps best support the ARV.
Projected returns pro-forma
2.61% appreciation · 1.17% rent growth · sell at horizon
- IRR
- 8.7%
- Equity multiple
- 1.48×
- Total profit
- $19,990
- Equity at exit
- $63,764
- IRR
- 10.4%
- Equity multiple
- 2.45×
- Total profit
- $60,478
- Equity at exit
- $95,824
Cash invested: $41,720 (down + closing). Projections, not guarantees.
Landlord ↔ Tenant lean methodology
- Overall (STATE)
- 87 Strongly Landlord-Friendly
- State Texas
- 87 Strongly Landlord-Friendly · R+5
- County
- — inherits STATE
- City
- — inherits STATE
ZIP-level market 77048
- Home prices YoY
- 1.0%
- Rents YoY
- 1.2%
- Active inventory
- 305
- Price-to-rent
- 7.8×
Monthly cashflow live
- Estimated rent
- $1,590 high interval (Pro) →
- Mortgage (P&I)
- −$781
- Tax from tax record
- −$289 /mo · $3,466/yr
- Insurance
- −$62
- HOA
- −$0
- Lot rent
- −$0
- Vacancy / Maint / Mgmt
- −$334
- Net cashflow
- $124
Break-even live
Sensitivity live
| Price | -10% $208 | -5% $166 | +0% $124 | +5% $81 | +10% $39 |
|---|---|---|---|---|---|
| Rent | -10% $-2 | -5% $61 | +0% $124 | +5% $186 | +10% $249 |
| Rate | -1.0pp $199 | -0.5pp $161 | base $124 | +0.5pp $85 | +1.0pp $46 |
UW: 25.0% down · 7.5% · 30yr · 1.5% tax · 5.0% vac · 8.0% maint · 8.0% mgmt
Financing live
Cash to close
- Down payment
- $37,250
- Closing costs
- $4,470
- Reserves months
- —
- Total cash needed
- —
Loan-product check · same deal, 3 products live
Conventional
25% down · 7.5% · 30yr
- Down + closing
- —
- Monthly P&I
- —
- Monthly cashflow
- —
- DSCR
- —
- Eligible?
- —
Personal DTI + credit; lowest rate.
DSCR
20% down · 8.5% · 30yr
- Down + closing
- —
- Monthly P&I
- —
- Monthly cashflow
- —
- DSCR
- —
- Eligible?
- —
No personal income docs; deal must DSCR.
Hard money
10% down · 12.0% · 12mo
- Down + closing
- —
- Monthly P&I
- —
- Monthly cashflow
- —
- DSCR
- —
- Eligible?
- —
Short-term bridge; refi at stabilization.
Rent comps 25 comps
| Address | Beds | Baths | Sqft | Rent | $/sqft | DOM | Units | Dist |
|---|---|---|---|---|---|---|---|---|
| 11319 Murr Way Houston, TX | 3.0 | 1.5 | 1213 | $1,699 | $1.40 | 21d | 1 | 0.12mi |
| 4322 Groton Dr Houston, TX | 3.0 | 1.0 | 858 | $1,395 | $1.63 | 46d | 1 | 0.52mi |
| 5426 Greylog Dr Houston, TX | 3.0 | 2.0 | 1205 | $1,750 | $1.45 | 26d | 1 | 0.70mi |
| 12227 Cape Hyannis Dr Houston, TX | 3.0 | 2.0 | 1432 | $1,705 | $1.19 | 16d | 1 | 0.73mi |
| 11819 Leitrim Way Houston, TX | 3.0 | 1.0 | 1476 | $1,150 | $0.78 | 7d | 1 | 0.76mi |
| 11911 Martin Luther King Junior Blvd Houston, TX | 1.0–2.0 | 1.0 | 701 | $1,050 | $1.50 | 10d | 1 | 0.79mi |
| 11917 Martin Luther King Blvd Houston, TX | 2.0 | 1.0 | 805 | $1,025 | $1.27 | 21d | 1 | 0.84mi |
| 11917 Martin Luther King Blvd Houston, TX | 2.0 | 1.0 | 805 | $1,025 | $1.27 | 24d | 1 | 0.84mi |
| 5602 Selinsky Rd Unit 2047 Houston, TX | 2.0 | 2.0 | 1062 | $1,113 | $1.05 | 5d | 1 | 0.89mi |
| 5602 Selinsky Rd Unit 2047 Houston, TX | 2.0 | 2.0 | 1062 | $1,114 | $1.05 | 1d | 1 | 0.89mi |
| 5602 Selinsky Rd Unit 3047 Houston, TX | 3.0 | 2.0 | 1167 | $1,324 | $1.13 | 13d | 1 | 0.89mi |
| 5602 Selinsky Rd Unit 421 Houston, TX | 2.0 | 2.0 | 1062 | $1,089 | $1.03 | 7d | 1 | 0.89mi |
| 5602 Selinsky Rd Unit 422 Houston, TX | 2.0 | 2.0 | 1062 | $1,089 | $1.03 | 10d | 1 | 0.89mi |
| 5602 Selinsky Rd Unit 510 Houston, TX | 3.0 | 2.0 | 1167 | $1,313 | $1.13 | 13d | 1 | 0.89mi |
| 5602 Selinsky Rd Unit 5659 Houston, TX | 2.0 | 2.0 | 1062 | $1,113 | $1.05 | 13d | 1 | 0.89mi |
| 5602 Selinsky Rd Unit 2187 Houston, TX | 2.0 | 2.0 | 1062 | $1,124 | $1.06 | 0d | 1 | 0.89mi |
| 5602 Selinsky Rd Unit 3187 Houston, TX | 3.0 | 2.0 | 1167 | $1,324 | $1.13 | 0d | 1 | 0.89mi |
| 5408 Groveton St Houston, TX | 4.0 | 2.0 | 1472 | $1,983 | $1.35 | 1d | 1 | 0.95mi |
| 4015 Marchant Rd Houston, TX | 3.0 | 2.0 | 1200 | $1,700 | $1.42 | 46d | 1 | 0.96mi |
| 10902 Faircroft Dr Houston, TX | 3.0 | 1.0 | 1308 | $1,455 | $1.11 | 1d | 1 | 0.99mi |
| 5425 E Orem Dr Houston, TX | 1.0–3.0 | 1.0–2.0 | 910 | $1,499 | $1.65 | 1d | 13 | 1.05mi |
| 4810 Wilmington St Unit A Houston, TX | 3.0 | 2.0 | 1165 | $1,650 | $1.42 | 46d | 1 | 1.36mi |
| 4918 Wilmington St Unit A Houston, TX | 3.0 | 3.0 | 1300 | $2,100 | $1.62 | 46d | 1 | 1.36mi |
| 9509 Merle St Unit 9509A Houston, TX | 4.0 | 2.5 | 1404 | $1,500 | $1.07 | 46d | 1 | 1.37mi |
| 3918 Almeda-Genoa Rd Houston, TX | 1.0–3.0 | 1.0–2.0 | 1038 | $2,220 | $2.14 | 1d | 26 | 1.46mi |
Listing history 5 events
-
2026-06-03days on market $149,000 Active 2 DOM
-
2026-06-02pricedays on market $149,000 Active 1 DOM
-
2026-03-29$160,000 Active 665-char remark
-
2019-06-12soldstatus
-
1997-06-16soldstatus $29,260
ⓘ Source: listings_history table (triggers on properties + properties_extension) + one-shot
backfill from property_details.listing_events for pre-trigger history.
Tax reassessment forecast TX · Resets to sale price
- Current annual tax
- $3,466 · $289/mo
- Projected year-2 tax
- $3,466 · $289/mo
- Expected delta
- $0/yr ($0/mo · 0.0%)
ⓘ Screening estimate from a state-policy table — verify with the county assessor before closing.
Climate risk First Street
- Flood 4/10 Moderate FEMA zone X (shaded) · 22% chance over 30 yrs
- Wildfire 1/10 Low
- Heat 9/10 Extreme 7 d/yr ≥109°F today · 24 d/yr by 30 yrs out
- Wind 9/10 Extreme 99% chance of damaging wind over 30 yrs
- Air quality 2/10 Low 2 unhealthy d/yr today · 2 by 30 yrs out
Nearby sold comps map
Loading sold comps map…
Walkable amenities ~0.75 mi
Loading nearby amenities…
Taxation est. · year 1
- Rental income
- $19,075
- − Mortgage interest
- −$8,346
- − Property taxes
- −$3,466
- − Insurance
- −$745
- − Repairs & maintenance
- −$1,526
- − Management
- −$1,526
- − Depreciation
- −$4,335
- Taxable loss
- −$868
- Est. tax savings @ 24.0%
- +$208
- After-tax cash flow
- $1,691/yr
For passive investors: Depreciation is non-cash, so a rental often shows a tax loss while cash-flowing — sheltering income. Rental losses are passive: they offset passive income freely, and up to $25,000/yr can offset ordinary (W-2) income if you actively participate and your MAGI is under $100k (phasing out to $0 by $150k); unused losses carry forward. On sale, claimed depreciation is recaptured at up to 25%, and gains may owe capital-gains tax (a 1031 exchange can defer both). Figures are a year-1 estimate at your 24.0% rate — not tax advice; consult a CPA.
Schools (NCES district)
- District
- Houston ISD
- NCES district ID
- 4823640
- Math proficiency
- 27% ▼ -18.00%
- Reading proficiency
- 35% ▼ -6.00%
- Median HH income
- $46,054
- Composite
- 26.63/100
- National rank
- #7173
- State rank
- #593 of 826 in TX
Livability — Houston
- Score
- 74/100
- State rank
- #184
- US rank
- #4771
Category grades
Schools grade is shown separately in the Schools card above.
Census & demographics
- Census place
- Houston, TX
- County
- Harris County · 4,702,590 people
- City population
- 3,226,434
- Metro
- Houston-The Woodlands-Sugar Land, TX
- Population (ZIP)
- 21,151
- Household income
- $56,747
- Rent vs Own
- Severe rent burden
- 1117.0
Population outlook (Harris County) Hauer SSP2
- Today (2025)
- 5,571,493 people
- By 2030
- 6,089,821 · +9.3%
- By 2040
- 7,142,806 · +28.2%
- By 2050
- 8,185,864 · +46.9%
- By 2075
- 10,574,329 · +89.8%
- By 2100
- 12,109,958 · +117.4%
Race, ethnicity, and origin ACS 2023
- Neighborhood character
- Predominantly Black (69%)
- Race & ethnicity
- Black 69% Hispanic / Latino 24% Two or more races 6% Asian 3% White 2%
- Hispanic origin (detail)
- Mexican 17% Puerto Rican 1%
- Foreign-born
- 12% · Canada, Vietnam
- Languages at home
- 76% English-only · Spanish 20% Tagalog/Filipino 2% Vietnamese 1%
Political lean MEDSL · Harris
- 2024 margin
- Lean D (+5.5) · D 52.0% · R 46.4% · Other 1.6%
- 2008→2024 swing
- +3.9pp toward D · 2008: 1.6pp · 2024: 5.5pp
- All cycles
- 2024: D+5.5 2020: D+13.3 2016: D+12.4 2012: D+0.1 2008: D+1.6
Not yet ingested
- Civics
- —
Market trends
- HPI YoY
- ▲ 2.61%
- Current HPI
- 266.4468
- Rent YoY
- ▲ 1.17%
- Metro
- Houston-The Woodlands-Sugar Land, TX
- State GDP YoY
- ▲ 3.95%
- F500 in state
- 110
Industry mix (Fortune 500 HQ in TX)
| Industry | F500 HQs | Revenue |
|---|---|---|
| Energy | 16 | $1,198B |
|
||
| Technology | 5 | $198B |
|
||
| Engineering / Construction | 4 | $72B |
|
||
| Energy Services | 3 | $60B |
|
||
| Utilities | 3 | $41B |
|
||
| Healthcare | 2 | $330B |
|
||
Price history
+409.2% since first listed7 events — show timeline
- 2026-06-03 Listing Removed — HARMLS
- 2026-06-01 Listed $149,000 HARMLS
- 2026-06-01 Coming Soon — HARMLS
- 2026-05-28 Listing Removed — HARMLS
- 2026-03-29 Listed $160,000 HARMLS
- 2019-06-12 Sold (Public Records) — Public Records
- 1997-06-16 Sold (Public Records) $29,260 Public Records
Property tax history
+7.5%/yrLatest (2025): $3,466 · +1.6% YoY. Source: county tax records.
Cash-flow waterfall
monthlySold comps — $/sqft
last 12 mo · ≤1 miLoading sold comps…