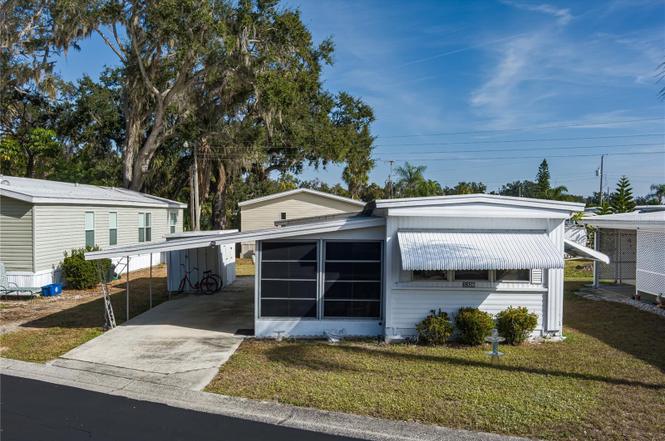
3326 Bernadette Dr · Bradenton, FL
Flood risk 1/10 · Minimal
- FEMA flood zone
- X (unshaded)
- Chance of flooding over 30 yrs
- 0.0%
- Est. flood insurance / yr
- $507 – $1,088
Fire risk 1/10 · Minimal
- Est. fire insurance / yr
- $947 – $1,759
Heat risk 10/10 · Severe
- Hot days now (above 107°F)
- 7 days/yr
- Hot days in 30 yrs
- 29 days/yr
Wind risk 10/10 · Severe
- Chance of severe wind over 30 yrs
- 99.0%
Air-quality risk 3/10 · Minor
- Unhealthy air days now
- 3 days/yr
- Unhealthy air days in 30 yrs
- 3 days/yr
Risk factors via First Street. Map © Google.
Why this score? — see what drove the B+ grade
The composite is a weighted blend of 9 inputs, each scored 0–100. Each bar is that input's sub-score; the figure is the points it added to the 100-point composite (weight × sub-score).
- Cash flow +30.0/30.0
- ARV discount +14.0/15.0
- 1% rule +10.0/10.0
- DSCR +10.0/10.0
- Schools +4.4/10.0
- Livability +4.0/5.0
- Rent growth +2.5/5.0
- Condition / age +2.5/5.0
- Appreciation +0.0/10.0
$65,000
🖨 Deal sheet 📄 Offer letter ✓ Due diligence
Listing remarks
Welcome to this charming one-bedroom, one-bath home located in the desirable Terra Siesta 55+ community. This pet-friendly residence features an additional living area that can easily be converted into a second bedroom, offering flexible living space. The home includes newer flooring throughout, comes fully furnished, and boasts updated kitchen and bathroom counters, complemented by a newer kitchen backsplash. Adding to its character is a vintage Tappan built-in stove and cooktop. Enjoy the convenience of a two-car covered carport and a low HOA fee of just $211, which includes water, sewer, trash, and access to an impressive array of amenities such as two clubhouses, two pools, shuffleboard
Key facts
- Two clubhouses
- 2,962 sq ft lot
- 2 parking spots
Tags
Property features AI
Finance
- Other: Furnished; Third-party listing; Living area approximately 576 square feet; Lot about 0.07 acres (paved, public maintained road)
- Financial info: Total monthly community fees $211 (total annual $2,532); Lease restrictions apply
- HOA & community: Has HOA (monthly fee $211); Association amenities: Clubhouse, Laundry, Maintenance, Pickleball courts, Pool, Recreation facilities, Shuffleboard court; Association fee covers pool, escrow reserves, grounds maintenance, management, sewer, trash, water; Association approval required; Senior community; Buyer approval required; Deed restrictions; Dog park; Golf carts allowed; Pets allowed; Association contact: DEB HANSON
Exterior
- Parking: Carport (2 spaces)
- Utilities: Public water; Public sewer; Electricity available and connected
- Home design: Residential mobile home (single wide); One story; North facing; Entry on one level
- Construction: Vinyl siding; Metal roof; Crawlspace foundation; Built as single wide mobile home
- Exterior features: Covered patio/porch; Private mailbox; Storage shed(s)
Interior
- Kitchen: Built-in oven; Cooktop; Microwave; Refrigerator; Freezer
- Bedrooms: 1 bedroom
- Flooring: Carpet; Laminate
- Bathrooms: 1 full bathroom
- Heating & cooling: Ductless heating; Wall/Window air conditioning
- Interior features: Open floorplan
- Laundry & utility: Washer; Dryer; Outside laundry
Neighborhood map
What this means for you Summary
Snapshot
- This is a 1-bed/1.0-bath manufactured listed at $65k.
Deal economics
- At list price, monthly cash flow is $516 ($6k/yr) — positive.
- The deal already cash-flows at list — no discount required.
- Meets the 1% rule at list price ($1k rent vs $65k).
- Recommended offer: $57k (12.0% below list) — sets the bar for market timing.
- Cap rate 15.8% vs local median 3.6% in Bradenton — top-decile yield for the area; either an underpriced asset or a hidden risk that comps aren't pricing in. Stress-test before assuming the spread holds.
Location & tenants
- Location reads 81/100 on livability (#101 in FL, #1,528 nationally) — a professional / high-income tenant draw. Strengths: commute A+, cost of living A+, housing A+; Watch: employment D+, crime D, amenities F.
- Manatee (suburban): math 54% / reading 50% proficiency, ranked #26 of 73 in FL (top 36%) — acceptable for families but not a draw, mixed tenant base, ~2y average lease.
- Market conditions: 182 active listings in the ZIP; 1 comparable units currently listed for rent nearby; 7,472 units permitted in Manatee County in 2024 (1,782 in 5+ unit buildings).
Forward outlook
- Local home prices are declining (-3.0%/yr); year-one equity from $449 of loan paydown is wiped out by about $2k of value loss. Plan a longer hold.
- Manatee County population projected at +43% by 2050 — long-run rental-demand tailwind backs the buy-and-hold thesis.
- At projected returns (-3.0% appreciation + 3.0% rent growth), your $18k cash investment doubles in ~4 years — after that, you're playing with house money.
Negotiation context
- It's been on market 182 days — a 12% lower offer ($57k) is reasonable based on typical stale-listing flexibility.
- 2 sale attempts since 21y ago; this cycle's ask has dropped $14k (18%) from the opening price — seller is motivated, your offer sets the floor, not the list.
- Current owner paid $26k; list at $65k implies a 150% gain — meaningful room to come down on a strong offer.
Risks & watch-outs
- Climate carrying-cost: severe wind risk, 99% chance of damaging wind over 30y; extreme-heat days projected 7→29/yr by 2055 (HVAC capex compounding) — expect insurance premiums to compound above CPI over the hold.
Questions for the listing agent
- It's been on market 182 days. Have you received any prior offers? Is the seller open to a 12% concession, seller financing, or rate buy-down credit?
- Built in 1973 — when were the roof, HVAC, electrical panel, plumbing, and water heater last replaced?
- What does the HOA fee cover, when was the last increase, and are there any pending special assessments or reserve-fund shortfalls?
- Why hasn't it sold? Are there any deal-killer items the seller is aware of (foundation, flood, title, zoning, code violations)?
- Is there a deadline driving the sale (1031 exchange, divorce, estate, relocation)? That informs how much negotiation room exists.
- Crime grade is D in this area — have there been break-ins, vandalism, or insurance claims at this property in the last 3 years? What carrier currently insures it and at what premium?
- What's the average days-on-market for RENTAL listings here right now (not sales)? A rising rental-DOM trend means longer vacancies and softer asking-rent achievability than the comps imply.
- What's the recent tenant-quality profile in this submarket — average credit score on applications, eviction rate, late-payment / NSF rate, and stable-employment percentage? A property-management company in the area should have these aggregated.
- How much new for-sale + rental construction is in the pipeline within 1–3 miles? Heavy new supply typically softens prices + rents 12–24 months out; constrained supply supports both.
Investment metrics
- 1% rule
- 2.27% ✓
- Cap rate
- 15.82%
- Cash-on-cash
- 34.03%
- DSCR
- 2.51
- GRM
- 3.7
CMA / ARV
- ARV (on-the-fly)
- $76,032
- Comps found
- 3
Show comp detail 3 sales within ~0.75 mi
| Address | Dist | Beds/Ba | Sqft | Sold | Price | $/sf | Match |
|---|---|---|---|---|---|---|---|
| 3109 Cynthia Pl | 0.14mi | 1/1.0 | 600 (+4%) | 1mo | $87,000 | $145 | 86 |
| 7704 Terra Siesta Blvd | 0.16mi | 2/1.0 (+1) | 612 (+6%) | 2mo | $81,000 | $132 | 75 |
| 7708 Terra Siesta Blvd E | 0.15mi | 2/1.0 (+1) | 528 (-8%) | 13mo | $68,500 | $130 | 64 |
Match score weights: distance 35% · size 25% · config 20% · recency 20%. Top-matched comps best support the ARV.
Projected returns pro-forma
-3.0% appreciation · 3.0% rent growth · sell at horizon
- IRR
- 29.5%
- Equity multiple
- 2.24×
- Total profit
- $22,486
- Equity at exit
- $9,692
- IRR
- 36.9%
- Equity multiple
- 4.43×
- Total profit
- $62,501
- Equity at exit
- $5,620
Cash invested: $18,200 (down + closing). Projections, not guarantees.
Landlord ↔ Tenant lean methodology
- Overall (STATE)
- 87 Strongly Landlord-Friendly
- State Florida
- 87 Strongly Landlord-Friendly · R+3
- County
- — inherits STATE
- City
- — inherits STATE
ZIP-level market 34222
- Home prices YoY
- -26.9%
- Active inventory
- 182
- Price-to-rent
- 3.7×
Monthly cashflow live
- Estimated rent
- $1,475 medium interval (Pro) →
- Mortgage (P&I)
- −$341
- Tax from tax record
- −$70 /mo · $844/yr
- Insurance
- −$27
- HOA
- −$211
- Vacancy / Maint / Mgmt
- −$310
- Net cashflow
- $516
Break-even live
UW: 25.0% down · 7.5% · 30yr · 1.5% tax · 5.0% vac · 8.0% maint · 8.0% mgmt
Financing live
Cash to close
- Down payment
- $16,250
- Closing costs
- $1,950
- Reserves months
- —
- Total cash needed
- —
Loan-product check · same deal, 3 products live
Conventional
25% down · 7.5% · 30yr
- Down + closing
- —
- Monthly P&I
- —
- Monthly cashflow
- —
- DSCR
- —
- Eligible?
- —
Personal DTI + credit; lowest rate.
DSCR
20% down · 8.5% · 30yr
- Down + closing
- —
- Monthly P&I
- —
- Monthly cashflow
- —
- DSCR
- —
- Eligible?
- —
No personal income docs; deal must DSCR.
Hard money
10% down · 12.0% · 12mo
- Down + closing
- —
- Monthly P&I
- —
- Monthly cashflow
- —
- DSCR
- —
- Eligible?
- —
Short-term bridge; refi at stabilization.
Rent comps 1 comps
| Address | Beds | Baths | Sqft | Rent | $/sqft | DOM | Units | Dist |
|---|---|---|---|---|---|---|---|---|
| 5942 Factory Shops Blvd Ellenton, FL | 1.0–3.0 | 1.0–2.0 | 953 | $1,424 | $1.49 | 2d | 67 | 1.22mi |
HOA detail
- Monthly dues
- $211 · $2,532/yr
- Likely covers
- watersewertrashpool
Listing history 24 events
-
2026-06-18days on market $65,000 Active 182 DOM
-
2026-06-17days on market $65,000 Active 181 DOM
-
2026-06-16days on market $65,000 Active 180 DOM
-
2026-06-15days on market $65,000 Active 179 DOM
-
2026-06-13days on market $65,000 Active 177 DOM
-
2026-06-13days on market $65,000 Active 176 DOM
-
2026-06-10days on market $65,000 Active 174 DOM
-
2026-06-09days on market $65,000 Active 173 DOM
-
2026-06-08days on market $65,000 Active 172 DOM
-
2026-06-08days on market $65,000 Active 171 DOM
-
2026-06-03days on market $65,000 Active 170 DOM
-
2026-06-02days on market $65,000 Active 169 DOM
-
2026-06-01days on market $65,000 Active 168 DOM
-
2026-05-31days on market $65,000 Active 167 DOM
-
2026-04-20price $65,000
-
2026-01-27price $70,000
-
2025-12-15$79,000 Active
-
2009-01-22soldstatus $26,000
-
2005-08-17historical
-
2005-05-23$34,500
-
2002-02-13soldstatus $20,000
-
1999-11-29soldstatus $24,000
-
1993-01-28soldstatus $24,800
-
1992-03-17soldstatus $17,000
ⓘ Source: listings_history table (triggers on properties + properties_extension) + one-shot
backfill from property_details.listing_events for pre-trigger history.
Tax reassessment forecast FL · Resets to sale price
- Current annual tax
- $844 · $70/mo
- Projected year-2 tax
- $844 · $70/mo
- Expected delta
- $0/yr ($0/mo · 0.0%)
ⓘ Screening estimate from a state-policy table — verify with the county assessor before closing.
Climate risk First Street
- Flood 1/10 Low FEMA zone X (unshaded) · 0% chance over 30 yrs
- Wildfire 1/10 Low
- Heat 10/10 Extreme 7 d/yr ≥107°F today · 29 d/yr by 30 yrs out
- Wind 10/10 Extreme 99% chance of damaging wind over 30 yrs
- Air quality 3/10 Moderate 3 unhealthy d/yr today · 3 by 30 yrs out
Nearby sold comps map
Loading sold comps map…
Walkable amenities ~0.75 mi
Loading nearby amenities…
Taxation est. · year 1
- Rental income
- $17,703
- − Mortgage interest
- −$3,641
- − Property taxes
- −$844
- − Insurance
- −$325
- − Repairs & maintenance
- −$1,416
- − Management
- −$1,416
- − HOA
- −$2,532
- − Depreciation
- −$1,891
- Taxable income
- $5,637
- Est. tax owed @ 24.0%
- −$1,353
- After-tax cash flow
- $4,841/yr
For passive investors: Depreciation is non-cash, so a rental often shows a tax loss while cash-flowing — sheltering income. Rental losses are passive: they offset passive income freely, and up to $25,000/yr can offset ordinary (W-2) income if you actively participate and your MAGI is under $100k (phasing out to $0 by $150k); unused losses carry forward. On sale, claimed depreciation is recaptured at up to 25%, and gains may owe capital-gains tax (a 1031 exchange can defer both). Figures are a year-1 estimate at your 24.0% rate — not tax advice; consult a CPA.
Schools (NCES district)
- District
- Manatee
- NCES district ID
- 1201230
- Math proficiency
- 54% ▼ -6.00%
- Reading proficiency
- 50% ▼ -2.00%
- Median HH income
- $49,607
- Composite
- 44.43/100
- National rank
- #2806
- State rank
- #26 of 73 in FL
Livability — Bradenton
- Score
- 81/100
- State rank
- #101
- US rank
- #1528
Category grades
Schools grade is shown separately in the Schools card above.
Census & demographics
- County
- Manatee County · 416,364 people
- City population
- 227,091
- Metro
- North Port-Sarasota-Bradenton, FL
- Population (ZIP)
- 14,819
- Household income
- $64,355
- Rent vs Own
- Severe rent burden
- 313.0
Population outlook (Manatee County) Hauer SSP2
- Today (2025)
- 447,342 people
- By 2030
- 488,911 · +9.3%
- By 2040
- 567,934 · +27.0%
- By 2050
- 637,995 · +42.6%
- By 2075
- 781,970 · +74.8%
- By 2100
- 848,272 · +89.6%
Race, ethnicity, and origin ACS 2023
- Neighborhood character
- Predominantly White (70%)
- Race & ethnicity
- White 70% Hispanic / Latino 17% Two or more races 13% Black 7% Native American 2% Asian 1%
- Hispanic origin (detail)
- Mexican 8% Puerto Rican 2%
- Common ancestry
- Romanian 3% Slovak 2% Lithuanian 2%
- Foreign-born
- 8% · Canada, Jamaica, Vietnam
- Languages at home
- 88% English-only · Spanish 10% Other Indo-European 1% Vietnamese 1%
Political lean MEDSL · Manatee
- 2024 margin
- Strong R (+23.5) · D 37.9% · R 61.4%
- 2008→2024 swing
- -16.5pp toward R · 2008: -7.0pp · 2024: -23.5pp
- All cycles
- 2024: R+23.5 2020: R+16.1 2016: R+17.1 2012: R+12.5 2008: R+7.0
Not yet ingested
- Civics
- —
Market trends
- HPI YoY
- ▼ -107.75%
- Current HPI
- 293.2597
- Rent YoY
- —
- Metro
- North Port-Sarasota-Bradenton, FL
- State GDP YoY
- ▲ 3.28%
- F500 in state
- 36
Industry mix (Fortune 500 HQ in FL)
| Industry | F500 HQs | Revenue |
|---|---|---|
| Industrial Technology | 2 | $29B |
|
||
| Insurance | 2 | $17B |
|
||
| Retail | 1 | $60B |
|
||
| Technology Distribution | 1 | $58B |
|
||
| Homebuilding | 1 | $35B |
|
||
| Technology Manufacturing | 1 | $35B |
|
||
Price history
+282.4% since first listed10 events — show timeline
- 2026-04-20 Price Changed $65,000 Stellar MLS as Distributed by MLS Grid
- 2026-01-27 Price Changed $70,000 Stellar MLS as Distributed by MLS Grid
- 2025-12-15 Listed $79,000 Stellar MLS as Distributed by MLS Grid
- 2009-01-22 Sold (Public Records) $26,000 Public Records
- 2005-08-17 Listing Removed — Stellar MLS as Distributed by MLS Grid
- 2005-05-23 Listed $34,500 Stellar MLS as Distributed by MLS Grid
- 2002-02-13 Sold (Public Records) $20,000 Public Records
- 1999-11-29 Sold (Public Records) $24,000 Public Records
- 1993-01-28 Sold (Public Records) $24,800 Public Records
- 1992-03-17 Sold (Public Records) $17,000 Public Records
Property tax history
+5.5%/yrLatest (2025): $844 · +5.8% YoY. Source: county tax records.
Cash-flow waterfall
monthlySold comps — $/sqft
last 12 mo · ≤1 miLoading sold comps…