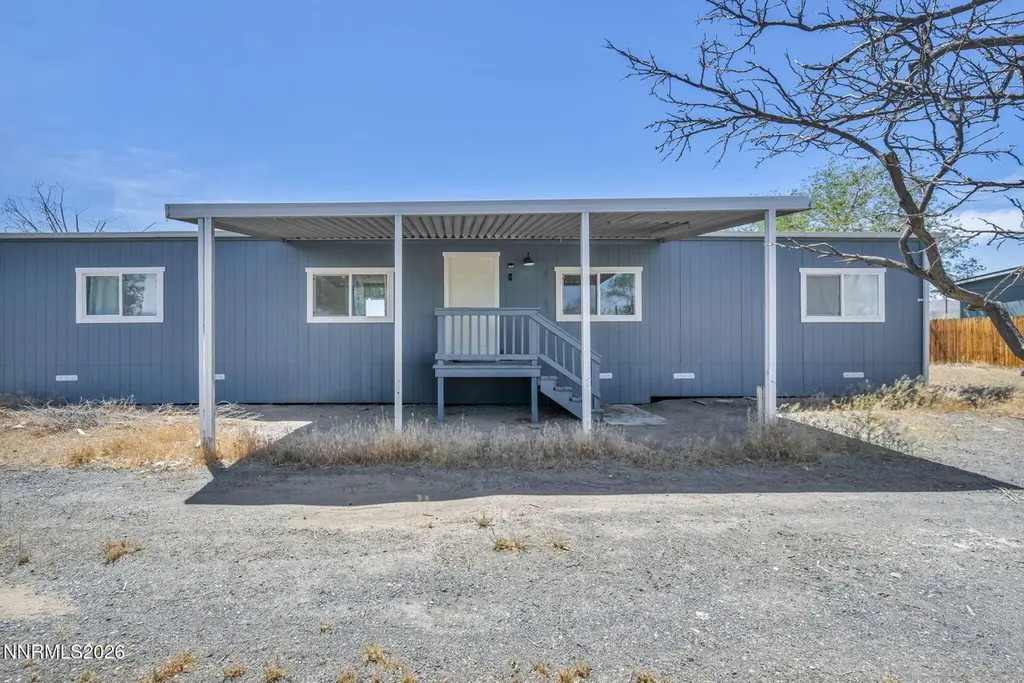
3715 Deodar St · Silver Springs, NV
Flood risk 1/10 · Minimal
- FEMA flood zone
- X (unshaded)
- Chance of flooding over 30 yrs
- 0.0%
- Est. flood insurance / yr
- $507 – $1,088
Fire risk 4/10 · Minor
- Est. fire insurance / yr
- $490 – $910
Heat risk 6/10 · Moderate
- Hot days now (above 96°F)
- 7 days/yr
- Hot days in 30 yrs
- 19 days/yr
Wind risk 1/10 · Minimal
- Chance of severe wind over 30 yrs
- —
Air-quality risk 8/10 · Major
- Unhealthy air days now
- 17 days/yr
- Unhealthy air days in 30 yrs
- 17 days/yr
Risk factors via First Street. Map © Google.
Why this score? — see what drove the D grade
The composite is a weighted blend of 9 inputs, each scored 0–100. Each bar is that input's sub-score; the figure is the points it added to the 100-point composite (weight × sub-score).
- ARV discount +12.7/15.0
- Appreciation +8.2/10.0
- Cash flow +7.1/30.0
- Livability +3.2/5.0
- Rent growth +2.5/5.0
- Condition / age +2.5/5.0
- Schools +2.4/10.0
- DSCR +1.3/10.0
- 1% rule +0.9/10.0
$255,000
🖨 Deal sheet (PDF) 📄 Offer letter ✓ Due diligence
Listing remarks MLS
Newly remodeled! Absolutely gorgeous inside! OWNER WILL FINANCE WITH 20% DOWN. Seller is in process of installing 8 point foundation. Can be converted in escrow. Please call listing agent with any questions. , Buyers wanting owner finance will need to be pre-approved through Max the underwriter.
Key facts
- Split-bedroom layout
- Walk-in closet
- 0.92 acre lot
Tags
Property features AI
Finance
- HOA & community: Not a senior community
Exterior
- Parking: Carport (1 space); Additional parking available
- Utilities: Public water; Public sewer; Electricity connected; Natural gas connected; Cellular coverage
- Home design: Manufactured home; One story; No attached neighbors (no common walls)
- Construction: Wood siding; Composition shingle pitched roof; 8-point foundation
- Exterior features: Partially fenced backyard; Landscaped, level lot; Views of desert and mountains (peek view)
Interior
- Kitchen: Disposal; Dishwasher; Gas range; Gas cooktop
- Bedrooms: Primary bedroom is downstairs
- Flooring: Carpet; Linoleum
- Bathrooms: 2 full bathrooms
- Heating & cooling: Forced air heating; Natural gas heating
- Interior features: Ceiling fans; Breakfast bar; Kitchen island; Primary bedroom on the ground floor; Walk-in closets; Double-pane windows
- Laundry & utility: In-unit laundry; Washer hookup; Laundry room; Electric dryer hookup
Neighborhood map
What this means for you Summary
Snapshot
- This is a 3-bed/2.0-bath manufactured listed at $255k.
Deal economics
- At list price, monthly cash flow is $-364 ($-4k/yr) — negative.
- To cash-flow at today's rent, offer at most $191k (25.2% below list).
- To meet the 1% rule (rent ≥ 1% of price), the offer needs to be $150k (41.2% below list).
- Recommended offer: $150k (41.2% below list) — sets the bar for 1% rule.
- Cap rate 4.6% vs local median 3.7% in Silver Springs — meaningfully above typical; check what's discounted (condition, days-on-market, listing class) to confirm the premium yield is real.
Location & tenants
- Location reads 65/100 on livability (#42 in NV) — a middle-class / working-renter tenant base. Strengths: cost of living A+, housing A+, health & safety A-; Watch: amenities F, commute F, employment D-.
- Lyon County School District (town): math 21% / reading 35% proficiency, ranked #14 of 17 in NV (top 82%) — low school quality limits family demand, transient renter base, plan for 1-2y turnover.
- Zoned schools: Silver Stage Middle School (math 18% / reading 33%, grade F, #62 of 109 statewide, top 58%, 329 students, 100% FRL); Silver Stage High School (math 17% / reading 42%, grade F, #67 of 131 statewide, top 53%, 333 students, 100% FRL) — zoned schools average 100% FRL vs 42% district-wide (58 pts higher); higher-poverty schools than district average — tighter screening recommended.
- Market conditions: 247 active listings in the ZIP; 1 comparable units currently listed for rent nearby; 297 units permitted in Lyon County in 2024 (80 in 5+ unit buildings).
Forward outlook
- In year one you build about $18k of equity ($2k loan paydown + $16k appreciation (6.4% local appreciation)).
- Lyon County population projected at -20% by 2050 — secular population decline; favor cash flow + early exit over multi-decade hold.
- By year 3, paydown + projected appreciation supports a ~$45k cash-out refi (75% LTV) — recoverable capital for the next deal without selling this one.
Negotiation context
- It's been on market 31 days — a 3% lower offer ($247k) is reasonable based on typical stale-listing flexibility.
- 5 sale attempts since 3y ago; this cycle's ask has dropped $15k (6%) from the opening price — seller is motivated, your offer sets the floor, not the list.
Risks & watch-outs
- Climate carrying-cost: extreme-heat days projected 7→19/yr by 2055 (HVAC capex compounding) — expect insurance premiums to compound above CPI over the hold.
Questions for the listing agent
- What do current leases actually rent for vs. the listed asking? Can we see a recent rent roll and the last 12 months of T-12 income?
- It's been on market 31 days. Have you received any prior offers? Is the seller open to a 41% concession, seller financing, or rate buy-down credit?
- Built in 1978 — when were the roof, HVAC, electrical panel, plumbing, and water heater last replaced?
- Is there a deadline driving the sale (1031 exchange, divorce, estate, relocation)? That informs how much negotiation room exists.
- Schools are F-rated, which usually means shorter tenancies and higher turnover. Who's the typical renter profile here, and what's been the actual vacancy rate?
- The area grade is low — what's the realistic commute time and amenity access for the typical tenant pool here? Any planned neighborhood developments (good or bad) we should know about?
- What's the average days-on-market for RENTAL listings here right now (not sales)? A rising rental-DOM trend means longer vacancies and softer asking-rent achievability than the comps imply.
- What's the recent tenant-quality profile in this submarket — average credit score on applications, eviction rate, late-payment / NSF rate, and stable-employment percentage? A property-management company in the area should have these aggregated.
- How much new for-sale + rental construction is in the pipeline within 1–3 miles? Heavy new supply typically softens prices + rents 12–24 months out; constrained supply supports both.
Investment metrics
- 1% rule
- 0.59% ✗
- Cap rate
- 4.58%
- Cash-on-cash
- -6.12%
- DSCR
- 0.73
- GRM
- 14.2
CMA / ARV
- ARV (on-the-fly)
- $288,000
- Comps found
- 12
Show comp detail 12 sales within ~0.75 mi
| Address | Dist | Beds/Ba | Sqft | Sold | Price | $/sf | Match |
|---|---|---|---|---|---|---|---|
| 3808 Deodar St | 0.09mi | 3/2.0 | 1,440 (0%) | 12mo | $288,500 | $200 | 86 |
| 1155 E Spruce Ave | 0.47mi | 3/2.0 | 1,404 (-2%) | 6mo | $460,000 | $328 | 69 |
| 1500 W Spruce Ave | 0.42mi | 3/2.0 | 1,352 (-6%) | 2mo | $362,000 | $268 | 69 |
| 3804 Cypress St | 0.10mi | 3/3.0 | 1,560 (+8%) | 14mo | $300,000 | $192 | 66 |
| 3815 Amber St | 0.69mi | 3/2.0 | 1,440 (0%) | 10mo | $210,000 | $146 | 60 |
| 3908 Amber St | 0.67mi | 3/2.0 | 1,440 (0%) | 11mo | $150,000 | $104 | 60 |
| 3715 Amber St | 0.68mi | 2/2.0 (-1) | 1,440 (0%) | 8mo | $122,500 | $85 | 57 |
| 3810 Amber St | 0.65mi | 3/2.0 | 1,352 (-6%) | 9mo | $293,500 | $217 | 52 |
| 1105 Idaho Ave | 0.50mi | 3/2.0 | 1,605 (+12%) | 14mo | $300,000 | $187 | 46 |
| 3602 Amber St | 0.66mi | 3/2.0 | 1,568 (+9%) | 10mo | $349,000 | $223 | 45 |
| 1115 Idaho Ave | 0.49mi | 3/2.0 | 1,605 (+12%) | 15mo | $299,000 | $186 | 45 |
| 3913 Amber St | 0.71mi | 4/2.0 (+1) | 1,620 (+12%) | 8mo | $360,000 | $222 | 34 |
Match score weights: distance 35% · size 25% · config 20% · recency 20%. Top-matched comps best support the ARV.
Projected returns pro-forma
6.36% appreciation · 3.0% rent growth · sell at horizon
- IRR
- 11.3%
- Equity multiple
- 1.78×
- Total profit
- $55,813
- Equity at exit
- $166,155
- IRR
- 12.2%
- Equity multiple
- 3.53×
- Total profit
- $180,785
- Equity at exit
- $306,499
Cash invested: $71,400 (down + closing). Projections, not guarantees.
Landlord ↔ Tenant lean methodology
- Overall (STATE)
- 71 Landlord-Friendly
- State Nevada
- 71 Landlord-Friendly · R+1
- County
- — inherits STATE
- City
- — inherits STATE
ZIP-level market 89429
- Home prices YoY
- 2.4%
- Active inventory
- 247
- Price-to-rent
- 14.2×
Monthly cashflow live
- Estimated rent
- $1,500 medium interval (Pro) →
- Mortgage (P&I)
- −$1,337
- Tax from tax record
- −$106 /mo · $1,270/yr
- Insurance
- −$106
- HOA
- −$0
- Vacancy / Maint / Mgmt
- −$315
- Net cashflow
- $-364
Break-even live
Sensitivity live
| Price | -10% $-220 | -5% $-292 | +0% $-364 | +5% $-436 | +10% $-509 |
|---|---|---|---|---|---|
| Rent | -10% $-483 | -5% $-424 | +0% $-364 | +5% $-305 | +10% $-246 |
| Rate | -1.0pp $-236 | -0.5pp $-299 | base $-364 | +0.5pp $-430 | +1.0pp $-498 |
UW: 25.0% down · 7.5% · 30yr · 1.5% tax · 5.0% vac · 8.0% maint · 8.0% mgmt
Financing live
Cash to close
- Down payment
- $63,750
- Closing costs
- $7,650
- Reserves months
- —
- Total cash needed
- —
Loan-product check · same deal, 3 products live
Conventional
25% down · 7.5% · 30yr
- Down + closing
- —
- Monthly P&I
- —
- Monthly cashflow
- —
- DSCR
- —
- Eligible?
- —
Personal DTI + credit; lowest rate.
DSCR
20% down · 8.5% · 30yr
- Down + closing
- —
- Monthly P&I
- —
- Monthly cashflow
- —
- DSCR
- —
- Eligible?
- —
No personal income docs; deal must DSCR.
Hard money
10% down · 12.0% · 12mo
- Down + closing
- —
- Monthly P&I
- —
- Monthly cashflow
- —
- DSCR
- —
- Eligible?
- —
Short-term bridge; refi at stabilization.
Rent comps 1 comps
| Address | Beds | Baths | Sqft | Rent | $/sqft | DOM | Units | Dist |
|---|---|---|---|---|---|---|---|---|
| 3901 Cherry St Silver Springs, NV | 2.0 | 2.0 | 1000 | $1,500 | $1.50 | 22d | 1 | 0.50mi |
Listing history 33 events
-
2026-06-22days on market $255,000 Active 31 DOM
-
2026-06-18days on market $255,000 Active 28 DOM
-
2026-06-17days on market $255,000 Active 27 DOM
-
2026-06-16days on market $255,000 Active 26 DOM
-
2026-06-15days on market $255,000 Active 25 DOM
-
2026-06-14days on market $255,000 Active 23 DOM
-
2026-06-13days on market $255,000 Active 22 DOM
-
2026-06-10pricedays on market $255,000 Active 20 DOM
-
2026-06-09days on market $270,000 Active 19 DOM
-
2026-06-08days on market $270,000 Active 18 DOM
-
2026-06-07days on market $270,000 Active 17 DOM
-
2026-06-03days on market $270,000 Active 13 DOM
-
2026-06-02days on market $270,000 Active 12 DOM
-
2026-06-01days on market $270,000 Active 11 DOM
-
2026-05-31days on market $270,000 Active 10 DOM
-
2026-05-30days on market $270,000 Active 9 DOM
-
2026-05-01$270,000 Active
-
2026-04-30historical
-
2026-02-02status Active
-
2025-12-30historical Active Under Contract-Show
-
2025-12-17price $270,000
-
2025-12-08price $299,999
-
2025-10-25price $315,000
-
2025-10-07$335,000 Active
-
2023-12-05soldstatus $300,000 Sold 298-char remark
Show marketing remark (298 chars)
Newly remodeled! Absolutely gorgeous inside! OWNER WILL FINANCE WITH 20% DOWN. Seller is in process of installing 8 point foundation. Can be converted in escrow. Please call listing agent with any questions. , Buyers wanting owner finance will need to be pre-approved through Max the underwriter.
-
2023-12-05soldstatus $300,000
Show marketing remark (298 chars)
Newly remodeled! Absolutely gorgeous inside! OWNER WILL FINANCE WITH 20% DOWN. Seller is in process of installing 8 point foundation. Can be converted in escrow. Please call listing agent with any questions. , Buyers wanting owner finance will need to be pre-approved through Max the underwriter.
-
2023-09-25historical Under Contract-Show 298-char remark
Show marketing remark (298 chars)
Newly remodeled! Absolutely gorgeous inside! OWNER WILL FINANCE WITH 20% DOWN. Seller is in process of installing 8 point foundation. Can be converted in escrow. Please call listing agent with any questions. , Buyers wanting owner finance will need to be pre-approved through Max the underwriter.
-
2023-09-21price $319,000 298-char remark
Show marketing remark (298 chars)
Newly remodeled! Absolutely gorgeous inside! OWNER WILL FINANCE WITH 20% DOWN. Seller is in process of installing 8 point foundation. Can be converted in escrow. Please call listing agent with any questions. , Buyers wanting owner finance will need to be pre-approved through Max the underwriter.
-
2023-08-22$335,000 Active - New 298-char remark
Show marketing remark (298 chars)
Newly remodeled! Absolutely gorgeous inside! OWNER WILL FINANCE WITH 20% DOWN. Seller is in process of installing 8 point foundation. Can be converted in escrow. Please call listing agent with any questions. , Buyers wanting owner finance will need to be pre-approved through Max the underwriter.
-
2023-05-18soldstatus $80,000 Sold
-
2023-05-18soldstatus $80,000
-
2023-04-11status Under Contract-No Show
-
2023-04-07$125,000 Active - New
ⓘ Source: listings_history table (triggers on properties + properties_extension) + one-shot
backfill from property_details.listing_events for pre-trigger history.
Tax reassessment forecast NV · Resets to sale price
- Current annual tax
- $1,270 · $106/mo
- Projected year-2 tax
- $1,504 · $125/mo
- Expected delta
- +$235/yr (+$20/mo · 18.5%)
ⓘ Screening estimate from a state-policy table — verify with the county assessor before closing.
Climate risk First Street
- Flood 1/10 Low FEMA zone X (unshaded) · 0% chance over 30 yrs
- Wildfire 4/10 Moderate
- Heat 6/10 Major 7 d/yr ≥96°F today · 19 d/yr by 30 yrs out
- Wind 1/10 Low
- Air quality 8/10 Severe 17 unhealthy d/yr today · 17 by 30 yrs out
Nearby sold comps map
Loading sold comps map…
Walkable amenities ~0.75 mi
Loading nearby amenities…
Taxation est. · year 1
- Rental income
- $18,000
- − Mortgage interest
- −$14,284
- − Property taxes
- −$1,270
- − Insurance
- −$1,275
- − Repairs & maintenance
- −$1,440
- − Management
- −$1,440
- − Depreciation
- −$7,418
- Taxable loss
- −$9,127
- Est. tax savings @ 24.0%
- +$2,190
- After-tax cash flow
- $-2,181/yr
For passive investors: Depreciation is non-cash, so a rental often shows a tax loss while cash-flowing — sheltering income. Rental losses are passive: they offset passive income freely, and up to $25,000/yr can offset ordinary (W-2) income if you actively participate and your MAGI is under $100k (phasing out to $0 by $150k); unused losses carry forward. On sale, claimed depreciation is recaptured at up to 25%, and gains may owe capital-gains tax (a 1031 exchange can defer both). Figures are a year-1 estimate at your 24.0% rate — not tax advice; consult a CPA.
Schools (NCES district)
- District
- Lyon County School District
- NCES district ID
- 3200300
- Math proficiency
- 21% ▼ -11.00%
- Reading proficiency
- 35% ▼ -7.00%
- Median HH income
- $48,197
- Composite
- 24.32/100
- National rank
- #7707
- State rank
- #14 of 17 in NV
Livability — Silver Springs
- Score
- 65/100
- State rank
- #42
- US rank
- #13362
Category grades
Schools grade is shown separately in the Schools card above.
Census & demographics
- Census place
- Silver Springs, NV
- City population
- 7,949
- Population (ZIP)
- 7,949
Population outlook (Lyon County) Hauer SSP2
- Today (2025)
- 51,655 people
- By 2030
- 50,194 · -2.8%
- By 2040
- 46,155 · -10.6%
- By 2050
- 41,580 · -19.5%
- By 2075
- 32,687 · -36.7%
- By 2100
- 24,111 · -53.3%
Race, ethnicity, and origin ACS 2023
- Neighborhood character
- Predominantly White (83%)
- Race & ethnicity
- White 83% Two or more races 8% Hispanic / Latino 8% Native American 2%
- Hispanic origin (detail)
- Mexican 7%
- Common ancestry
- Slovak 3% Lithuanian 2% Italian 2%
- Foreign-born
- 5% · Canada, China
- Languages at home
- 92% English-only · Spanish 5% Arabic 1% Chinese 1%
Political lean MEDSL · Lyon
- 2024 margin
- Solid R (+44.4) · D 26.7% · R 71.1% · Other 2.2%
- 2008→2024 swing
- -26.5pp toward R · 2008: -17.9pp · 2024: -44.4pp
- All cycles
- 2024: R+44.4 2020: R+41.1 2016: R+41.5 2012: R+28.6 2008: R+17.9
Not yet ingested
- Civics
- —
Market trends
- HPI YoY
- ▲ 6.36%
- Current HPI
- 271.5945
- Rent YoY
- —
- Metro
- —
- State GDP YoY
- ▲ 3.08%
- F500 in state
- 6
Industry mix (Fortune 500 HQ in NV)
| Industry | F500 HQs | Revenue |
|---|---|---|
| Hotels / Casinos | 3 | $36B |
|
||
Price history
+116.0% since first listed17 events — show timeline
- 2026-05-01 Listed $270,000 NNRMLS
- 2026-04-30 Listing Removed — NNRMLS
- 2026-02-02 Relisted — NNRMLS
- 2025-12-30 Contingent — NNRMLS
- 2025-12-17 Price Changed $270,000 NNRMLS
- 2025-12-08 Price Changed $299,999 NNRMLS
- 2025-10-25 Price Changed $315,000 NNRMLS
- 2025-10-07 Listed $335,000 NNRMLS
- 2023-12-05 Sold (Public Records) $300,000 Public Records
- 2023-12-05 Sold (MLS) $300,000 NNRMLS
- 2023-09-25 Contingent — NNRMLS
- 2023-09-21 Price Changed $319,000 NNRMLS
- 2023-08-22 Listed $335,000 NNRMLS
- 2023-05-18 Sold (Public Records) $80,000 Public Records
- 2023-05-18 Sold (MLS) $80,000 NNRMLS
- 2023-04-11 Pending — NNRMLS
- 2023-04-07 Listed $125,000 NNRMLS
Property tax history
+9.3%/yrLatest (2025): $1,270 · +45.2% YoY. Source: county tax records.
Cash-flow waterfall
monthlySold comps — $/sqft
last 12 mo · ≤1 miLoading sold comps…