110 Merriman Rd · Hendersonville, NC
Flood risk 1/10 · Minimal
- FEMA flood zone
- X (unshaded)
- Chance of flooding over 30 yrs
- 0.0%
- Est. flood insurance / yr
- $507 – $1,088
Fire risk 2/10 · Minimal
- Est. fire insurance / yr
- $906 – $1,684
Heat risk 4/10 · Minor
- Hot days now (above 98°F)
- 7 days/yr
- Hot days in 30 yrs
- 19 days/yr
Wind risk 2/10 · Minimal
- Chance of severe wind over 30 yrs
- —
Air-quality risk 3/10 · Minor
- Unhealthy air days now
- 2 days/yr
- Unhealthy air days in 30 yrs
- 3 days/yr
Risk factors via First Street. Map © Google.
Why this score? — see what drove the C grade
The composite is a weighted blend of 9 inputs, each scored 0–100. Each bar is that input's sub-score; the figure is the points it added to the 100-point composite (weight × sub-score).
- Cash flow +18.7/30.0
- ARV discount +15.0/15.0
- DSCR +5.9/10.0
- 1% rule +4.4/10.0
- Schools +4.2/10.0
- Livability +3.9/5.0
- Rent growth +2.5/5.0
- Condition / age +2.5/5.0
- Appreciation +0.0/10.0
$200,000
🖨 Deal sheet 📄 Offer letter ✓ Due diligence
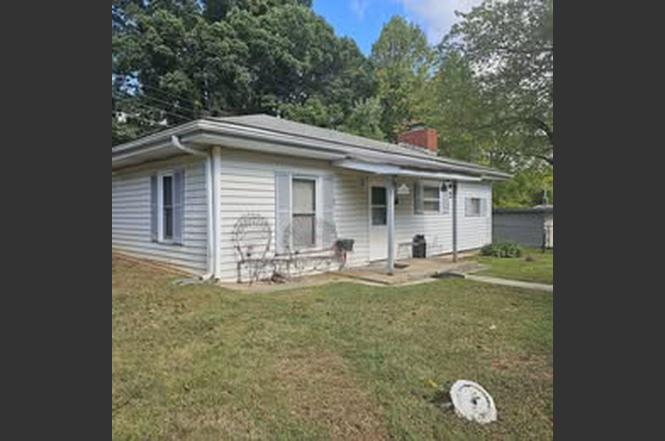
Listing remarks
Cute and quiet little ranch home located within the city limits of Hendersonville just off Highway 25. Needs some TLC, but is great fixer upper for that handy person who just wants a place to call home. Large fenced and gated yard for your fur babies and beautiful flowering trees.
Key facts
- Fenced yard
- Flowering trees
- Gated yard
Tags
Property features AI
Exterior
- Home design: House; 988 sq ft living area
- Construction: Built prior to or in 2025
- Exterior features: Lot of approximately 11,761 sq ft
Neighborhood map
What this means for you Summary
Snapshot
- This is a 2-bed/1.0-bath single-family listed at $200k.
Deal economics
- At list price, monthly cash flow is $198 ($2k/yr) — positive.
- The deal already cash-flows at list — no discount required.
- To meet the 1% rule (rent ≥ 1% of price), the offer needs to be $189k (5.7% below list).
- Recommended offer: $189k (5.7% below list) — sets the bar for 1% rule.
- Cap rate 7.5% vs local median 3.5% in Hendersonville — top-decile yield for the area; either an underpriced asset or a hidden risk that comps aren't pricing in. Stress-test before assuming the spread holds.
Location & tenants
- Location reads 77/100 on livability (#29 in NC, #2,939 nationally) — a middle-class / working-renter tenant base. Strengths: amenities A+, cost of living A+, health & safety A+; Watch: crime D+, employment D+, commute F.
- Henderson County Schools (suburban): math 48% / reading 52% proficiency, ranked #64 of 178 in NC (top 36%) — acceptable for families but not a draw, mixed tenant base, ~2y average lease.
- Market conditions: 149 active listings in the ZIP; 3 comparable units currently listed for rent nearby; rentals at typical pace (median 24d on market — plan ~3-4 weeks tenant-placement turnaround); solid renter incomes; 1,534 units permitted in Henderson County in 2024 (558 in 5+ unit buildings).
Forward outlook
- Local home prices are declining (-3.0%/yr); year-one equity from $1k of loan paydown is wiped out by about $6k of value loss. Plan a longer hold.
- Henderson County population projected at +20% by 2050 — long-run rental-demand tailwind backs the buy-and-hold thesis.
Negotiation context
- Only 4 days on market — expect competitive offers; lowballing is unlikely to land.
- Current owner paid $48k; list at $200k implies a 317% gain — meaningful room to come down on a strong offer.
Risks & watch-outs
- Watch-outs: built in 1950 — expect roof / HVAC / electrical / plumbing capex.
Questions for the listing agent
- Built in 1950 — when were the roof, HVAC, electrical panel, plumbing, and water heater last replaced?
- Is there a deadline driving the sale (1031 exchange, divorce, estate, relocation)? That informs how much negotiation room exists.
- Crime grade is D in this area — have there been break-ins, vandalism, or insurance claims at this property in the last 3 years? What carrier currently insures it and at what premium?
- What's the average days-on-market for RENTAL listings here right now (not sales)? A rising rental-DOM trend means longer vacancies and softer asking-rent achievability than the comps imply.
- What's the recent tenant-quality profile in this submarket — average credit score on applications, eviction rate, late-payment / NSF rate, and stable-employment percentage? A property-management company in the area should have these aggregated.
- How much new for-sale + rental construction is in the pipeline within 1–3 miles? Heavy new supply typically softens prices + rents 12–24 months out; constrained supply supports both.
Investment metrics
- 1% rule
- 0.94% ✗
- Cap rate
- 7.48%
- Cash-on-cash
- 4.24%
- DSCR
- 1.19
- GRM
- 8.8
CMA / ARV
- ARV (on-the-fly)
- $314,184
- Comps found
- 12
Show comp detail 12 sales within ~0.75 mi
| Address | Dist | Beds/Ba | Sqft | Sold | Price | $/sf | Match |
|---|---|---|---|---|---|---|---|
| 354 Stoney Mountain Rd | 0.24mi | 2/2.0 | 974 (-1%) | 16mo | $345,000 | $354 | 69 |
| 2335 Greater Druid Hills Blvd | 0.19mi | 3/2.0 (+1) | 1,066 (+8%) | 2mo | $279,900 | $263 | 67 |
| 2023 Upper Ridgewood Blvd | 0.32mi | 2/1.0 | 929 (-6%) | 13mo | $225,000 | $242 | 64 |
| 2120 Arlington Pl | 0.20mi | 3/1.0 (+1) | 950 (-4%) | 20mo | $302,500 | $318 | 63 |
| 240 Norleon Ave | 0.64mi | 2/2.0 | 1,015 (+3%) | 4mo | $342,000 | $337 | 58 |
| 1733 Clairmont Dr | 0.57mi | 2/1.0 | 1,083 (+10%) | 1mo | $350,000 | $323 | 57 |
| 326 Lyndhurst Dr | 0.47mi | 3/1.0 (+1) | 1,128 (+14%) | 1mo | $330,000 | $293 | 49 |
| 708 Halsbury Ave | 0.67mi | 2/2.0 | 989 (+0%) | 20mo | $385,000 | $389 | 48 |
| 1928 Haywood Rd | 0.60mi | 1/1.5 (-1) | 987 (-0%) | 23mo | $350,000 | $355 | 46 |
| 225 Norleon Ave | 0.65mi | 3/1.0 (+1) | 1,017 (+3%) | 18mo | $260,000 | $256 | 44 |
| 327 Browning Ave | 0.68mi | 2/1.0 | 1,117 (+13%) | 12mo | $333,000 | $298 | 37 |
| 1523 Dawnview Dr | 0.74mi | 3/1.0 (+1) | 1,110 (+12%) | 6mo | $320,000 | $288 | 35 |
Match score weights: distance 35% · size 25% · config 20% · recency 20%. Top-matched comps best support the ARV.
Projected returns pro-forma
-3.0% appreciation · 3.0% rent growth · sell at horizon
- IRR
- -9.7%
- Equity multiple
- 0.65×
- Total profit
- $-19,839
- Equity at exit
- $29,821
- IRR
- -0.3%
- Equity multiple
- 0.98×
- Total profit
- $-1,165
- Equity at exit
- $17,292
Cash invested: $56,000 (down + closing). Projections, not guarantees.
Landlord ↔ Tenant lean methodology
- Overall (STATE)
- 85 Strongly Landlord-Friendly
- State North Carolina
- 85 Strongly Landlord-Friendly · R+3
- County
- — inherits STATE
- City
- — inherits STATE
ZIP-level market 28791
- Active inventory
- 149
- Price-to-rent
- 8.8×
Monthly cashflow live
- Estimated rent
- $1,885 medium interval (Pro) →
- Mortgage (P&I)
- −$1,049
- Tax from tax record
- −$159 /mo · $1,912/yr
- Insurance
- −$83
- HOA
- −$0
- Vacancy / Maint / Mgmt
- −$396
- Net cashflow
- $198
Break-even live
UW: 25.0% down · 7.5% · 30yr · 1.5% tax · 5.0% vac · 8.0% maint · 8.0% mgmt
Financing live
Cash to close
- Down payment
- $50,000
- Closing costs
- $6,000
- Reserves months
- —
- Total cash needed
- —
Loan-product check · same deal, 3 products live
Conventional
25% down · 7.5% · 30yr
- Down + closing
- —
- Monthly P&I
- —
- Monthly cashflow
- —
- DSCR
- —
- Eligible?
- —
Personal DTI + credit; lowest rate.
DSCR
20% down · 8.5% · 30yr
- Down + closing
- —
- Monthly P&I
- —
- Monthly cashflow
- —
- DSCR
- —
- Eligible?
- —
No personal income docs; deal must DSCR.
Hard money
10% down · 12.0% · 12mo
- Down + closing
- —
- Monthly P&I
- —
- Monthly cashflow
- —
- DSCR
- —
- Eligible?
- —
Short-term bridge; refi at stabilization.
Rent comps 3 comps
| Address | Beds | Baths | Sqft | Rent | $/sqft | DOM | Units | Dist |
|---|---|---|---|---|---|---|---|---|
| 1761 Haywood Manor Rd Hendersonville, NC | 2.0 | 2.0 | 1080 | $1,600 | $1.48 | 13d | 1 | 0.87mi |
| 73 Eastbury Dr Hendersonville, NC | 2.0 | 2.0 | 1109 | $1,775 | $1.60 | 23d | 5 | 0.93mi |
| 1416 Highland Ave Unit A Hendersonville, NC | 2.0 | 1.0 | 840 | $1,350 | $1.61 | 23d | 1 | 0.95mi |
Listing history 4 events
-
2025-10-10historical Under Contract
-
2025-09-22historical
-
2025-09-18$200,000 Active
-
1998-07-31soldstatus $48,000
ⓘ Source: listings_history table (triggers on properties + properties_extension) + one-shot
backfill from property_details.listing_events for pre-trigger history.
Tax reassessment forecast NC · Resets to sale price
- Current annual tax
- $1,912 · $159/mo
- Projected year-2 tax
- $1,912 · $159/mo
- Expected delta
- $0/yr ($0/mo · 0.0%)
ⓘ Screening estimate from a state-policy table — verify with the county assessor before closing.
Climate risk First Street
- Flood 1/10 Low FEMA zone X (unshaded) · 0% chance over 30 yrs
- Wildfire 2/10 Low
- Heat 4/10 Moderate 7 d/yr ≥98°F today · 19 d/yr by 30 yrs out
- Wind 2/10 Low
- Air quality 3/10 Moderate 2 unhealthy d/yr today · 3 by 30 yrs out
Nearby sold comps map
Loading sold comps map…
Walkable amenities ~0.75 mi
Loading nearby amenities…
Taxation est. · year 1
- Rental income
- $22,623
- − Mortgage interest
- −$11,203
- − Property taxes
- −$1,912
- − Insurance
- −$1,000
- − Repairs & maintenance
- −$1,810
- − Management
- −$1,810
- − Depreciation
- −$5,818
- Taxable loss
- −$931
- Est. tax savings @ 24.0%
- +$223
- After-tax cash flow
- $2,597/yr
For passive investors: Depreciation is non-cash, so a rental often shows a tax loss while cash-flowing — sheltering income. Rental losses are passive: they offset passive income freely, and up to $25,000/yr can offset ordinary (W-2) income if you actively participate and your MAGI is under $100k (phasing out to $0 by $150k); unused losses carry forward. On sale, claimed depreciation is recaptured at up to 25%, and gains may owe capital-gains tax (a 1031 exchange can defer both). Figures are a year-1 estimate at your 24.0% rate — not tax advice; consult a CPA.
Schools (NCES district)
- District
- Henderson County Schools
- NCES district ID
- 3702100
- Math proficiency
- 48% ▼ -2.00%
- Reading proficiency
- 52% ▼ -2.00%
- Median HH income
- $47,101
- Composite
- 42.5/100
- National rank
- #3206
- State rank
- #64 of 178 in NC
Livability — Hendersonville
- Score
- 77/100
- State rank
- #29
- US rank
- #2939
Category grades
Schools grade is shown separately in the Schools card above.
Census & demographics
- Census place
- Hendersonville, NC
- County
- Henderson County · 78,587 people
- City population
- 51,753
- Metro
- Asheville, NC
- Population (ZIP)
- 15,108
- Household income
- $78,827
- Rent vs Own
- Severe rent burden
- 253.0
Population outlook (Henderson County) Hauer SSP2
- Today (2025)
- 124,075 people
- By 2030
- 129,690 · +4.5%
- By 2040
- 139,898 · +12.8%
- By 2050
- 148,298 · +19.5%
- By 2075
- 163,980 · +32.2%
- By 2100
- 166,962 · +34.6%
Race, ethnicity, and origin ACS 2023
- Neighborhood character
- Predominantly White (83%)
- Race & ethnicity
- White 83% Hispanic / Latino 10% Two or more races 6% Asian 2% Black 2%
- Hispanic origin (detail)
- Mexican 6%
- Common ancestry
- Romanian 4% Slovak 3% Serbian 3%
- Foreign-born
- 8% · Canada, Jamaica
- Languages at home
- 92% English-only · Spanish 5% Other Asian/Pacific 1% German/W. Germanic 1%
Political lean MEDSL · Henderson
- 2024 margin
- R (+14.6) · D 42.1% · R 56.7% · Other 1.1%
- 2008→2024 swing
- +6.5pp toward D · 2008: -21.0pp · 2024: -14.6pp
- All cycles
- 2024: R+14.6 2020: R+18.8 2016: R+27.9 2012: R+27.6 2008: R+21.0
Not yet ingested
- Civics
- —
Market trends
- HPI YoY
- ▼ -160.98%
- Current HPI
- 207.4921
- Rent YoY
- —
- Metro
- Asheville, NC
- State GDP YoY
- ▲ 3.28%
- F500 in state
- 26
Industry mix (Fortune 500 HQ in NC)
| Industry | F500 HQs | Revenue |
|---|---|---|
| Financial Services | 2 | $213B |
|
||
| Retail | 2 | $95B |
|
||
| Industrial Conglomerate | 1 | $38B |
|
||
| Metals / Steel | 1 | $35B |
|
||
| Utilities | 1 | $30B |
|
||
| Industrial Machinery | 1 | $19B |
|
||
Price history
+316.7% since first listed4 events — show timeline
- 2025-10-10 Contingent — ForSaleByOwner.com
- 2025-09-22 Delisted — ForSaleByOwner.com
- 2025-09-18 Listed $200,000 ForSaleByOwner.com
- 1998-07-31 Sold (Public Records) $48,000 Public Records
Property tax history
+13.4%/yrLatest (2025): $1,912 · +0.0% YoY. Source: county tax records.
Cash-flow waterfall
monthlySold comps — $/sqft
last 12 mo · ≤1 miLoading sold comps…