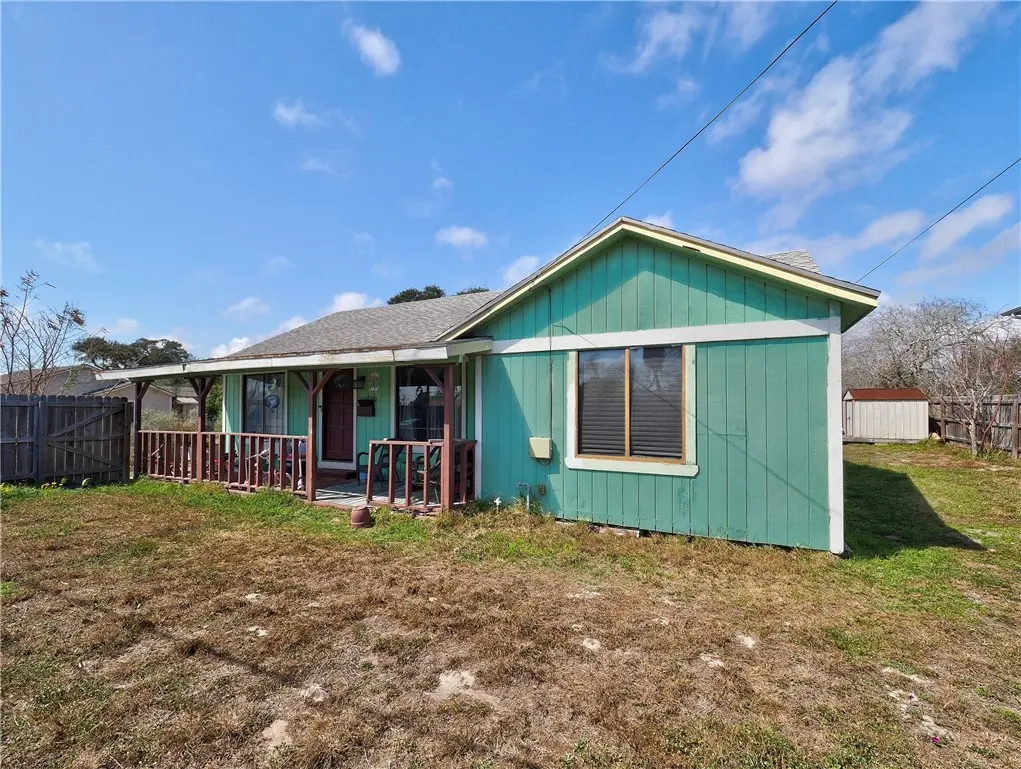
330 S Saunders St · Aransas Pass, TX
Flood risk 1/10 · Minimal
- FEMA flood zone
- X (unshaded)
- Chance of flooding over 30 yrs
- 0.0%
- Est. flood insurance / yr
- $507 – $1,088
Fire risk 4/10 · Minor
- Est. fire insurance / yr
- $1,222 – $2,270
Heat risk 10/10 · Severe
- Hot days now (above 106°F)
- 7 days/yr
- Hot days in 30 yrs
- 30 days/yr
Wind risk 9/10 · Severe
- Chance of severe wind over 30 yrs
- 99.0%
Air-quality risk 1/10 · Minimal
- Unhealthy air days now
- 0 days/yr
- Unhealthy air days in 30 yrs
- 0 days/yr
Risk factors via First Street. Map © Google.
Why this score? — see what drove the C- grade
The composite is a weighted blend of 9 inputs, each scored 0–100. Each bar is that input's sub-score; the figure is the points it added to the 100-point composite (weight × sub-score).
- Cash flow +19.9/30.0
- ARV discount +7.5/15.0
- DSCR +6.3/10.0
- 1% rule +5.1/10.0
- Livability +3.6/5.0
- Schools +2.7/10.0
- Rent growth +2.5/5.0
- Condition / age +2.5/5.0
- Appreciation +0.0/10.0
$315,000
🖨 Deal sheet 📄 Offer letter ✓ Due diligence
Listing remarks MLS
Calling all investors! This unique property features a 4 Bedroom, 2 Bath main home PLUS 2 additional 1-bedroom, 1 bath apartments in the back of the property. Rent them all, live in one, whichever you choose. The primary residence has an open floorplan, with 2 living areas and an open kitchen, which is perfect for entertaining. The 2-story apartments in the back could easily generate income or could make a nice guest quarters, she shed, mancave, workout facility — you name it!
Key facts
- Open floorplan
- 2 living areas
- Open kitchen
Tags
Neighborhood map
What this means for you Summary
Snapshot
- This is a 4-bed/2.0-bath single-family listed at $315k.
Deal economics
- At list price, monthly cash flow is $383 ($5k/yr) — positive.
- The deal already cash-flows at list — no discount required.
- Meets the 1% rule at list price ($3k rent vs $315k).
- Recommended offer: $287k (9.0% below list) — sets the bar for market timing.
- Cap rate 7.8% vs local median 4.6% in Aransas Pass — top-decile yield for the area; either an underpriced asset or a hidden risk that comps aren't pricing in. Stress-test before assuming the spread holds.
Location & tenants
- Location reads 72/100 on livability (#253 in TX) — a middle-class / working-renter tenant base. Strengths: cost of living A+, housing A+, health & safety A+; Watch: schools D, amenities F, commute F.
- Aransas Pass ISD (town): math 28% / reading 35% proficiency, ranked #597 of 826 in TX (top 72%) — families likely to look elsewhere, expect single-tenant / working-renter base with shorter leases; 64% free/reduced lunch — lower-income household profile, screen leases tightly.
- Market conditions: 275 active listings in the ZIP; 2 comparable units currently listed for rent nearby; 344 units permitted in San Patricio County in 2024 (0 in 5+ unit buildings).
Forward outlook
- Local home prices are declining (-3.0%/yr); year-one equity from $2k of loan paydown is wiped out by about $9k of value loss. Plan a longer hold.
- San Patricio County population projected at +27% by 2050 — long-run rental-demand tailwind backs the buy-and-hold thesis.
Negotiation context
- It's been on market 106 days — a 9% lower offer ($287k) is reasonable based on typical stale-listing flexibility.
- 3 sale attempts since 17y ago with the ask held roughly flat each time — persistent listings suggest the price (not the market) is what's stuck; bring a comps-based counter.
Risks & watch-outs
- Watch-outs: built in 1945 — expect roof / HVAC / electrical / plumbing capex.
- Climate carrying-cost: severe wind risk, 99% chance of damaging wind over 30y; extreme-heat days projected 7→30/yr by 2055 (HVAC capex compounding) — expect insurance premiums to compound above CPI over the hold.
Questions for the listing agent
- It's been on market 106 days. Have you received any prior offers? Is the seller open to a 9% concession, seller financing, or rate buy-down credit?
- Built in 1945 — when were the roof, HVAC, electrical panel, plumbing, and water heater last replaced?
- Why hasn't it sold? Are there any deal-killer items the seller is aware of (foundation, flood, title, zoning, code violations)?
- Is there a deadline driving the sale (1031 exchange, divorce, estate, relocation)? That informs how much negotiation room exists.
- Schools are D-rated, which usually means shorter tenancies and higher turnover. Who's the typical renter profile here, and what's been the actual vacancy rate?
- What's the average days-on-market for RENTAL listings here right now (not sales)? A rising rental-DOM trend means longer vacancies and softer asking-rent achievability than the comps imply.
- What's the recent tenant-quality profile in this submarket — average credit score on applications, eviction rate, late-payment / NSF rate, and stable-employment percentage? A property-management company in the area should have these aggregated.
- How much new for-sale + rental construction is in the pipeline within 1–3 miles? Heavy new supply typically softens prices + rents 12–24 months out; constrained supply supports both.
Investment metrics
- 1% rule
- 1.01% ✓
- Cap rate
- 7.75%
- Cash-on-cash
- 5.21%
- DSCR
- 1.23
- GRM
- 8.3
CMA / ARV
- ARV (median comp)
- $191,114
- List price
- $315,000
- Delta
- 64.82%
- Verdict
- OVERPRICED
- Comps
- 20 within 1.0 mi
Show comp detail 12 sales within ~0.75 mi
| Address | Dist | Beds/Ba | Sqft | Sold | Price | $/sf | Match |
|---|---|---|---|---|---|---|---|
| 147 N 8th St | 0.33mi | 4/1.0 | 1,452 (+4%) | 2mo | $150,000 | $103 | 72 |
| 222 N 9th St | 0.44mi | 4/2.0 | 1,370 (-2%) | 10mo | $236,000 | $172 | 68 |
| 320 S 10th St | 0.32mi | 3/2.0 (-1) | 1,448 (+4%) | 8mo | $289,900 | $200 | 67 |
| 257 N 9th St | 0.46mi | 3/2.0 (-1) | 1,377 (-1%) | 8mo | $174,500 | $127 | 65 |
| 630 S Lamont | 0.30mi | 3/2.0 (-1) | 1,269 (-9%) | 1mo | $229,000 | $180 | 65 |
| 329 N 10th St | 0.54mi | 3/2.0 (-1) | 1,354 (-3%) | 4mo | $255,000 | $188 | 61 |
| 229 S 12th St | 0.44mi | 3/2.0 (-1) | 1,264 (-9%) | 0mo | $219,000 | $173 | 58 |
| 1307 W Palm Dr | 0.54mi | 3/2.0 (-1) | 1,326 (-5%) | 8mo | $215,000 | $162 | 55 |
| 936 S Houston St | 0.69mi | 3/2.0 (-1) | 1,330 (-5%) | 1mo | $229,900 | $173 | 55 |
| 504 S 9th St | 0.29mi | 3/2.0 (-1) | 1,224 (-12%) | 10mo | $140,000 | $114 | 52 |
| 841 S 8th | 0.48mi | 3/2.0 (-1) | 1,603 (+15%) | 5mo | $347,851 | $217 | 43 |
| 1510 Windy Oaks Dr | 0.75mi | 3/2.0 (-1) | 1,296 (-7%) | 11mo | $210,000 | $162 | 39 |
Match score weights: distance 35% · size 25% · config 20% · recency 20%. Top-matched comps best support the ARV.
Projected returns pro-forma
-3.0% appreciation · 3.0% rent growth · sell at horizon
- IRR
- -8.2%
- Equity multiple
- 0.70×
- Total profit
- $-26,622
- Equity at exit
- $46,968
- IRR
- 1.3%
- Equity multiple
- 1.09×
- Total profit
- $8,317
- Equity at exit
- $27,235
Cash invested: $88,200 (down + closing). Projections, not guarantees.
Landlord ↔ Tenant lean methodology
- Overall (STATE)
- 87 Strongly Landlord-Friendly
- State Texas
- 87 Strongly Landlord-Friendly · R+5
- County
- — inherits STATE
- City
- — inherits STATE
ZIP-level market 78336
- Home prices YoY
- -29.5%
- Active inventory
- 275
- Price-to-rent
- 8.3×
Monthly cashflow live
- Estimated rent
- $3,181 medium interval (Pro) →
- Mortgage (P&I)
- −$1,652
- Tax from tax record
- −$346 /mo · $4,157/yr
- Insurance
- −$131
- HOA
- −$0
- Vacancy / Maint / Mgmt
- −$668
- Net cashflow
- $383
Break-even live
UW: 25.0% down · 7.5% · 30yr · 1.5% tax · 5.0% vac · 8.0% maint · 8.0% mgmt
Financing live
Cash to close
- Down payment
- $78,750
- Closing costs
- $9,450
- Reserves months
- —
- Total cash needed
- —
Loan-product check · same deal, 3 products live
Conventional
25% down · 7.5% · 30yr
- Down + closing
- —
- Monthly P&I
- —
- Monthly cashflow
- —
- DSCR
- —
- Eligible?
- —
Personal DTI + credit; lowest rate.
DSCR
20% down · 8.5% · 30yr
- Down + closing
- —
- Monthly P&I
- —
- Monthly cashflow
- —
- DSCR
- —
- Eligible?
- —
No personal income docs; deal must DSCR.
Hard money
10% down · 12.0% · 12mo
- Down + closing
- —
- Monthly P&I
- —
- Monthly cashflow
- —
- DSCR
- —
- Eligible?
- —
Short-term bridge; refi at stabilization.
Rent comps 2 comps
| Address | Beds | Baths | Sqft | Rent | $/sqft | DOM | Units | Dist |
|---|---|---|---|---|---|---|---|---|
| 1131 S 8th St Unit 1268400P Aransas Pass, TX | 3.0 | 2.0 | 1280 | $4,105 | $3.21 | 43d | 1 | 0.75mi |
| 2255 McMullen Ln Aransas Pass, TX | 2.0–4.0 | 2.5 | 1581 | $1,639 | $1.04 | 13d | 9 | 1.20mi |
Listing history 22 events
-
2026-06-19days on market $315,000 Active 106 DOM
-
2026-06-18days on market $315,000 Active 105 DOM
-
2026-06-17days on market $315,000 Active 104 DOM
-
2026-06-16days on market $315,000 Active 103 DOM
-
2026-06-15days on market $315,000 Active 102 DOM
-
2026-06-14days on market $315,000 Active 100 DOM
-
2026-06-12days on market $315,000 Active 99 DOM
-
2026-06-09days on market $315,000 Active 96 DOM
-
2026-06-08days on market $315,000 Active 95 DOM
-
2026-06-07days on market $315,000 Active 94 DOM
-
2026-06-07days on market $315,000 Active 93 DOM
-
2026-06-04days on market $315,000 Active 90 DOM
-
2026-06-02days on market $315,000 Active 89 DOM
-
2026-06-01days on market $315,000 Active 88 DOM
-
2026-05-31days on market $315,000 Active 87 DOM
-
2026-05-31days on market $315,000 Active 86 DOM
-
2026-03-04$315,000 Active 488-char remark
Show marketing remark (488 chars)
Calling all investors! This unique property features a 4 Bedroom, 2 Bath main home PLUS 2 additional 1-bedroom, 1 bath apartments in the back of the property. Rent them all, live in one, whichever you choose. The primary residence has an open floorplan, with 2 living areas and an open kitchen, which is perfect for entertaining. The 2-story apartments in the back could easily generate income or could make a nice guest quarters, she shed, mancave, workout facility — you name it!
-
2011-11-01soldstatus
-
2011-10-31soldstatus 153-char remark
Show marketing remark (153 chars)
This would be great investment property. It has two apartments in the back part of the property which are rented. Home is also rented for $800 per month.
-
2010-09-07$99,500 153-char remark
Show marketing remark (153 chars)
This would be great investment property. It has two apartments in the back part of the property which are rented. Home is also rented for $800 per month.
-
2009-03-23$109,900
-
1992-08-28soldstatus
ⓘ Source: listings_history table (triggers on properties + properties_extension) + one-shot
backfill from property_details.listing_events for pre-trigger history.
Tax reassessment forecast TX · Resets to sale price
- Current annual tax
- $4,157 · $346/mo
- Projected year-2 tax
- $5,764 · $480/mo
- Expected delta
- +$1,608/yr (+$134/mo · 38.7%)
ⓘ Screening estimate from a state-policy table — verify with the county assessor before closing.
Climate risk First Street
- Flood 1/10 Low FEMA zone X (unshaded) · 0% chance over 30 yrs
- Wildfire 4/10 Moderate
- Heat 10/10 Extreme 7 d/yr ≥106°F today · 30 d/yr by 30 yrs out
- Wind 9/10 Extreme 99% chance of damaging wind over 30 yrs
- Air quality 1/10 Low 0 unhealthy d/yr today · 0 by 30 yrs out
Nearby sold comps map
Loading sold comps map…
Walkable amenities ~0.75 mi
Loading nearby amenities…
Taxation est. · year 1
- Rental income
- $38,167
- − Mortgage interest
- −$17,645
- − Property taxes
- −$4,157
- − Insurance
- −$1,575
- − Repairs & maintenance
- −$3,053
- − Management
- −$3,053
- − Depreciation
- −$9,164
- Taxable loss
- −$480
- Est. tax savings @ 24.0%
- +$115
- After-tax cash flow
- $4,713/yr
For passive investors: Depreciation is non-cash, so a rental often shows a tax loss while cash-flowing — sheltering income. Rental losses are passive: they offset passive income freely, and up to $25,000/yr can offset ordinary (W-2) income if you actively participate and your MAGI is under $100k (phasing out to $0 by $150k); unused losses carry forward. On sale, claimed depreciation is recaptured at up to 25%, and gains may owe capital-gains tax (a 1031 exchange can defer both). Figures are a year-1 estimate at your 24.0% rate — not tax advice; consult a CPA.
Schools (NCES district)
- District
- Aransas Pass ISD
- NCES district ID
- 4808580
- Math proficiency
- 28% ▼ -16.00%
- Reading proficiency
- 35% ▼ -4.00%
- Median HH income
- $40,869
- Composite
- 26.55/100
- National rank
- #7191
- State rank
- #597 of 826 in TX
Livability — Aransas Pass
- Score
- 72/100
- State rank
- #253
- US rank
- #5980
Category grades
Schools grade is shown separately in the Schools card above.
Census & demographics
- Census place
- Aransas Pass, TX
- Population (ZIP)
- 12,146
Population outlook (San Patricio County) Hauer SSP2
- Today (2025)
- 75,538 people
- By 2030
- 79,575 · +5.3%
- By 2040
- 87,670 · +16.1%
- By 2050
- 96,107 · +27.2%
- By 2075
- 117,984 · +56.2%
- By 2100
- 130,010 · +72.1%
Race, ethnicity, and origin ACS 2023
- Neighborhood character
- Diverse neighborhood (Simpson 0.58)
- Race & ethnicity
- White 49% Hispanic / Latino 43% Two or more races 21% Asian 2% Native American 2% Black 2%
- Hispanic origin (detail)
- Mexican 36% Puerto Rican 2%
- Common ancestry
- Italian 2% Lithuanian 2% Slovak 1%
- Foreign-born
- 9% · Canada, Jamaica, China
- Languages at home
- 77% English-only · Spanish 21% Tagalog/Filipino 1%
Political lean MEDSL · San Patricio
- 2024 margin
- Solid R (+36.4) · D 31.4% · R 67.8%
- 2008→2024 swing
- -19.8pp toward R · 2008: -16.6pp · 2024: -36.4pp
- All cycles
- 2024: R+36.4 2020: R+29.1 2016: R+24.1 2012: R+20.6 2008: R+16.6
Not yet ingested
- Civics
- —
Market trends
- HPI YoY
- ▼ -78.56%
- Current HPI
- 187.8443
- Rent YoY
- —
- Metro
- —
- State GDP YoY
- ▲ 3.95%
- F500 in state
- 110
Industry mix (Fortune 500 HQ in TX)
| Industry | F500 HQs | Revenue |
|---|---|---|
| Energy | 16 | $1,198B |
|
||
| Technology | 5 | $198B |
|
||
| Engineering / Construction | 4 | $72B |
|
||
| Energy Services | 3 | $60B |
|
||
| Utilities | 3 | $41B |
|
||
| Healthcare | 2 | $330B |
|
||
Price history
+186.6% since first listed6 events — show timeline
- 2026-03-04 Listed $315,000 CBMLS
- 2011-11-01 Sold (Public Records) — Public Records
- 2011-10-31 Sold (MLS) — CBMLS
- 2010-09-07 Listed $99,500 CBMLS
- 2009-03-23 Listed $109,900 CBMLS
- 1992-08-28 Sold (Public Records) — Public Records
Property tax history
+8.9%/yrLatest (2025): $4,157 · -2.1% YoY. Source: county tax records.
Cash-flow waterfall
monthlySold comps — $/sqft
last 12 mo · ≤1 miLoading sold comps…