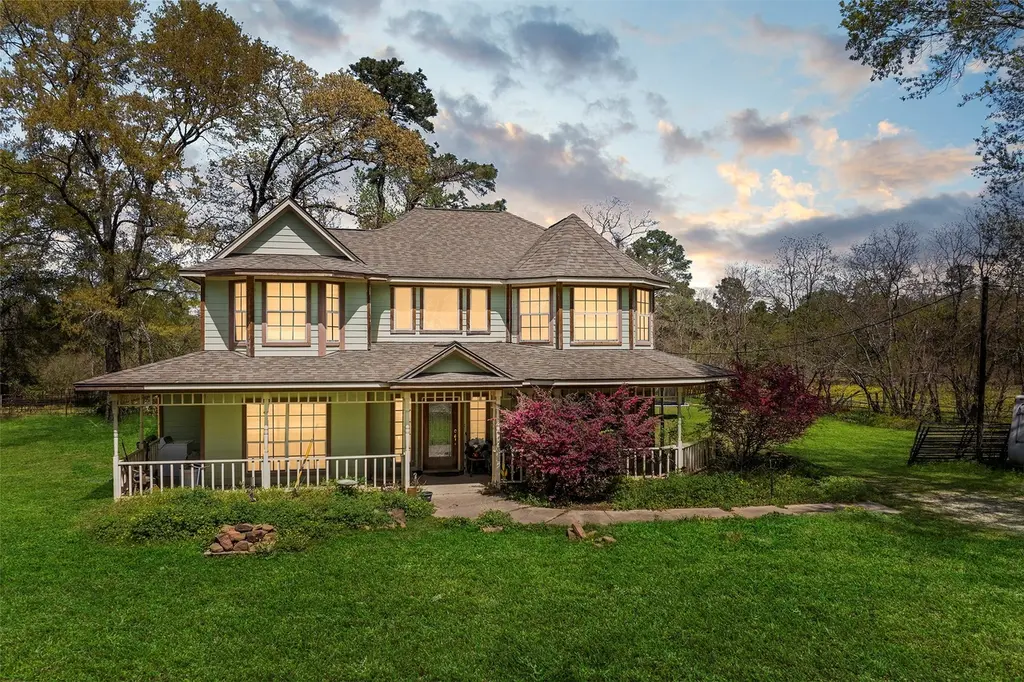
30828 Dobbin Huffsmith Rd · Magnolia, TX
Flood risk 1/10 · Minimal
- FEMA flood zone
- X (unshaded)
- Chance of flooding over 30 yrs
- 0.0%
- Est. flood insurance / yr
- $507 – $1,088
Fire risk 4/10 · Minor
- Est. fire insurance / yr
- $1,222 – $2,270
Heat risk 8/10 · Major
- Hot days now (above 111°F)
- 7 days/yr
- Hot days in 30 yrs
- 24 days/yr
Wind risk 8/10 · Major
- Chance of severe wind over 30 yrs
- 99.0%
Air-quality risk 2/10 · Minimal
- Unhealthy air days now
- 2 days/yr
- Unhealthy air days in 30 yrs
- 2 days/yr
Risk factors via First Street. Map © Google.
Why this score? — see what drove the D- grade
The composite is a weighted blend of 9 inputs, each scored 0–100. Each bar is that input's sub-score; the figure is the points it added to the 100-point composite (weight × sub-score).
- ARV discount +15.0/15.0
- Appreciation +10.0/10.0
- Schools +3.9/10.0
- Livability +3.7/5.0
- Rent growth +2.6/5.0
- Condition / age +2.5/5.0
- Cash flow +2.1/30.0
- 1% rule +0.0/10.0
- DSCR +0.0/10.0
$700,000
🖨 Deal sheet 📄 Offer letter ✓ Due diligence
Listing remarks MLS
Unrestricted 1-acre property in a rapidly growing area of Magnolia! Surrounded by new developments including Moore Landing and Woodhavyn, bringing over 1,700 new residents to the immediate area. Located near the corner of Dobbin-Huffsmith Rd and Moore Rd, this property offers prime exposure and endless potential for residential or commercial use. Excellent visibility and accessibility in one of Magnolia’s fastest-growing corridors - ideal for small business, investment, or future redevelopment. Property is completely unrestricted with no zoning restrictions, allowing for residential, commercial, or mixed-use possibilities.
Key facts
- Excellent visibility
- 1 acre property
- 1 acre lot
Tags
Neighborhood map
What this means for you Summary
Snapshot
- This is a 4-bed/4.0-bath single-family listed at $700k.
Deal economics
- At list price, monthly cash flow is $-3k ($-31k/yr) — negative.
- To cash-flow at today's rent, offer at most $250k (64.4% below list).
- To meet the 1% rule (rent ≥ 1% of price), the offer needs to be $235k (66.5% below list).
- Recommended offer: $235k (66.5% below list) — sets the bar for 1% rule.
- Cap rate 1.9% vs local median 3.4% in Magnolia — below-typical yield; the buyer is paying a premium for something (appreciation thesis, condition, location) that the cap rate doesn't capture.
Location & tenants
- Location reads 73/100 on livability (#222 in TX) — a middle-class / working-renter tenant base. Strengths: crime A+, cost of living A+, housing A+; Watch: schools D+, amenities F, commute F.
- Magnolia ISD (rural): math 42% / reading 45% proficiency, ranked #247 of 826 in TX (top 30%) — families likely to look elsewhere, expect single-tenant / working-renter base with shorter leases.
- Market conditions: Rents flat; 1604 active listings in the ZIP; 1 comparable units currently listed for rent nearby; high-income renter base; 13,259 units permitted in Montgomery County in 2024 (1,402 in 5+ unit buildings).
Forward outlook
- In year one you build about $75k of equity ($5k loan paydown + $70k appreciation (10.0% local appreciation)).
- Montgomery County population projected at +65% by 2050 — long-run rental-demand tailwind backs the buy-and-hold thesis.
- By year 2, paydown + projected appreciation supports a ~$120k cash-out refi (75% LTV) — recoverable capital for the next deal without selling this one.
Negotiation context
- It's been on market 225 days — a 12% lower offer ($616k) is reasonable based on typical stale-listing flexibility.
- 2 sale attempts with the ask held roughly flat each time — persistent listings suggest the price (not the market) is what's stuck; bring a comps-based counter.
Risks & watch-outs
- Climate carrying-cost: severe wind risk, 99% chance of damaging wind over 30y; extreme-heat days projected 7→24/yr by 2055 (HVAC capex compounding) — expect insurance premiums to compound above CPI over the hold.
Questions for the listing agent
- What do current leases actually rent for vs. the listed asking? Can we see a recent rent roll and the last 12 months of T-12 income?
- It's been on market 225 days. Have you received any prior offers? Is the seller open to a 66% concession, seller financing, or rate buy-down credit?
- Why hasn't it sold? Are there any deal-killer items the seller is aware of (foundation, flood, title, zoning, code violations)?
- Is there a deadline driving the sale (1031 exchange, divorce, estate, relocation)? That informs how much negotiation room exists.
- Schools are D-rated, which usually means shorter tenancies and higher turnover. Who's the typical renter profile here, and what's been the actual vacancy rate?
- The area grade is low — what's the realistic commute time and amenity access for the typical tenant pool here? Any planned neighborhood developments (good or bad) we should know about?
- What's the average days-on-market for RENTAL listings here right now (not sales)? A rising rental-DOM trend means longer vacancies and softer asking-rent achievability than the comps imply.
- What's the recent tenant-quality profile in this submarket — average credit score on applications, eviction rate, late-payment / NSF rate, and stable-employment percentage? A property-management company in the area should have these aggregated.
- How much new for-sale + rental construction is in the pipeline within 1–3 miles? Heavy new supply typically softens prices + rents 12–24 months out; constrained supply supports both.
Investment metrics
- 1% rule
- 0.34% ✗
- Cap rate
- 1.92%
- Cash-on-cash
- -15.61%
- DSCR
- 0.31
- GRM
- 24.9
CMA / ARV
- ARV (median comp)
- $855,370
- List price
- $700,000
- Delta
- -18.16%
- Verdict
- UNDERPRICED
- Comps
- 2 within 2.0 mi
Show comp detail 12 sales within ~0.75 mi
| Address | Dist | Beds/Ba | Sqft | Sold | Price | $/sf | Match |
|---|---|---|---|---|---|---|---|
| 29735 Brushy Gables Dr | 0.71mi | 5/4.0 (+1) | 2,973 (-0%) | 0mo | $447,900 | $151 | 62 |
| 29739 Shady Glade Ln | 0.67mi | 4/3.5 | 3,098 (+4%) | 2mo | $654,000 | $211 | 58 |
| 29743 Brushy Gables Dr | 0.70mi | 5/4.0 (+1) | 2,992 (+1%) | 6mo | $499,990 | $167 | 57 |
| 29734 Shady Glade Ln | 0.69mi | 4/3.5 | 2,814 (-5%) | 3mo | $599,990 | $213 | 55 |
| 29719 Brushy Gables Dr | 0.75mi | 5/4.0 (+1) | 2,992 (+1%) | 6mo | $494,990 | $165 | 54 |
| 30726 Lila Grove Ln | 0.66mi | 4/3.0 | 3,139 (+6%) | 4mo | $658,000 | $210 | 52 |
| 29803 Edgewater Dr | 0.74mi | 4/3.5 | 3,137 (+6%) | 5mo | $868,000 | $277 | 50 |
| 29795 Brushy Gables Dr | 0.68mi | 4/3.5 | 2,612 (-12%) | 4mo | $469,990 | $180 | 43 |
| 29764 Brushy Gables Dr | 0.74mi | 4/3.0 | 2,694 (-9%) | 6mo | $474,900 | $176 | 41 |
| 29739 Brushy Gables Dr | 0.70mi | 5/3.0 (+1) | 3,241 (+9%) | 5mo | $574,900 | $177 | 39 |
| 29731 Brushy Gables Dr | 0.72mi | 4/3.0 | 2,545 (-14%) | 1mo | $424,900 | $167 | 38 |
| 29748 Brushy Gables Dr | 0.74mi | 4/3.0 | 2,574 (-13%) | 4mo | $449,900 | $175 | 36 |
Match score weights: distance 35% · size 25% · config 20% · recency 20%. Top-matched comps best support the ARV.
Projected returns pro-forma
10.0% appreciation · 0.32% rent growth · sell at horizon
- IRR
- 13.1%
- Equity multiple
- 2.08×
- Total profit
- $212,431
- Equity at exit
- $630,615
- IRR
- 13.1%
- Equity multiple
- 4.78×
- Total profit
- $741,655
- Equity at exit
- $1,359,946
Cash invested: $196,000 (down + closing). Projections, not guarantees.
Landlord ↔ Tenant lean methodology
- Overall (STATE)
- 87 Strongly Landlord-Friendly
- State Texas
- 87 Strongly Landlord-Friendly · R+5
- County
- — inherits STATE
- City
- — inherits STATE
ZIP-level market 77354
- Home prices YoY
- 2.4%
- Rents YoY
- 0.3%
- Active inventory
- 1604
- Price-to-rent
- 24.9×
Monthly cashflow live
- Estimated rent
- $2,346 medium interval (Pro) →
- Mortgage (P&I)
- −$3,671
- Tax from tax record
- −$441 /mo · $5,286/yr
- Insurance
- −$292
- HOA
- −$0
- Vacancy / Maint / Mgmt
- −$493
- Net cashflow
- $-2,550
Break-even live
UW: 25.0% down · 7.5% · 30yr · 1.5% tax · 5.0% vac · 8.0% maint · 8.0% mgmt
Financing live
Cash to close
- Down payment
- $175,000
- Closing costs
- $21,000
- Reserves months
- —
- Total cash needed
- —
Loan-product check · same deal, 3 products live
Conventional
25% down · 7.5% · 30yr
- Down + closing
- —
- Monthly P&I
- —
- Monthly cashflow
- —
- DSCR
- —
- Eligible?
- —
Personal DTI + credit; lowest rate.
DSCR
20% down · 8.5% · 30yr
- Down + closing
- —
- Monthly P&I
- —
- Monthly cashflow
- —
- DSCR
- —
- Eligible?
- —
No personal income docs; deal must DSCR.
Hard money
10% down · 12.0% · 12mo
- Down + closing
- —
- Monthly P&I
- —
- Monthly cashflow
- —
- DSCR
- —
- Eligible?
- —
Short-term bridge; refi at stabilization.
Rent comps 1 comps
| Address | Beds | Baths | Sqft | Rent | $/sqft | DOM | Units | Dist |
|---|---|---|---|---|---|---|---|---|
| 12035 Noble Wood Village DR Magnolia, TX | 4.0 | 2.5 | 1979 | $2,150 | $1.09 | 44d | 1 | 0.30mi |
Listing history 19 events
-
2026-06-18days on market $700,000 Active 225 DOM
-
2026-06-17days on market $700,000 Active 224 DOM
-
2026-06-16days on market $700,000 Active 223 DOM
-
2026-06-15days on market $700,000 Active 222 DOM
-
2026-06-13days on market $700,000 Active 220 DOM
-
2026-06-09days on market $700,000 Active 216 DOM
-
2026-06-08days on market $700,000 Active 215 DOM
-
2026-06-07days on market $700,000 Active 214 DOM
-
2026-06-04days on market $700,000 Active 211 DOM
-
2026-06-03days on market $700,000 Active 210 DOM
-
2026-06-02days on market $700,000 Active 209 DOM
-
2026-06-01days on market $700,000 Active 208 DOM
-
2026-05-31days on market $700,000 Active 207 DOM
-
2025-11-05historical
Show marketing remark (636 chars)
Unrestricted 1-acre property in a rapidly growing area of Magnolia! Surrounded by new developments including Moore Landing and Woodhavyn, bringing over 1,700 new residents to the immediate area. Located near the corner of Dobbin-Huffsmith Rd and Moore Rd, this property offers prime exposure and endless potential for residential or commercial use. Excellent visibility and accessibility in one of Magnolia’s fastest-growing corridors - ideal for small business, investment, or future redevelopment. Property is completely unrestricted with no zoning restrictions, allowing for residential, commercial, or mixed-use possibilities.
-
2025-11-05$700,000 Active 636-char remark
Show marketing remark (636 chars)
Unrestricted 1-acre property in a rapidly growing area of Magnolia! Surrounded by new developments including Moore Landing and Woodhavyn, bringing over 1,700 new residents to the immediate area. Located near the corner of Dobbin-Huffsmith Rd and Moore Rd, this property offers prime exposure and endless potential for residential or commercial use. Excellent visibility and accessibility in one of Magnolia’s fastest-growing corridors - ideal for small business, investment, or future redevelopment. Property is completely unrestricted with no zoning restrictions, allowing for residential, commercial, or mixed-use possibilities.
-
2025-08-05soldstatus
-
2025-05-06price $1,500,000
-
2025-03-25$1,700,000 Active
-
2018-07-03soldstatus
ⓘ Source: listings_history table (triggers on properties + properties_extension) + one-shot
backfill from property_details.listing_events for pre-trigger history.
Tax reassessment forecast TX · Resets to sale price
- Current annual tax
- $5,286 · $441/mo
- Projected year-2 tax
- $12,810 · $1,068/mo
- Expected delta
- +$7,524/yr (+$627/mo · 142.3%)
ⓘ Screening estimate from a state-policy table — verify with the county assessor before closing.
Climate risk First Street
- Flood 1/10 Low FEMA zone X (unshaded) · 0% chance over 30 yrs
- Wildfire 4/10 Moderate
- Heat 8/10 Severe 7 d/yr ≥111°F today · 24 d/yr by 30 yrs out
- Wind 8/10 Severe 99% chance of damaging wind over 30 yrs
- Air quality 2/10 Low 2 unhealthy d/yr today · 2 by 30 yrs out
Nearby sold comps map
Loading sold comps map…
Walkable amenities ~0.75 mi
Loading nearby amenities…
Taxation est. · year 1
- Rental income
- $28,146
- − Mortgage interest
- −$39,211
- − Property taxes
- −$5,286
- − Insurance
- −$3,500
- − Repairs & maintenance
- −$2,252
- − Management
- −$2,252
- − Depreciation
- −$20,364
- Taxable loss
- −$44,718
- Est. tax savings @ 24.0%
- +$10,732
- After-tax cash flow
- $-19,869/yr
For passive investors: Depreciation is non-cash, so a rental often shows a tax loss while cash-flowing — sheltering income. Rental losses are passive: they offset passive income freely, and up to $25,000/yr can offset ordinary (W-2) income if you actively participate and your MAGI is under $100k (phasing out to $0 by $150k); unused losses carry forward. On sale, claimed depreciation is recaptured at up to 25%, and gains may owe capital-gains tax (a 1031 exchange can defer both). Figures are a year-1 estimate at your 24.0% rate — not tax advice; consult a CPA.
Schools (NCES district)
- District
- Magnolia ISD
- NCES district ID
- 4828740
- Math proficiency
- 42% ▼ -7.00%
- Reading proficiency
- 45% ▼ -4.00%
- Median HH income
- $71,692
- Composite
- 39.46/100
- National rank
- #3958
- State rank
- #247 of 826 in TX
Livability — Magnolia
- Score
- 73/100
- State rank
- #222
- US rank
- #5442
Category grades
Schools grade is shown separately in the Schools card above.
Census & demographics
- County
- Montgomery County · 663,713 people
- City population
- 32,847
- Metro
- Houston-The Woodlands-Sugar Land, TX
- Population (ZIP)
- 44,900
- Household income
- $112,504
- Rent vs Own
- Severe rent burden
- 586.0
Population outlook (Montgomery County) Hauer SSP2
- Today (2025)
- 713,896 people
- By 2030
- 805,263 · +12.8%
- By 2040
- 992,708 · +39.1%
- By 2050
- 1,179,590 · +65.2%
- By 2075
- 1,628,084 · +128.1%
- By 2100
- 1,937,880 · +171.5%
Race, ethnicity, and origin ACS 2023
- Neighborhood character
- Predominantly White (66%)
- Race & ethnicity
- White 66% Hispanic / Latino 25% Two or more races 18% Black 3% Asian 1%
- Hispanic origin (detail)
- Mexican 14% Puerto Rican 1%
- Common ancestry
- Lithuanian 4% Slovak 2% Italian 2%
- Foreign-born
- 11% · Canada, Vietnam
- Languages at home
- 83% English-only · Spanish 15% Other Indo-European 1% German/W. Germanic 1%
Political lean MEDSL · Montgomery
- 2024 margin
- Solid R (+45.5) · D 26.8% · R 72.3%
- 2008→2024 swing
- +7.2pp toward D · 2008: -52.7pp · 2024: -45.5pp
- All cycles
- 2024: R+45.5 2020: R+43.8 2016: R+51.4 2012: R+60.7 2008: R+52.7
Not yet ingested
- Civics
- —
Market trends
- HPI YoY
- ▲ 12.09%
- Current HPI
- 512.87
- Rent YoY
- ▲ 0.32%
- Metro
- Houston-The Woodlands-Sugar Land, TX
- State GDP YoY
- ▲ 3.95%
- F500 in state
- 110
Industry mix (Fortune 500 HQ in TX)
| Industry | F500 HQs | Revenue |
|---|---|---|
| Energy | 16 | $1,198B |
|
||
| Technology | 5 | $198B |
|
||
| Engineering / Construction | 4 | $72B |
|
||
| Energy Services | 3 | $60B |
|
||
| Utilities | 3 | $41B |
|
||
| Healthcare | 2 | $330B |
|
||
Price history
-58.8% since first listed6 events — show timeline
- 2025-11-05 Listed $700,000 HARMLS
- 2025-11-05 Listing Removed — HARMLS
- 2025-08-05 Sold (Public Records) — Public Records
- 2025-05-06 Price Changed $1,500,000 HARMLS
- 2025-03-25 Listed $1,700,000 HARMLS
- 2018-07-03 Sold (Public Records) — Public Records
Property tax history
+3.9%/yrLatest (2025): $5,286 · +9.8% YoY. Source: county tax records.
Cash-flow waterfall
monthlySold comps — $/sqft
last 12 mo · ≤1 miLoading sold comps…