14107 Whisper Rill Ln #854 · Austin, TX
Flood risk 1/10 · Minimal
- FEMA flood zone
- X (unshaded)
- Chance of flooding over 30 yrs
- 0.0%
- Est. flood insurance / yr
- $507 – $1,088
Fire risk 4/10 · Minor
- Est. fire insurance / yr
- $1,222 – $2,270
Heat risk 8/10 · Major
- Hot days now (above 108°F)
- 7 days/yr
- Hot days in 30 yrs
- 24 days/yr
Wind risk 8/10 · Major
- Chance of severe wind over 30 yrs
- 80.0%
Air-quality risk 2/10 · Minimal
- Unhealthy air days now
- 1 days/yr
- Unhealthy air days in 30 yrs
- 1 days/yr
Risk factors via First Street. Map © Google.
Why this score? — see what drove the B grade
The composite is a weighted blend of 9 inputs, each scored 0–100. Each bar is that input's sub-score; the figure is the points it added to the 100-point composite (weight × sub-score).
- Cash flow +30.0/30.0
- 1% rule +10.0/10.0
- DSCR +10.0/10.0
- ARV discount +7.5/15.0
- Condition / age +4.8/5.0
- Livability +4.1/5.0
- Schools +3.4/10.0
- Rent growth +2.0/5.0
- Appreciation +0.0/10.0
$109,995
🖨 Deal sheet 📄 Offer letter ✓ Due diligence
Listing remarks
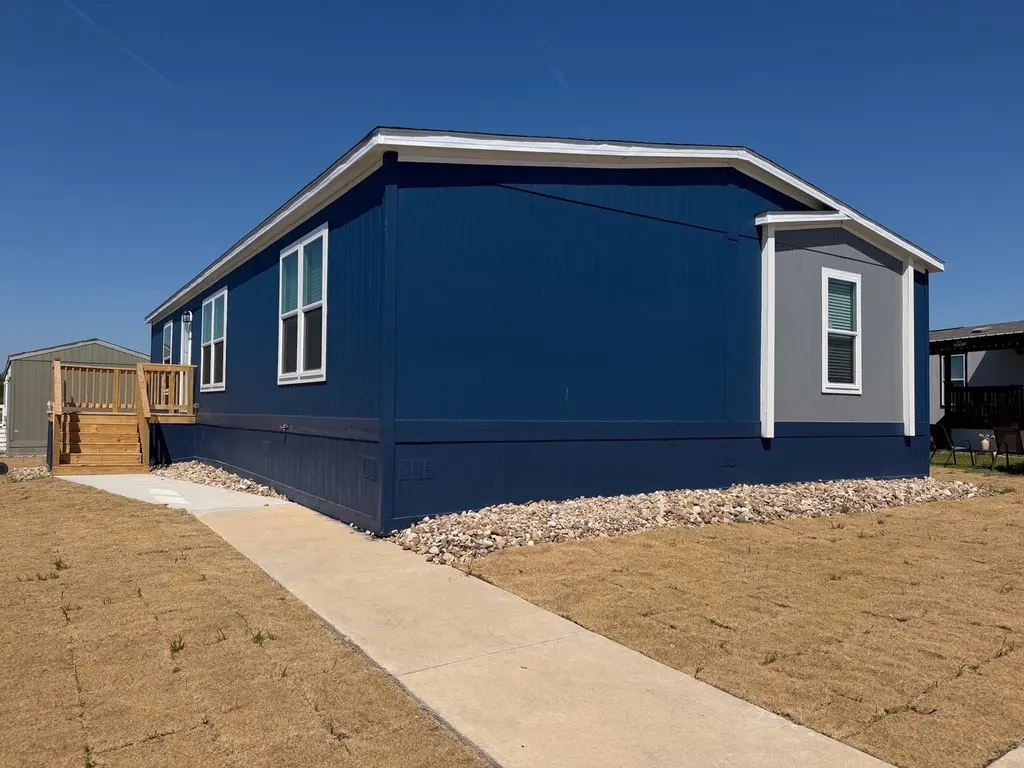
Welcome home! This brand-new manufactured home offers a fresh start with modern finishes and a thoughtful layout designed for comfortable, everyday living. Featuring 3 spacious bedrooms and 2 full bathrooms, there's plenty of room for the whole family. One of the standout features of this home is the large pantry a rare find that provides generous storage space for all your kitchen essentials and more. The open layout ensures you'll never feel cramped, with plenty of room to spread out, entertain, or simply relax. Best of all, this home is carpet-free throughout easy to clean, allergy-friendly, and beautifully low maintenance. Whether you have kids, pets, or just prefer a cleaner look, the
Key facts
- Carpet-free
- Large pantry
- Built 2026
Tags
Property features AI
Finance
- Other: Listing status: Active; Listing last modified May 15, 2026
- Financial info: List price $109,995
Exterior
- Home design: Spec new construction
- Construction: Address: 14107 Whisper Rill Ln #854, Pflugerville, TX 78660
- Exterior features: Living area approximately 1,560
Interior
- Bedrooms: 3 bedrooms
- Bathrooms: 2 full bathrooms
- Interior features: Open living area
Neighborhood map
What this means for you Summary
Snapshot
- This is a 3-bed/2.0-bath manufactured listed at $110k. Condition is rated excellent.
Deal economics
- At list price, monthly cash flow is $884 ($11k/yr) — positive.
- The deal already cash-flows at list — no discount required.
- Meets the 1% rule at list price ($2k rent vs $110k).
- Recommended offer: $107k (3.0% below list) — sets the bar for market timing.
- Cap rate 15.9% vs local median 1.8% in Austin — top-decile yield for the area; either an underpriced asset or a hidden risk that comps aren't pricing in. Stress-test before assuming the spread holds.
Location & tenants
- Location reads 82/100 on livability (#16 in TX, #1,208 nationally) — a professional / high-income tenant draw. Strengths: amenities A+, commute A+, employment A+; Watch: cost of living D, crime F.
- Pflugerville ISD (suburban): math 33% / reading 42% proficiency, ranked #421 of 826 in TX (top 51%) — families likely to look elsewhere, expect single-tenant / working-renter base with shorter leases.
- Market conditions: Rents soft (-2.0%/yr); 1011 active listings in the ZIP; 40 comparable units currently listed for rent nearby; rentals at typical pace (median 24d on market — plan ~3-4 weeks tenant-placement turnaround); high-income renter base; 17,121 units permitted in Travis County in 2024 (11,963 in 5+ unit buildings).
Forward outlook
- Local home prices are declining (-3.0%/yr); year-one equity from $760 of loan paydown is wiped out by about $3k of value loss. Plan a longer hold.
- Travis County population projected at +60% by 2050 — long-run rental-demand tailwind backs the buy-and-hold thesis.
- At projected returns (-3.0% appreciation + 0.0% rent growth), your $31k cash investment doubles in ~4 years — after that, you're playing with house money.
Negotiation context
- It's been on market 34 days — a 3% lower offer ($107k) is reasonable based on typical stale-listing flexibility.
Risks & watch-outs
- Climate carrying-cost: severe wind risk, 80% chance of damaging wind over 30y; extreme-heat days projected 7→24/yr by 2055 (HVAC capex compounding) — expect insurance premiums to compound above CPI over the hold.
Questions for the listing agent
- It's been on market 34 days. Have you received any prior offers? Is the seller open to a 3% concession, seller financing, or rate buy-down credit?
- Is there a deadline driving the sale (1031 exchange, divorce, estate, relocation)? That informs how much negotiation room exists.
- Crime grade is F in this area — have there been break-ins, vandalism, or insurance claims at this property in the last 3 years? What carrier currently insures it and at what premium?
- What's the average days-on-market for RENTAL listings here right now (not sales)? A rising rental-DOM trend means longer vacancies and softer asking-rent achievability than the comps imply.
- What's the recent tenant-quality profile in this submarket — average credit score on applications, eviction rate, late-payment / NSF rate, and stable-employment percentage? A property-management company in the area should have these aggregated.
- How much new for-sale + rental construction is in the pipeline within 1–3 miles? Heavy new supply typically softens prices + rents 12–24 months out; constrained supply supports both.
Investment metrics
- 1% rule
- 1.89% ✓
- Cap rate
- 15.94%
- Cash-on-cash
- 34.46%
- DSCR
- 2.53
- GRM
- 4.4
CMA / ARV
- ARV (median comp)
- $295,000
- List price
- $109,995
- Delta
- -62.71%
- Verdict
- UNDERPRICED
- Comps
- 1 within 2.0 mi
Projected returns pro-forma
-3.0% appreciation · 0.0% rent growth · sell at horizon
- IRR
- 26.5%
- Equity multiple
- 2.05×
- Total profit
- $32,439
- Equity at exit
- $16,401
- IRR
- 32.2%
- Equity multiple
- 3.51×
- Total profit
- $77,335
- Equity at exit
- $9,510
Cash invested: $30,799 (down + closing). Projections, not guarantees.
Landlord ↔ Tenant lean methodology
- Overall (STATE)
- 87 Strongly Landlord-Friendly
- State Texas
- 87 Strongly Landlord-Friendly · R+5
- County
- — inherits STATE
- City
- — inherits STATE
ZIP-level market 78660
- Home prices YoY
- -34.0%
- Rents YoY
- -2.0%
- Active inventory
- 1011
- Price-to-rent
- 4.4×
Monthly cashflow live
- Estimated rent
- $2,082 high interval (Pro) →
- Mortgage (P&I)
- −$577
- Tax est. 1.5%
- −$137 /mo · $1,650/yr
- Insurance
- −$46
- HOA
- −$0
- Vacancy / Maint / Mgmt
- −$437
- Net cashflow
- $884
Break-even live
UW: 25.0% down · 7.5% · 30yr · 1.5% tax · 5.0% vac · 8.0% maint · 8.0% mgmt
Financing live
Cash to close
- Down payment
- $27,499
- Closing costs
- $3,300
- Reserves months
- —
- Total cash needed
- —
Loan-product check · same deal, 3 products live
Conventional
25% down · 7.5% · 30yr
- Down + closing
- —
- Monthly P&I
- —
- Monthly cashflow
- —
- DSCR
- —
- Eligible?
- —
Personal DTI + credit; lowest rate.
DSCR
20% down · 8.5% · 30yr
- Down + closing
- —
- Monthly P&I
- —
- Monthly cashflow
- —
- DSCR
- —
- Eligible?
- —
No personal income docs; deal must DSCR.
Hard money
10% down · 12.0% · 12mo
- Down + closing
- —
- Monthly P&I
- —
- Monthly cashflow
- —
- DSCR
- —
- Eligible?
- —
Short-term bridge; refi at stabilization.
Rent comps 40 comps
| Address | Beds | Baths | Sqft | Rent | $/sqft | DOM | Units | Dist |
|---|---|---|---|---|---|---|---|---|
| 3300 Golden Aspen Loop Pflugerville, TX | 3.0 | 2.0 | 1140 | $1,449 | $1.27 | 12d | 1 | 0.16mi |
| 2800 Halite Bnd #1105 Pflugerville, TX | 3.0 | 2.0 | 1250 | $1,700 | $1.36 | 17d | 1 | 0.29mi |
| 14417 Koti Way Pflugerville, TX | 3.0 | 2.0 | 1474 | $1,999 | $1.36 | 43d | 1 | 0.34mi |
| 14408 Koti Way Pflugerville, TX | 4.0 | 2.0 | 1668 | $2,200 | $1.32 | 43d | 1 | 0.37mi |
| 2808 Schwartz Ln Pflugerville, TX | 3.0 | 2.0 | 1479 | $1,900 | $1.28 | 17d | 1 | 0.41mi |
| 2920 Tweedy Trl Pflugerville, TX | 3.0 | 2.0 | 1481 | $5,000 | $3.38 | 11d | 1 | 0.42mi |
| 14105 Cantarra Dr Pflugerville, TX | 4.0 | 2.0 | 1992 | $2,250 | $1.13 | 23d | 1 | 0.52mi |
| 2612 Schwartz Ln Pflugerville, TX | 4.0 | 2.0 | 1653 | $2,099 | $1.27 | 10d | 1 | 0.52mi |
| 14013 Heywood Dr Pflugerville, TX | 4.0 | 2.0 | 1672 | $2,195 | $1.31 | 23d | 1 | 0.55mi |
| 14108 Boquist Dr Pflugerville, TX | 4.0 | 2.0 | 1999 | $2,200 | $1.10 | 44d | 1 | 0.60mi |
| 3103 Crystal Bend Dr Pflugerville, TX | 4.0 | 2.5 | 2189 | $2,200 | $1.01 | 23d | 1 | 0.64mi |
| 14101 Heimhome Bnd Pflugerville, TX | 4.0 | 2.5 | 1984 | $2,100 | $1.06 | 43d | 1 | 0.68mi |
| 2541 Forgetmenot Ln Pflugerville, TX | 4.0 | 2.5 | 2003 | $2,400 | $1.20 | 43d | 1 | 0.76mi |
| 2537 Forgetmenot Ln Pflugerville, TX | 3.0 | 2.0 | 1276 | $1,850 | $1.45 | 16d | 1 | 0.77mi |
| 13701 Sloan St Pflugerville, TX | 4.0 | 2.5 | 2121 | $2,705 | $1.28 | 43d | 1 | 0.83mi |
| 2601 Crystal Bend Dr Pflugerville, TX | 3.0–4.0 | 2.0–2.5 | 1761 | $2,372 | $1.35 | 1d | 1 | 0.86mi |
| 2916 Bronx Dr Pflugerville, TX | 4.0 | 2.5 | 2081 | $2,800 | $1.35 | 23d | 1 | 0.91mi |
| 1608 Purple Martin Dr Pflugerville, TX | 3.0 | 2.0 | 1470 | $2,200 | $1.50 | 23d | 1 | 0.94mi |
| 3304 Ortman Dr Pflugerville, TX | 3.0 | 2.5 | 1795 | $2,150 | $1.20 | 4d | 1 | 0.95mi |
| 2913 Saint Regis Dr Pflugerville, TX | 4.0 | 2.5 | 2157 | $2,200 | $1.02 | 21d | 1 | 0.98mi |
| 14708 Immanuel Rd Pflugerville, TX | 1.0–2.0 | 1.0–2.0 | 867 | $1,654 | $1.91 | 1d | 12 | 1.09mi |
| 2714 Towy Rd Pflugerville, TX | 3.0 | 2.0 | 1450 | $2,000 | $1.38 | 23d | 1 | 1.11mi |
| 2615 Derwent Dr Pflugerville, TX | 4.0 | 2.0 | 1468 | $2,195 | $1.50 | 2d | 1 | 1.11mi |
| 2612 Towy Rd Pflugerville, TX | 3.0 | 2.0 | 1533 | $2,195 | $1.43 | 4d | 1 | 1.14mi |
| 2710 Paragon Fox Dr Pflugerville, TX | 3.0 | 2.5 | 1796 | $2,300 | $1.28 | 43d | 1 | 1.17mi |
| 2702 Paragon Fox Dr Pflugerville, TX | 2.0 | 2.0 | 1320 | $1,900 | $1.44 | 43d | 1 | 1.18mi |
| 15409 Flowers Vw Pflugerville, TX | 4.0 | 3.0 | 2201 | $2,599 | $1.18 | 43d | 1 | 1.19mi |
| 2700 E Howard Ln Manor, TX | 2.0 | 1.0–2.0 | 890 | $1,819 | $2.04 | 1d | 52 | 1.20mi |
| 15421 Flowers Vw Pflugerville, TX | 3.0 | 2.0 | 1528 | $2,200 | $1.44 | 20d | 1 | 1.21mi |
| 2500 E Howard Ln Manor, TX | 3.0 | 1.0–3.5 | 1245 | $3,166 | $2.54 | 1d | 50 | 1.23mi |
| 2805 Totley Rd Pflugerville, TX | 3.0 | 2.0 | 1450 | $2,099 | $1.45 | 43d | 1 | 1.27mi |
| 13309 Riding Dr Pflugerville, TX | 4.0 | 2.0 | 1468 | $2,195 | $1.50 | 17d | 1 | 1.27mi |
| 2606 Totley Rd Pflugerville, TX | 3.0 | 2.0 | 1234 | $2,190 | $1.77 | 2d | 1 | 1.29mi |
| 4713 Canongate Dr Pflugerville, TX | 3.0 | 2.5 | 2099 | $2,199 | $1.05 | 23d | 1 | 1.33mi |
| 2908 E Howard Ln Manor, TX | 1.0–3.0 | 1.0–2.0 | 970 | $2,151 | $2.22 | 2d | 66 | 1.35mi |
| 3401 Bach Dr Unit 1 Pflugerville, TX | 3.0 | 2.0 | 1401 | $2,274 | $1.62 | 23d | 1 | 1.36mi |
| 3401 Bach Dr Pflugerville, TX | 3.0 | 2.0 | 1401 | $2,274 | $1.62 | 2d | 1 | 1.36mi |
| 1203 Pigeon Forge Rd Pflugerville, TX | 3.0 | 2.0 | 1858 | $2,400 | $1.29 | 23d | 1 | 1.37mi |
| 2500 E Howard Ln Unit 2533 Pflugerville, TX | 3.0 | 2.0 | 1537 | $2,124 | $1.38 | 2d | 1 | 1.39mi |
| 3009 Armidale Dr Pflugerville, TX | 3.0 | 2.0 | 2162 | $2,400 | $1.11 | 23d | 1 | 1.41mi |
Listing history 14 events
-
2026-06-18days on market $109,995 Active 34 DOM
-
2026-06-17days on market $109,995 Active 33 DOM
-
2026-06-16days on market $109,995 Active 32 DOM
-
2026-06-15days on market $109,995 Active 31 DOM
-
2026-06-13days on market $109,995 Active 29 DOM
-
2026-06-09days on market $109,995 Active 25 DOM
-
2026-06-08days on market $109,995 Active 24 DOM
-
2026-06-07days on market $109,995 Active 23 DOM
-
2026-06-05days on market $109,995 Active 20 DOM
-
2026-06-03days on market $109,995 Active 19 DOM
-
2026-06-02days on market $109,995 Active 18 DOM
-
2026-06-01days on market $109,995 Active 17 DOM
-
2026-05-31days on market $109,995 Active 16 DOM
-
2026-05-15$109,995 Active 892-char remark
ⓘ Source: listings_history table (triggers on properties + properties_extension) + one-shot
backfill from property_details.listing_events for pre-trigger history.
Climate risk First Street
- Flood 1/10 Low FEMA zone X (unshaded) · 0% chance over 30 yrs
- Wildfire 4/10 Moderate
- Heat 8/10 Severe 7 d/yr ≥108°F today · 24 d/yr by 30 yrs out
- Wind 8/10 Severe 80% chance of damaging wind over 30 yrs
- Air quality 2/10 Low 1 unhealthy d/yr today · 1 by 30 yrs out
Nearby sold comps map
Loading sold comps map…
Walkable amenities ~0.75 mi
Loading nearby amenities…
Taxation est. · year 1
- Rental income
- $24,982
- − Mortgage interest
- −$6,161
- − Property taxes
- −$1,650
- − Insurance
- −$550
- − Repairs & maintenance
- −$1,999
- − Management
- −$1,999
- − Depreciation
- −$3,200
- Taxable income
- $9,423
- Est. tax owed @ 24.0%
- −$2,262
- After-tax cash flow
- $8,352/yr
For passive investors: Depreciation is non-cash, so a rental often shows a tax loss while cash-flowing — sheltering income. Rental losses are passive: they offset passive income freely, and up to $25,000/yr can offset ordinary (W-2) income if you actively participate and your MAGI is under $100k (phasing out to $0 by $150k); unused losses carry forward. On sale, claimed depreciation is recaptured at up to 25%, and gains may owe capital-gains tax (a 1031 exchange can defer both). Figures are a year-1 estimate at your 24.0% rate — not tax advice; consult a CPA.
Condition & rehab AI · 2 photos
This brand-new manufactured home offers a fresh start with modern finishes and a thoughtful layout, making it a move-in-ready property with excellent condition and minimal maintenance needs.
Value-add opportunities
- Both Landscaping and curb appeal improvements — Enhancing the landscaping and curb appeal can increase both the resale and rental value of the home.
- Both Interior updates — Updating the interior can improve the home's appeal and functionality, making it more attractive to potential buyers and renters.
Renovation cost estimate screening
Value-add ROI direction
- Both Landscaping and curb appeal improvements — Enhancing the landscaping and curb appeal can increase both the resale and rental value of the home. ↑
- Both Interior updates — Updating the interior can improve the home's appeal and functionality, making it more attractive to potential buyers and renters. ↑
ⓘ Cost ranges are severity-bucket heuristics (US national rule-of-thumb). Get contractor quotes + a written scope before underwriting a rehab budget.
Schools (NCES district)
- District
- Pflugerville ISD
- NCES district ID
- 4834830
- Math proficiency
- 33% ▼ -16.00%
- Reading proficiency
- 42% ▼ -7.00%
- Median HH income
- $66,723
- Composite
- 33.99/100
- National rank
- #5321
- State rank
- #421 of 826 in TX
Livability — Austin
- Score
- 82/100
- State rank
- #16
- US rank
- #1208
Category grades
Schools grade is shown separately in the Schools card above.
Census & demographics
- County
- Travis County · 1,299,254 people
- City population
- 1,066,854
- Metro
- Austin-Round Rock-Georgetown, TX
- Population (ZIP)
- 124,834
- Household income
- $113,205
- Rent vs Own
- Severe rent burden
- 3347.0
Population outlook (Travis County) Hauer SSP2
- Today (2025)
- 1,545,133 people
- By 2030
- 1,729,269 · +11.9%
- By 2040
- 2,097,596 · +35.8%
- By 2050
- 2,463,890 · +59.5%
- By 2075
- 3,249,374 · +110.3%
- By 2100
- 3,801,868 · +146.1%
Race, ethnicity, and origin ACS 2023
- Neighborhood character
- Highly diverse neighborhood (Simpson 0.72)
- Race & ethnicity
- Hispanic / Latino 35% White 34% Two or more races 19% Black 16% Asian 10%
- Hispanic origin (detail)
- Mexican 25% Puerto Rican 2% Cuban 2%
- Common ancestry
- Lithuanian 4% Slovak 3% Italian 1%
- Foreign-born
- 18% · Canada, Vietnam, China
- Languages at home
- 69% English-only · Spanish 19% Other Indo-European 3% Vietnamese 3%
Political lean MEDSL · Travis
- 2024 margin
- Solid D (+39.3) · D 68.8% · R 29.4% · Other 1.8%
- 2008→2024 swing
- +9.9pp toward D · 2008: 29.4pp · 2024: 39.3pp
- All cycles
- 2024: D+39.3 2020: D+45.0 2016: D+38.9 2012: D+23.9 2008: D+29.4
Not yet ingested
- Civics
- —
Market trends
- HPI YoY
- ▼ -116.36%
- Current HPI
- 225.8781
- Rent YoY
- ▼ -2.03%
- Metro
- Austin-Round Rock-Georgetown, TX
- State GDP YoY
- ▲ 3.95%
- F500 in state
- 110
Industry mix (Fortune 500 HQ in TX)
| Industry | F500 HQs | Revenue |
|---|---|---|
| Energy | 16 | $1,198B |
|
||
| Technology | 5 | $198B |
|
||
| Engineering / Construction | 4 | $72B |
|
||
| Energy Services | 3 | $60B |
|
||
| Utilities | 3 | $41B |
|
||
| Healthcare | 2 | $330B |
|
||
Cash-flow waterfall
monthlySold comps — $/sqft
last 12 mo · ≤1 miLoading sold comps…