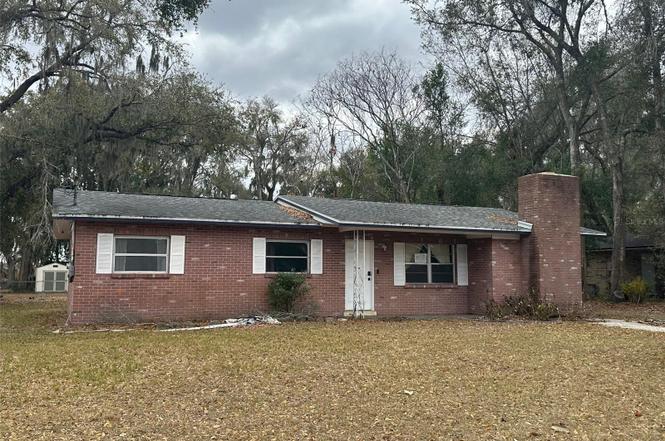
507 8th St SE · Fort Meade, FL
Flood risk 1/10 · Minimal
- FEMA flood zone
- X (unshaded)
- Chance of flooding over 30 yrs
- 0.0%
- Est. flood insurance / yr
- $507 – $1,088
Fire risk 4/10 · Minor
- Est. fire insurance / yr
- $947 – $1,759
Heat risk 8/10 · Major
- Hot days now (above 108°F)
- 4 days/yr
- Hot days in 30 yrs
- 15 days/yr
Wind risk 9/10 · Severe
- Chance of severe wind over 30 yrs
- 99.0%
Air-quality risk 2/10 · Minimal
- Unhealthy air days now
- 2 days/yr
- Unhealthy air days in 30 yrs
- 2 days/yr
Risk factors via First Street. Map © Google.
Why this score? — see what drove the D grade
The composite is a weighted blend of 9 inputs, each scored 0–100. Each bar is that input's sub-score; the figure is the points it added to the 100-point composite (weight × sub-score).
- Appreciation +10.0/10.0
- Cash flow +7.7/30.0
- ARV discount +7.5/15.0
- Schools +3.5/10.0
- 1% rule +3.2/10.0
- Livability +3.1/5.0
- Rent growth +2.5/5.0
- Condition / age +2.5/5.0
- DSCR +1.8/10.0
$149,900
🖨 Deal sheet (PDF) 📄 Offer letter ✓ Due diligence
Listing remarks
Under contract-accepting backup offers. Short Sale. United States Bankruptcy Sale. This is a lender initiated short sale through the United States Bankruptcy Court System. All offers are subject to Lender and Court Approval. SOLD AS-IS SUPER CUTE HOME with a clean-up needed but ALL the BIG-Ticket things are done! This 3 bedroom and easy could be made into a 4 bedroom and a den is Located in Historic Fort Meade in a quiet and peaceful neighborhood. Fenced backyard. Home has many upgrades and plenty of options. Inside Laundry, huge pantry, wood burning fireplace. No HOA, No Flood Zone and Priced to Sell All information, measurements and sizes are deemed to be accurate but not guaranteed, any
Key facts
- Huge pantry
- No flood zone
- Fenced backyard
Tags
Neighborhood map
What this means for you Summary
Snapshot
- This is a 3-bed/1.0-bath single-family listed at $150k.
Deal economics
- At list price, monthly cash flow is $-175 ($-2k/yr) — negative.
- To cash-flow at today's rent, offer at most $119k (20.6% below list).
- To meet the 1% rule (rent ≥ 1% of price), the offer needs to be $124k (17.6% below list).
- Recommended offer: $119k (20.6% below list) — sets the bar for cash-flow.
Location & tenants
- Location reads 61/100 on livability (#779 in FL) — a middle-class / working-renter tenant base. Strengths: cost of living A+, housing A+; Watch: schools D-, amenities F, commute F.
- Polk (suburban): math 39% / reading 43% proficiency, ranked #62 of 73 in FL (top 85%) — families likely to look elsewhere, expect single-tenant / working-renter base with shorter leases.
- Market conditions: 119 active listings in the ZIP; 3 comparable units currently listed for rent nearby; rentals at typical pace (median 25d on market — plan ~3-4 weeks tenant-placement turnaround); 10,384 units permitted in Polk County in 2024 (1,716 in 5+ unit buildings).
Forward outlook
- In year one you build about $16k of equity ($1k loan paydown + $15k appreciation (10.0% local appreciation)).
- Polk County population projected at +33% by 2050 — long-run rental-demand tailwind backs the buy-and-hold thesis.
- By year 3, paydown + projected appreciation supports a ~$41k cash-out refi (75% LTV) — recoverable capital for the next deal without selling this one.
Negotiation context
- It's been on market 39 days — a 3% lower offer ($145k) is reasonable based on typical stale-listing flexibility.
- 6 sale attempts since 4y ago; this cycle's ask has dropped $40k (21%) from the opening price — seller is motivated, your offer sets the floor, not the list.
Risks & watch-outs
- Climate carrying-cost: severe wind risk, 99% chance of damaging wind over 30y; extreme-heat days projected 4→15/yr by 2055 (HVAC capex compounding) — expect insurance premiums to compound above CPI over the hold.
Questions for the listing agent
- What do current leases actually rent for vs. the listed asking? Can we see a recent rent roll and the last 12 months of T-12 income?
- It's been on market 39 days. Have you received any prior offers? Is the seller open to a 21% concession, seller financing, or rate buy-down credit?
- Built in 1965 — when were the roof, HVAC, electrical panel, plumbing, and water heater last replaced?
- Is there a deadline driving the sale (1031 exchange, divorce, estate, relocation)? That informs how much negotiation room exists.
- Schools are D-rated, which usually means shorter tenancies and higher turnover. Who's the typical renter profile here, and what's been the actual vacancy rate?
- The area grade is low — what's the realistic commute time and amenity access for the typical tenant pool here? Any planned neighborhood developments (good or bad) we should know about?
- What's the average days-on-market for RENTAL listings here right now (not sales)? A rising rental-DOM trend means longer vacancies and softer asking-rent achievability than the comps imply.
- What's the recent tenant-quality profile in this submarket — average credit score on applications, eviction rate, late-payment / NSF rate, and stable-employment percentage? A property-management company in the area should have these aggregated.
- How much new for-sale + rental construction is in the pipeline within 1–3 miles? Heavy new supply typically softens prices + rents 12–24 months out; constrained supply supports both.
Investment metrics
- 1% rule
- 0.82% ✗
- Cap rate
- 4.89%
- Cash-on-cash
- -5.00%
- DSCR
- 0.78
- GRM
- 10.1
CMA / ARV
No comps found within radius.
Projected returns pro-forma
10.0% appreciation · 3.0% rent growth · sell at horizon
- IRR
- 20.8%
- Equity multiple
- 2.68×
- Total profit
- $70,594
- Equity at exit
- $135,042
- IRR
- 18.9%
- Equity multiple
- 6.17×
- Total profit
- $216,822
- Equity at exit
- $291,223
Cash invested: $41,972 (down + closing). Projections, not guarantees.
Landlord ↔ Tenant lean methodology
- Overall (STATE)
- 87 Strongly Landlord-Friendly
- State Florida
- 87 Strongly Landlord-Friendly · R+3
- County
- — inherits STATE
- City
- — inherits STATE
ZIP-level market 33841
- Home prices YoY
- 7.7%
- Active inventory
- 119
- Price-to-rent
- 10.1×
Monthly cashflow live
- Estimated rent
- $1,235 medium interval (Pro) →
- Mortgage (P&I)
- −$786
- Tax from tax record
- −$302 /mo · $3,627/yr
- Insurance
- −$62
- HOA
- −$0
- Vacancy / Maint / Mgmt
- −$259
- Net cashflow
- $-175
Break-even live
Sensitivity live
| Price | -10% $-90 | -5% $-132 | +0% $-175 | +5% $-217 | +10% $-260 |
|---|---|---|---|---|---|
| Rent | -10% $-272 | -5% $-224 | +0% $-175 | +5% $-126 | +10% $-77 |
| Rate | -1.0pp $-99 | -0.5pp $-137 | base $-175 | +0.5pp $-214 | +1.0pp $-253 |
UW: 25.0% down · 7.5% · 30yr · 1.5% tax · 5.0% vac · 8.0% maint · 8.0% mgmt
Financing live
Cash to close
- Down payment
- $37,475
- Closing costs
- $4,497
- Reserves months
- —
- Total cash needed
- —
Loan-product check · same deal, 3 products live
Conventional
25% down · 7.5% · 30yr
- Down + closing
- —
- Monthly P&I
- —
- Monthly cashflow
- —
- DSCR
- —
- Eligible?
- —
Personal DTI + credit; lowest rate.
DSCR
20% down · 8.5% · 30yr
- Down + closing
- —
- Monthly P&I
- —
- Monthly cashflow
- —
- DSCR
- —
- Eligible?
- —
No personal income docs; deal must DSCR.
Hard money
10% down · 12.0% · 12mo
- Down + closing
- —
- Monthly P&I
- —
- Monthly cashflow
- —
- DSCR
- —
- Eligible?
- —
Short-term bridge; refi at stabilization.
Rent comps 3 comps
| Address | Beds | Baths | Sqft | Rent | $/sqft | DOM | Units | Dist |
|---|---|---|---|---|---|---|---|---|
| 1165 Meadowlawn St Fort Meade, FL | 2.0 | 2.0 | 756 | $1,250 | $1.65 | 24d | 1 | 0.81mi |
| 1175 Meadowlawn St Fort Meade, FL | 3.0 | 2.0 | 756 | $1,325 | $1.75 | 24d | 1 | 0.82mi |
| 1155 Meadowlawn St Fort Meade, FL | 2.0 | 1.5 | 924 | $1,150 | $1.24 | 24d | 1 | 0.82mi |
Listing history 20 events
-
2026-04-28status Pending
-
2026-04-13price $149,900
-
2026-04-10status Active
-
2026-04-02status Pending
-
2026-03-11$189,900 Active
-
2025-07-16historical
-
2025-05-14status Active
-
2025-04-24status Pending
-
2025-04-15price $220,000
-
2025-02-17$230,000 Active
-
2024-09-24price $240,000
-
2024-08-20price $249,000
-
2024-07-12$265,000 Active
-
2022-11-15soldstatus $223,400
-
2022-11-10soldstatus $223,400 Closed
-
2022-10-16status Pending
-
2022-10-13price $218,900
-
2022-09-25$229,900 Active
-
1987-07-01soldstatus $37,000
-
1979-03-01soldstatus $9,500
ⓘ Source: listings_history table (triggers on properties + properties_extension) + one-shot
backfill from property_details.listing_events for pre-trigger history.
Tax reassessment forecast FL · Resets to sale price
- Current annual tax
- $3,627 · $302/mo
- Projected year-2 tax
- $3,627 · $302/mo
- Expected delta
- $0/yr ($0/mo · 0.0%)
ⓘ Screening estimate from a state-policy table — verify with the county assessor before closing.
Climate risk First Street
- Flood 1/10 Low FEMA zone X (unshaded) · 0% chance over 30 yrs
- Wildfire 4/10 Moderate
- Heat 8/10 Severe 4 d/yr ≥108°F today · 15 d/yr by 30 yrs out
- Wind 9/10 Extreme 99% chance of damaging wind over 30 yrs
- Air quality 2/10 Low 2 unhealthy d/yr today · 2 by 30 yrs out
Nearby sold comps map
Loading sold comps map…
Walkable amenities ~0.75 mi
Loading nearby amenities…
Taxation est. · year 1
- Rental income
- $14,825
- − Mortgage interest
- −$8,397
- − Property taxes
- −$3,627
- − Insurance
- −$750
- − Repairs & maintenance
- −$1,186
- − Management
- −$1,186
- − Depreciation
- −$4,361
- Taxable loss
- −$4,681
- Est. tax savings @ 24.0%
- +$1,123
- After-tax cash flow
- $-974/yr
For passive investors: Depreciation is non-cash, so a rental often shows a tax loss while cash-flowing — sheltering income. Rental losses are passive: they offset passive income freely, and up to $25,000/yr can offset ordinary (W-2) income if you actively participate and your MAGI is under $100k (phasing out to $0 by $150k); unused losses carry forward. On sale, claimed depreciation is recaptured at up to 25%, and gains may owe capital-gains tax (a 1031 exchange can defer both). Figures are a year-1 estimate at your 24.0% rate — not tax advice; consult a CPA.
Schools (NCES district)
- District
- Polk
- NCES district ID
- 1201590
- Math proficiency
- 39% ▼ -11.00%
- Reading proficiency
- 43% ▼ -4.00%
- Median HH income
- $43,979
- Composite
- 34.74/100
- National rank
- #5132
- State rank
- #62 of 73 in FL
Livability — Fort Meade
- Score
- 61/100
- State rank
- #779
- US rank
- #17625
Category grades
Schools grade is shown separately in the Schools card above.
Census & demographics
- Census place
- Fort Meade, FL
- Population (ZIP)
- 8,268
Population outlook (Polk County) Hauer SSP2
- Today (2025)
- 752,975 people
- By 2030
- 804,621 · +6.9%
- By 2040
- 906,117 · +20.3%
- By 2050
- 1,000,476 · +32.9%
- By 2075
- 1,197,520 · +59.0%
- By 2100
- 1,271,518 · +68.9%
Race, ethnicity, and origin ACS 2023
- Neighborhood character
- Diverse neighborhood (Simpson 0.59)
- Race & ethnicity
- White 50% Hispanic / Latino 38% Two or more races 13% Black 9%
- Hispanic origin (detail)
- Mexican 32% Puerto Rican 3%
- Common ancestry
- Slovak 1% Lithuanian 1%
- Foreign-born
- 11% · Canada, Jamaica
- Languages at home
- 70% English-only · Spanish 30%
Political lean MEDSL · Polk
- 2024 margin
- Strong R (+20.7) · D 39.2% · R 59.9%
- 2008→2024 swing
- -14.6pp toward R · 2008: -6.1pp · 2024: -20.7pp
- All cycles
- 2024: R+20.7 2020: R+14.4 2016: R+14.1 2012: R+6.8 2008: R+6.1
Not yet ingested
- Civics
- —
Market trends
- HPI YoY
- ▲ 26.92%
- Current HPI
- 376.8183
- Rent YoY
- —
- Metro
- —
- State GDP YoY
- ▲ 3.28%
- F500 in state
- 36
Industry mix (Fortune 500 HQ in FL)
| Industry | F500 HQs | Revenue |
|---|---|---|
| Industrial Technology | 2 | $29B |
|
||
| Insurance | 2 | $17B |
|
||
| Retail | 1 | $60B |
|
||
| Technology Distribution | 1 | $58B |
|
||
| Homebuilding | 1 | $35B |
|
||
| Technology Manufacturing | 1 | $35B |
|
||
Price history
+1477.9% since first listed20 events — show timeline
- 2026-04-28 Pending — Stellar MLS as Distributed by MLS Grid
- 2026-04-13 Price Changed $149,900 Stellar MLS as Distributed by MLS Grid
- 2026-04-10 Relisted — Stellar MLS as Distributed by MLS Grid
- 2026-04-02 Pending — Stellar MLS as Distributed by MLS Grid
- 2026-03-11 Listed $189,900 Stellar MLS as Distributed by MLS Grid
- 2025-07-16 Listing Removed — Stellar MLS as Distributed by MLS Grid
- 2025-05-14 Relisted — Stellar MLS as Distributed by MLS Grid
- 2025-04-24 Pending — Stellar MLS as Distributed by MLS Grid
- 2025-04-15 Price Changed $220,000 Stellar MLS as Distributed by MLS Grid
- 2025-02-17 Listed $230,000 Stellar MLS as Distributed by MLS Grid
- 2024-09-24 Price Changed $240,000 Stellar MLS as Distributed by MLS Grid
- 2024-08-20 Price Changed $249,000 Stellar MLS as Distributed by MLS Grid
- 2024-07-12 Listed $265,000 Stellar MLS as Distributed by MLS Grid
- 2022-11-15 Sold (Public Records) $223,400 Public Records
- 2022-11-10 Sold (MLS) $223,400 Stellar MLS as Distributed by MLS Grid
- 2022-10-16 Pending — Stellar MLS as Distributed by MLS Grid
- 2022-10-13 Price Changed $218,900 Stellar MLS as Distributed by MLS Grid
- 2022-09-25 Listed $229,900 Stellar MLS as Distributed by MLS Grid
- 1987-07-01 Sold (Public Records) $37,000 Public Records
- 1979-03-01 Sold (Public Records) $9,500 Public Records
Property tax history
+11.6%/yrLatest (2025): $3,627 · -3.4% YoY. Source: county tax records.
Cash-flow waterfall
monthlySold comps — $/sqft
last 12 mo · ≤1 miLoading sold comps…