3465 Camino Rd · Hayes, MI
Flood risk No data
- FEMA flood zone
- —
- Chance of flooding over 30 yrs
- —
- Est. flood insurance / yr
- —
Fire risk No data
- Est. fire insurance / yr
- —
Heat risk No data
- Hot days now (above threshold)
- —
- Hot days in 30 yrs
- —
Wind risk No data
- Chance of severe wind over 30 yrs
- —
Air-quality risk No data
- Unhealthy air days now
- —
- Unhealthy air days in 30 yrs
- —
Risk factors via First Street. Map © Google.
Why this score? — see what drove the B- grade
The composite is a weighted blend of 9 inputs, each scored 0–100. Each bar is that input's sub-score; the figure is the points it added to the 100-point composite (weight × sub-score).
- Cash flow +26.4/30.0
- ARV discount +15.0/15.0
- DSCR +9.0/10.0
- 1% rule +6.5/10.0
- Rent growth +2.5/5.0
- Livability +2.5/5.0
- Condition / age +2.5/5.0
- Schools +1.8/10.0
- Appreciation +0.0/10.0
$75,000
🖨 Deal sheet 📄 Offer letter ✓ Due diligence
Listing remarks
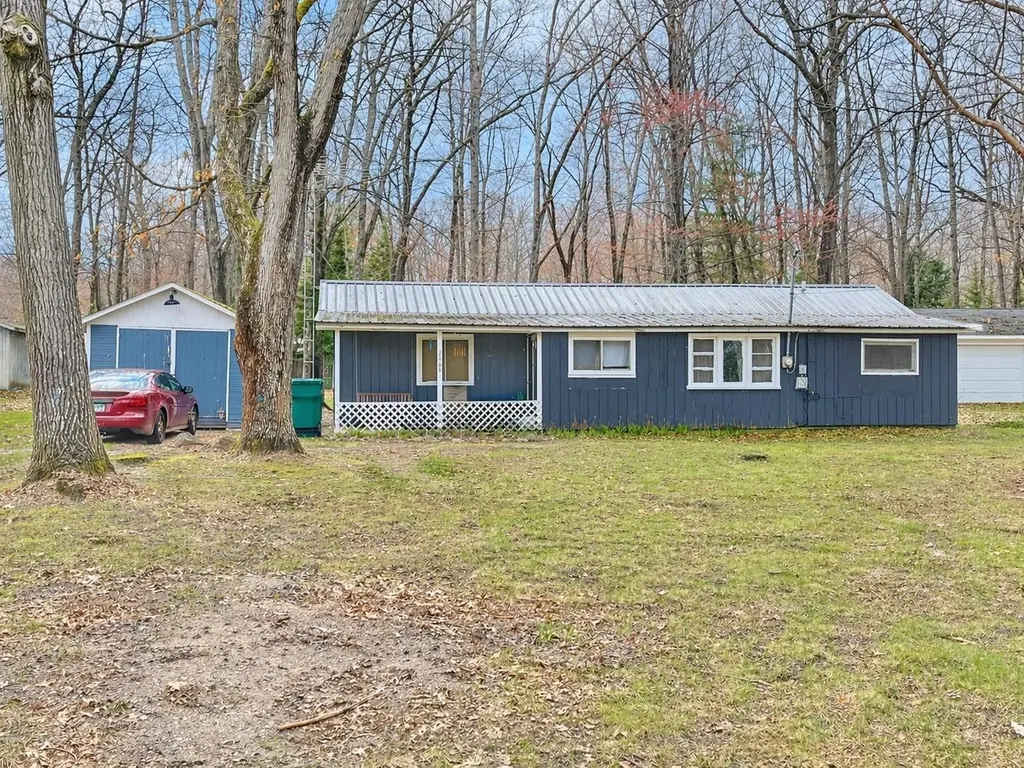
Escape to the heart of Northern Michigan with this 2-bedroom home set on nearly half an acre, just about 2.5 hours from Detroit. Whether you’re looking for a weekend getaway or a full-time residence, this property offers the perfect balance of space, privacy, and outdoor access. The home features a durable metal roof and a functional layout, ready for your personal touches. With a little TLC and some updates, this could easily become your ideal Up North retreat. Enjoy the expansive yard—perfect for relaxing, entertaining, or storing outdoor gear. Located just a short drive from trails, lakes, and endless recreational opportunities, this property is a great base camp for all seas
Key facts
- Metal roof
- Expansive yard
- Outdoor access
Tags
Property features AI
Exterior
- Parking: Detached garage (12 x 20), one garage parking space
- Utilities: Private well water; Septic sewer
- Home design: Residential single-story home; Built in 1961; Entry on main level
- Construction: Wood construction; Slab foundation; 1961 construction
- Exterior features: Wood exterior; Road frontage
Interior
- Bedrooms: Two bedrooms on the main level (approx. 12 x 11 and 19 x 8)
- Bathrooms: One full bathroom on the main level
- Heating & cooling: Floor furnace heating; Natural gas fuel
- Interior features: Single-level living (main floor); Living room (dimensions noted in listing)
Neighborhood map
What this means for you Summary
Snapshot
- This is a 2-bed/1.0-bath single-family listed at $75k.
Deal economics
- At list price, monthly cash flow is $195 ($2k/yr) — positive.
- The deal already cash-flows at list — no discount required.
- Meets the 1% rule at list price ($863 rent vs $75k).
- Recommended offer: $73k (3.0% below list) — sets the bar for market timing.
Location & tenants
- Location reads: area grade B — affects rentability + tenant quality, not the cash-flow math above.
- Harrison Community Schools (town): math 17% / reading 28% proficiency, ranked #457 of 540 in MI (top 85%) — low school quality limits family demand, transient renter base, plan for 1-2y turnover; 65% free/reduced lunch — lower-income household profile, screen leases tightly.
- Market conditions: 238 active listings in the ZIP; 77 units permitted in Clare County in 2024 (0 in 5+ unit buildings).
Forward outlook
- Local home prices are declining (-3.0%/yr); year-one equity from $519 of loan paydown is wiped out by about $2k of value loss. Plan a longer hold.
- Clare County population projected at -20% by 2050 — secular population decline; favor cash flow + early exit over multi-decade hold.
- At projected returns (-3.0% appreciation + 3.0% rent growth), your $21k cash investment doubles in ~10 years — after that, you're playing with house money.
Negotiation context
- It's been on market 55 days — a 3% lower offer ($73k) is reasonable based on typical stale-listing flexibility.
- 7 sale attempts since 17y ago; this cycle's ask has dropped $74.92M (100%) from the opening price — seller is motivated, your offer sets the floor, not the list.
Questions for the listing agent
- It's been on market 55 days. Have you received any prior offers? Is the seller open to a 3% concession, seller financing, or rate buy-down credit?
- Built in 1961 — when were the roof, HVAC, electrical panel, plumbing, and water heater last replaced?
- Is there a deadline driving the sale (1031 exchange, divorce, estate, relocation)? That informs how much negotiation room exists.
- What's the average days-on-market for RENTAL listings here right now (not sales)? A rising rental-DOM trend means longer vacancies and softer asking-rent achievability than the comps imply.
- What's the recent tenant-quality profile in this submarket — average credit score on applications, eviction rate, late-payment / NSF rate, and stable-employment percentage? A property-management company in the area should have these aggregated.
- How much new for-sale + rental construction is in the pipeline within 1–3 miles? Heavy new supply typically softens prices + rents 12–24 months out; constrained supply supports both.
Investment metrics
- 1% rule
- 1.15% ✓
- Cap rate
- 9.41%
- Cash-on-cash
- 11.15%
- DSCR
- 1.50
- GRM
- 7.2
CMA / ARV
- ARV (median comp)
- $103,180
- List price
- $75,000
- Delta
- -27.31%
- Verdict
- UNDERPRICED
- Comps
- 20 within 1.0 mi
Show comp detail 5 sales within ~0.75 mi
| Address | Dist | Beds/Ba | Sqft | Sold | Price | $/sf | Match |
|---|---|---|---|---|---|---|---|
| 3408 Niemi St | 0.08mi | 2/1.0 | 760 (-8%) | 8mo | $30,000 | $39 | 76 |
| 3784 Camino Rd | 0.32mi | 2/1.0 | 840 (+2%) | 10mo | $76,000 | $90 | 74 |
| 2111 Timber Lane Rd | 0.52mi | 2/1.0 | 836 (+1%) | 13mo | $133,000 | $159 | 63 |
| 2068 & 2098 Timber Ln | 0.45mi | 2/1.0 | 720 (-13%) | 3mo | $55,000 | $76 | 55 |
| 3280 N Harrison Ave | 0.61mi | 3/1.0 (+1) | 870 (+5%) | 24mo | $144,000 | $166 | 38 |
Match score weights: distance 35% · size 25% · config 20% · recency 20%. Top-matched comps best support the ARV.
Projected returns pro-forma
-3.0% appreciation · 3.0% rent growth · sell at horizon
- IRR
- 0.3%
- Equity multiple
- 1.01×
- Total profit
- $264
- Equity at exit
- $11,183
- IRR
- 10.0%
- Equity multiple
- 1.77×
- Total profit
- $16,203
- Equity at exit
- $6,485
Cash invested: $21,000 (down + closing). Projections, not guarantees.
Landlord ↔ Tenant lean methodology
- Overall (STATE)
- 62 Landlord-Friendly
- State Michigan
- 62 Landlord-Friendly · EVEN
- County
- — inherits STATE
- City
- — inherits STATE
ZIP-level market 48625
- Home prices YoY
- -25.5%
- Active inventory
- 238
- Price-to-rent
- 7.2×
Monthly cashflow live
- Estimated rent
- $863 medium interval (Pro) →
- Mortgage (P&I)
- −$393
- Tax from tax record
- −$63 /mo · $750/yr
- Insurance
- −$31
- HOA
- −$0
- Vacancy / Maint / Mgmt
- −$181
- Net cashflow
- $195
Break-even live
UW: 25.0% down · 7.5% · 30yr · 1.5% tax · 5.0% vac · 8.0% maint · 8.0% mgmt
Financing live
Cash to close
- Down payment
- $18,750
- Closing costs
- $2,250
- Reserves months
- —
- Total cash needed
- —
Loan-product check · same deal, 3 products live
Conventional
25% down · 7.5% · 30yr
- Down + closing
- —
- Monthly P&I
- —
- Monthly cashflow
- —
- DSCR
- —
- Eligible?
- —
Personal DTI + credit; lowest rate.
DSCR
20% down · 8.5% · 30yr
- Down + closing
- —
- Monthly P&I
- —
- Monthly cashflow
- —
- DSCR
- —
- Eligible?
- —
No personal income docs; deal must DSCR.
Hard money
10% down · 12.0% · 12mo
- Down + closing
- —
- Monthly P&I
- —
- Monthly cashflow
- —
- DSCR
- —
- Eligible?
- —
Short-term bridge; refi at stabilization.
Listing history 28 events
-
2026-06-18days on market $75,000 Active 55 DOM
-
2026-06-17days on market $75,000 Active 54 DOM
-
2026-06-16days on market $75,000 Active 53 DOM
-
2026-06-15days on market $75,000 Active 52 DOM
-
2026-06-13days on market $75,000 Active 50 DOM
-
2026-06-12days on market $75,000 Active 49 DOM
-
2026-06-09days on market $75,000 Active 46 DOM
-
2026-06-08days on market $75,000 Active 45 DOM
-
2026-06-07days on market $75,000 Active 44 DOM
-
2026-06-07days on market $75,000 Active 43 DOM
-
2026-06-04days on market $75,000 Active 40 DOM
-
2026-06-02days on market $75,000 Active 39 DOM
-
2026-06-01days on market $75,000 Active 38 DOM
-
2026-05-31days on market $75,000 Active 37 DOM
-
2026-05-31days on market $75,000 Active 36 DOM
-
2026-05-02historical Accepting Backup Offers 868-char remark
-
2026-04-25price $75,000 868-char remark
-
2026-04-23$75,000,000 Active 868-char remark
-
2021-04-04historical
-
2020-10-03$43,000
-
2018-05-27historical
-
2017-05-27$37,900
-
2016-11-10historical
-
2016-11-10historical
-
2016-05-10$37,900
-
2016-05-10$37,900
-
2009-08-15historical
-
2009-02-05$19,500
ⓘ Source: listings_history table (triggers on properties + properties_extension) + one-shot
backfill from property_details.listing_events for pre-trigger history.
Tax reassessment forecast MI · Partial reset (capped growth)
- Current annual tax
- $750 · $63/mo
- Projected year-2 tax
- $953 · $79/mo
- Expected delta
- +$202/yr (+$17/mo · 27.0%)
ⓘ Screening estimate from a state-policy table — verify with the county assessor before closing.
Nearby sold comps map
Loading sold comps map…
Walkable amenities ~0.75 mi
Loading nearby amenities…
Taxation est. · year 1
- Rental income
- $10,362
- − Mortgage interest
- −$4,201
- − Property taxes
- −$750
- − Insurance
- −$375
- − Repairs & maintenance
- −$829
- − Management
- −$829
- − Depreciation
- −$2,182
- Taxable income
- $1,196
- Est. tax owed @ 24.0%
- −$287
- After-tax cash flow
- $2,054/yr
For passive investors: Depreciation is non-cash, so a rental often shows a tax loss while cash-flowing — sheltering income. Rental losses are passive: they offset passive income freely, and up to $25,000/yr can offset ordinary (W-2) income if you actively participate and your MAGI is under $100k (phasing out to $0 by $150k); unused losses carry forward. On sale, claimed depreciation is recaptured at up to 25%, and gains may owe capital-gains tax (a 1031 exchange can defer both). Figures are a year-1 estimate at your 24.0% rate — not tax advice; consult a CPA.
Schools (NCES district)
- District
- Harrison Community Schools
- NCES district ID
- 2617820
- Math proficiency
- 17% ▬ 0.00%
- Reading proficiency
- 28% ▼ -5.00%
- Median HH income
- $30,377
- Composite
- 18.07/100
- National rank
- #8977
- State rank
- #457 of 540 in MI
Livability — Hayes
No livability data for this city. (Only ~50 U.S. cities are tracked.)
Census & demographics
- Population (ZIP)
- 12,939
Population outlook (Clare County) Hauer SSP2
- Today (2025)
- 29,283 people
- By 2030
- 28,199 · -3.7%
- By 2040
- 25,722 · -12.2%
- By 2050
- 23,372 · -20.2%
- By 2075
- 18,569 · -36.6%
- By 2100
- 14,320 · -51.1%
Race, ethnicity, and origin ACS 2023
- Neighborhood character
- Predominantly White (93%)
- Race & ethnicity
- White 93% Two or more races 4% Hispanic / Latino 3%
- Common ancestry
- Romanian 6% Lithuanian 4% Scotch-Irish 2%
- Foreign-born
- 0%
- Languages at home
- 99% English-only · Spanish 1% German/W. Germanic 1%
Political lean MEDSL · Clare
- 2024 margin
- Solid R (+37.6) · D 30.5% · R 68.1% · Other 1.4%
- 2008→2024 swing
- -42.4pp toward R · 2008: 4.8pp · 2024: -37.6pp
- All cycles
- 2024: R+37.6 2020: R+34.8 2016: R+31.8 2012: R+4.8 2008: D+4.8
Not yet ingested
- Civics
- —
Market trends
- HPI YoY
- ▼ -80.38%
- Current HPI
- 234.9586
- Rent YoY
- —
- Metro
- —
- State GDP YoY
- ▲ 1.37%
- F500 in state
- 28
Industry mix (Fortune 500 HQ in MI)
| Industry | F500 HQs | Revenue |
|---|---|---|
| Automotive Parts | 3 | $48B |
|
||
| Automotive | 2 | $372B |
|
||
| Chemicals | 1 | $45B |
|
||
| Automotive Retail | 1 | $29B |
|
||
| Healthcare / Medical Devices | 1 | $23B |
|
||
| Automotive Technology | 1 | $20B |
|
||
Price history
+284.6% since first listed14 events — show timeline
- 2026-05-20 Relisted — MiRealSource-MiMLS
- 2026-05-02 Contingent — MiRealSource-MiMLS
- 2026-04-25 Price Changed $75,000 MiRealSource-MiMLS
- 2026-04-23 Listed $75,000,000 MiRealSource-MiMLS
- 2021-04-04 Listing Removed — MiRealSource-MiMLS
- 2020-10-03 Listed $43,000 MiRealSource-MiMLS
- 2018-05-27 Listing Removed — MiRealSource-MiMLS
- 2017-05-27 Listed $37,900 MiRealSource-MiMLS
- 2016-11-10 Listing Removed — REALCOMP
- 2016-11-10 Listing Removed — MiRealSource-MiMLS
- 2016-05-10 Listed $37,900 REALCOMP
- 2016-05-10 Listed $37,900 MiRealSource-MiMLS
- 2009-08-15 Listing Removed — MiRealSource-MiMLS
- 2009-02-05 Listed $19,500 MiRealSource-MiMLS
Property tax history
+3.7%/yrLatest (2025): $750 · +4.5% YoY. Source: county tax records.
Cash-flow waterfall
monthlySold comps — $/sqft
last 12 mo · ≤1 miLoading sold comps…