619 W Elm St · Aurora, MO
Flood risk 1/10 · Minimal
- FEMA flood zone
- X (unshaded)
- Chance of flooding over 30 yrs
- 0.0%
- Est. flood insurance / yr
- $507 – $1,088
Fire risk 3/10 · Minor
- Est. fire insurance / yr
- $1,054 – $1,958
Heat risk 5/10 · Moderate
- Hot days now (above 104°F)
- 7 days/yr
- Hot days in 30 yrs
- 19 days/yr
Wind risk 2/10 · Minimal
- Chance of severe wind over 30 yrs
- 1.0%
Air-quality risk 1/10 · Minimal
- Unhealthy air days now
- 0 days/yr
- Unhealthy air days in 30 yrs
- 0 days/yr
Risk factors via First Street. Map © Google.
Why this score? — see what drove the D- grade
The composite is a weighted blend of 9 inputs, each scored 0–100. Each bar is that input's sub-score; the figure is the points it added to the 100-point composite (weight × sub-score).
- Cash flow +12.1/30.0
- ARV discount +7.5/15.0
- DSCR +3.6/10.0
- Schools +2.8/10.0
- Livability +2.8/5.0
- 1% rule +2.6/10.0
- Rent growth +2.5/5.0
- Condition / age +2.5/5.0
- Appreciation +0.0/10.0
$124,900
🖨 Deal sheet (PDF) 📄 Offer letter ✓ Due diligence
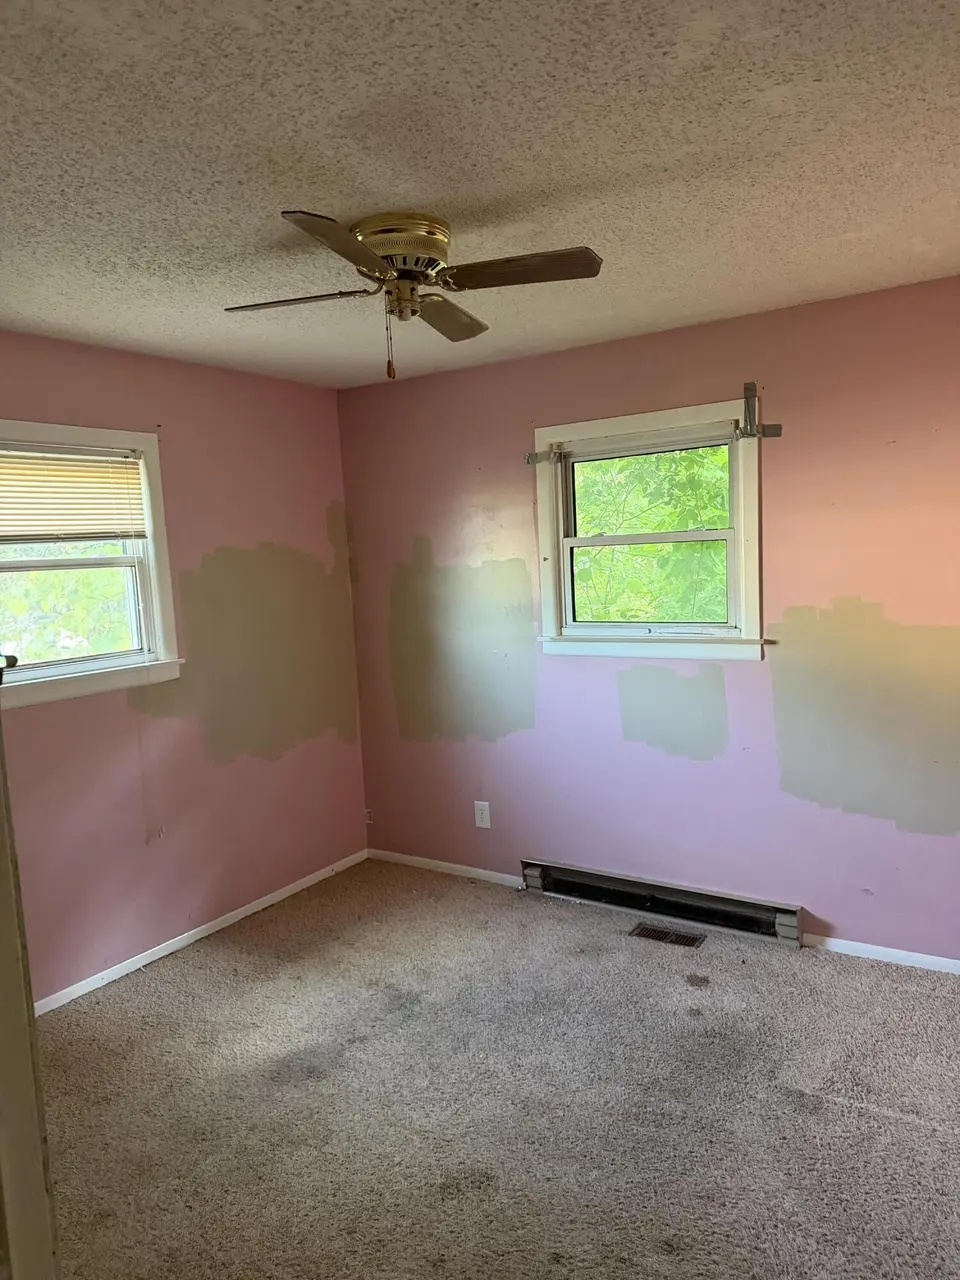
Listing remarks
Are you looking for a home at a cheaper price that you can put your own touches on or looking for a flip house, this is the one for you. House is being sold as is. Unaware of heating and cooling sources and if they're operational.
Key facts
- 0.26 acre lot
- Garage
- Built 1977
Property features AI
Exterior
- Parking: 1-car garage
- Utilities: Public water; Public sewer
- Home design: Single-family residence; One level
- Construction: Built area includes 1,404 sq. ft. above grade; Total building area listed as 2,808 sq. ft.
- Exterior features: Public maintained road frontage on a city street; Lot dimensions approximately 84.3 x 132; Lot about 0.26 acres
Interior
- Bathrooms: 1 full bathroom; 1 half bathroom
- Heating & cooling: No heating; No cooling
- Interior features: Has a view
Neighborhood map
What this means for you Summary
Snapshot
- This is a 3-bed/1.0-bath other listed at $125k.
Deal economics
- At list price, monthly cash flow is $-27 ($-329/yr) — negative.
- To cash-flow at today's rent, offer at most $120k (3.9% below list).
- To meet the 1% rule (rent ≥ 1% of price), the offer needs to be $95k (23.9% below list).
- Recommended offer: $95k (23.9% below list) — sets the bar for 1% rule.
- Cap rate 6.0% vs local median 4.0% in Aurora — top-decile yield for the area; either an underpriced asset or a hidden risk that comps aren't pricing in. Stress-test before assuming the spread holds.
Location & tenants
- Location reads 56/100 on livability (#710 in MO) — a working-class tenant base; expect higher turnover. Strengths: cost of living A+, housing A+; Watch: crime F, amenities F, commute F.
- Aurora R-VIII (town): math 30% / reading 37% proficiency, ranked #244 of 324 in MO (top 75%) — families likely to look elsewhere, expect single-tenant / working-renter base with shorter leases.
- Zoned schools: Pate Early Childhood Ctr. (497 students, 66% FRL); Aurora Jr. High (math 23% / reading 27%, grade F, #321 of 391 statewide, top 82%, 283 students, 62% FRL); Aurora High (math 37% / reading 47%, grade F, #218 of 521 statewide, top 45%, 573 students, 58% FRL).
- Market conditions: 140 active listings in the ZIP; 2 comparable units currently listed for rent nearby; 67 units permitted in Lawrence County in 2024 (35 in 5+ unit buildings).
Forward outlook
- Local home prices are declining (-3.0%/yr); year-one equity from $864 of loan paydown is wiped out by about $4k of value loss. Plan a longer hold.
- Lawrence County population projected at -15% by 2050 — secular population decline; favor cash flow + early exit over multi-decade hold.
Negotiation context
- It's been on market 27 days — a 2% lower offer ($123k) is reasonable based on typical stale-listing flexibility.
Risks & watch-outs
- Climate carrying-cost: extreme-heat days projected 7→19/yr by 2055 (HVAC capex compounding) — expect insurance premiums to compound above CPI over the hold.
Questions for the listing agent
- What do current leases actually rent for vs. the listed asking? Can we see a recent rent roll and the last 12 months of T-12 income?
- Built in 1977 — when were the roof, HVAC, electrical panel, plumbing, and water heater last replaced?
- Is there a deadline driving the sale (1031 exchange, divorce, estate, relocation)? That informs how much negotiation room exists.
- Schools are D-rated, which usually means shorter tenancies and higher turnover. Who's the typical renter profile here, and what's been the actual vacancy rate?
- Crime grade is F in this area — have there been break-ins, vandalism, or insurance claims at this property in the last 3 years? What carrier currently insures it and at what premium?
- The area grade is low — what's the realistic commute time and amenity access for the typical tenant pool here? Any planned neighborhood developments (good or bad) we should know about?
- What's the average days-on-market for RENTAL listings here right now (not sales)? A rising rental-DOM trend means longer vacancies and softer asking-rent achievability than the comps imply.
- What's the recent tenant-quality profile in this submarket — average credit score on applications, eviction rate, late-payment / NSF rate, and stable-employment percentage? A property-management company in the area should have these aggregated.
- How much new for-sale + rental construction is in the pipeline within 1–3 miles? Heavy new supply typically softens prices + rents 12–24 months out; constrained supply supports both.
Investment metrics
- 1% rule
- 0.76% ✗
- Cap rate
- 6.03%
- Cash-on-cash
- -0.94%
- DSCR
- 0.96
- GRM
- 11.0
CMA / ARV
No comps found within radius.
Projected returns pro-forma
-3.0% appreciation · 3.0% rent growth · sell at horizon
- IRR
- -17.9%
- Equity multiple
- 0.37×
- Total profit
- $-22,025
- Equity at exit
- $18,623
- IRR
- -10.1%
- Equity multiple
- 0.38×
- Total profit
- $-21,584
- Equity at exit
- $10,799
Cash invested: $34,972 (down + closing). Projections, not guarantees.
Landlord ↔ Tenant lean methodology
- Overall (STATE)
- 81 Strongly Landlord-Friendly
- State Missouri
- 81 Strongly Landlord-Friendly · R+10
- County
- — inherits STATE
- City
- — inherits STATE
ZIP-level market 65605
- Home prices YoY
- -4.5%
- Active inventory
- 140
- Price-to-rent
- 11.0×
Monthly cashflow live
- Estimated rent
- $950 medium interval (Pro) →
- Mortgage (P&I)
- −$655
- Tax from tax record
- −$71 /mo · $851/yr
- Insurance
- −$52
- HOA
- −$0
- Vacancy / Maint / Mgmt
- −$200
- Net cashflow
- $-27
Break-even live
Sensitivity live
| Price | -10% $43 | -5% $8 | +0% $-27 | +5% $-63 | +10% $-98 |
|---|---|---|---|---|---|
| Rent | -10% $-102 | -5% $-65 | +0% $-27 | +5% $10 | +10% $48 |
| Rate | -1.0pp $35 | -0.5pp $4 | base $-27 | +0.5pp $-60 | +1.0pp $-93 |
UW: 25.0% down · 7.5% · 30yr · 1.5% tax · 5.0% vac · 8.0% maint · 8.0% mgmt
Financing live
Cash to close
- Down payment
- $31,225
- Closing costs
- $3,747
- Reserves months
- —
- Total cash needed
- —
Loan-product check · same deal, 3 products live
Conventional
25% down · 7.5% · 30yr
- Down + closing
- —
- Monthly P&I
- —
- Monthly cashflow
- —
- DSCR
- —
- Eligible?
- —
Personal DTI + credit; lowest rate.
DSCR
20% down · 8.5% · 30yr
- Down + closing
- —
- Monthly P&I
- —
- Monthly cashflow
- —
- DSCR
- —
- Eligible?
- —
No personal income docs; deal must DSCR.
Hard money
10% down · 12.0% · 12mo
- Down + closing
- —
- Monthly P&I
- —
- Monthly cashflow
- —
- DSCR
- —
- Eligible?
- —
Short-term bridge; refi at stabilization.
Rent comps 2 comps
| Address | Beds | Baths | Sqft | Rent | $/sqft | DOM | Units | Dist |
|---|---|---|---|---|---|---|---|---|
| 730 E Springfield St Aurora, MO | 2.0 | 1.0 | 900 | $950 | $1.06 | 25d | 1 | 1.15mi |
| 221 N Park Ave Unit B Aurora, MO | 2.0 | 1.0 | 1000 | $950 | $0.95 | 15d | 1 | 1.36mi |
Listing history 9 events
-
2026-06-08days on market $124,900 Active 27 DOM
-
2026-06-07days on market $124,900 Active 26 DOM
-
2026-06-07days on market $124,900 Active 25 DOM
-
2026-06-04days on market $124,900 Active 22 DOM
-
2026-06-02days on market $124,900 Active 21 DOM
-
2026-06-01days on market $124,900 Active 20 DOM
-
2026-05-31days on market $124,900 Active 19 DOM
-
2026-05-31days on market $124,900 Active 18 DOM
-
2026-05-12$149,900 Active 230-char remark
ⓘ Source: listings_history table (triggers on properties + properties_extension) + one-shot
backfill from property_details.listing_events for pre-trigger history.
Tax reassessment forecast MO · Resets to sale price
- Current annual tax
- $851 · $71/mo
- Projected year-2 tax
- $1,212 · $101/mo
- Expected delta
- +$361/yr (+$30/mo · 42.4%)
ⓘ Screening estimate from a state-policy table — verify with the county assessor before closing.
Climate risk First Street
- Flood 1/10 Low FEMA zone X (unshaded) · 0% chance over 30 yrs
- Wildfire 3/10 Moderate
- Heat 5/10 Major 7 d/yr ≥104°F today · 19 d/yr by 30 yrs out
- Wind 2/10 Low 100% chance of damaging wind over 30 yrs
- Air quality 1/10 Low 0 unhealthy d/yr today · 0 by 30 yrs out
Nearby sold comps map
Loading sold comps map…
Walkable amenities ~0.75 mi
Loading nearby amenities…
Taxation est. · year 1
- Rental income
- $11,400
- − Mortgage interest
- −$6,996
- − Property taxes
- −$851
- − Insurance
- −$624
- − Repairs & maintenance
- −$912
- − Management
- −$912
- − Depreciation
- −$3,633
- Taxable loss
- −$2,529
- Est. tax savings @ 24.0%
- +$607
- After-tax cash flow
- $278/yr
For passive investors: Depreciation is non-cash, so a rental often shows a tax loss while cash-flowing — sheltering income. Rental losses are passive: they offset passive income freely, and up to $25,000/yr can offset ordinary (W-2) income if you actively participate and your MAGI is under $100k (phasing out to $0 by $150k); unused losses carry forward. On sale, claimed depreciation is recaptured at up to 25%, and gains may owe capital-gains tax (a 1031 exchange can defer both). Figures are a year-1 estimate at your 24.0% rate — not tax advice; consult a CPA.
Schools (NCES district)
- District
- Aurora R-VIII
- NCES district ID
- 2904020
- Math proficiency
- 30% ▼ -5.00%
- Reading proficiency
- 37% ▼ -4.00%
- Median HH income
- $37,036
- Composite
- 27.84/100
- National rank
- #6883
- State rank
- #244 of 324 in MO
Livability — Aurora
- Score
- 56/100
- State rank
- #710
- US rank
- #22927
Category grades
Schools grade is shown separately in the Schools card above.
Census & demographics
- Census place
- Aurora, MO
- Population (ZIP)
- 11,611
Population outlook (Lawrence County) Hauer SSP2
- Today (2025)
- 37,142 people
- By 2030
- 36,212 · -2.5%
- By 2040
- 34,080 · -8.2%
- By 2050
- 31,621 · -14.9%
- By 2075
- 25,987 · -30.0%
- By 2100
- 20,151 · -45.7%
Race, ethnicity, and origin ACS 2023
- Neighborhood character
- Predominantly White (89%)
- Race & ethnicity
- White 89% Two or more races 8% Hispanic / Latino 5%
- Common ancestry
- Iranian 4% Lithuanian 3% Slovak 2%
- Foreign-born
- 2% · Canada
- Languages at home
- 96% English-only · Spanish 2% German/W. Germanic 1% Korean 1%
Political lean MEDSL · Lawrence
- 2024 margin
- Solid R (+63.8) · D 17.6% · R 81.5%
- 2008→2024 swing
- -26.8pp toward R · 2008: -37.1pp · 2024: -63.8pp
- All cycles
- 2024: R+63.8 2020: R+62.6 2016: R+61.1 2012: R+47.0 2008: R+37.1
Not yet ingested
- Civics
- —
Market trends
- HPI YoY
- ▼ -12.62%
- Current HPI
- 267.2335
- Rent YoY
- —
- Metro
- —
- State GDP YoY
- ▲ 1.84%
- F500 in state
- 20
Industry mix (Fortune 500 HQ in MO)
| Industry | F500 HQs | Revenue |
|---|---|---|
| Healthcare | 1 | $163B |
|
||
| Insurance | 1 | $21B |
|
||
| Industrial Technology | 1 | $17B |
|
||
| Retail | 1 | $16B |
|
||
| Industrial Distribution | 1 | $10B |
|
||
| Utilities | 1 | $9B |
|
||
Price history
-16.7% since first listed3 events — show timeline
- 2026-05-27 Price Changed $124,900 SOMO
- 2026-05-21 Price Changed $134,900 SOMO
- 2026-05-12 Listed $149,900 SOMO
Property tax history
+3.3%/yrLatest (2025): $851 · +8.7% YoY. Source: county tax records.
Cash-flow waterfall
monthlySold comps — $/sqft
last 12 mo · ≤1 miLoading sold comps…