 🏗️ New Construction
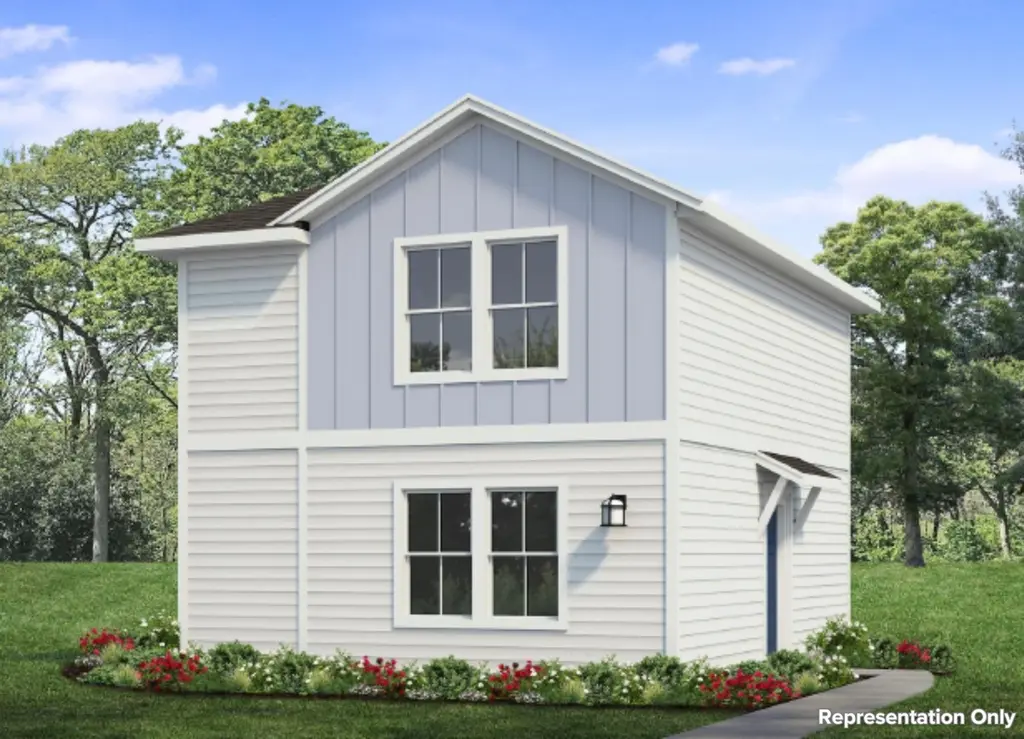
Harvest Ridge 1072 Plan · Elgin, TX
Flood risk 1/10 · Minimal
- FEMA flood zone
- X (unshaded)
- Chance of flooding over 30 yrs
- 0.0%
- Est. flood insurance / yr
- $507 – $1,088
Fire risk 4/10 · Minor
- Est. fire insurance / yr
- $1,222 – $2,270
Heat risk 8/10 · Major
- Hot days now (above 109°F)
- 7 days/yr
- Hot days in 30 yrs
- 23 days/yr
Wind risk 8/10 · Major
- Chance of severe wind over 30 yrs
- 80.0%
Air-quality risk 1/10 · Minimal
- Unhealthy air days now
- 0 days/yr
- Unhealthy air days in 30 yrs
- 0 days/yr
Risk factors via First Street. Map © Google.
Why this score? — see what drove the D- grade
The composite is a weighted blend of 9 inputs, each scored 0–100. Each bar is that input's sub-score; the figure is the points it added to the 100-point composite (weight × sub-score).
- Appreciation +10.0/10.0
- ARV discount +7.5/15.0
- Cash flow +5.8/30.0
- Condition / age +4.8/5.0
- Livability +3.7/5.0
- Rent growth +3.3/5.0
- Schools +2.0/10.0
- 1% rule +1.2/10.0
- DSCR +0.2/10.0
$179,990
🖨 Deal sheet 📄 Offer letter ✓ Due diligence
Listing remarks MLS
Welcome to Harvest Ridge, Elgin's most prestigious and award-winning master-planned community, where thoughtful design and true community spirit come together. With new homes starting in the $180s and options ranging from 2 to 5 bedrooms, there’s something here for every stage of life. Built around the idea that a neighborhood should be more than just a place to live, Harvest Ridge is designed to foster connection-with inviting front porches that encourage conversation, and a wide range of amenities that bring people together. Spend your days enjoying the resort-style pool, fishing ponds, playscapes, event lawns, food trucks, coffee bar, basketball and sports fields, and more. A full-time Lifestyle Director ensures there's always something happening, from seasonal festivals to family movie nights. Located just east of Austin near Highway 290, and now home to a brand-new onsite elementary school, Harvest Ridge offers the perfect balance of small-town charm and modern convenience. It's more than a neighborhood-it's a community built for belonging.
Key facts
- Resort style pool
- Playscapes
- Fishing ponds
Tags
Neighborhood map
What this means for you Summary
Snapshot
- This is a 2-bed/2.5-bath single-family listed at $180k. Condition is rated excellent.
Deal economics
- At list price, monthly cash flow is $-602 ($-7k/yr) — negative.
- The deal already cash-flows at list — no discount required.
- Meets the 1% rule at list price ($2k rent vs $180k).
- Recommended offer: $158k (12.0% below list) — sets the bar for market timing.
Location & tenants
- Location reads 74/100 on livability (#167 in TX, #4,404 nationally) — a middle-class / working-renter tenant base. Strengths: cost of living A+, housing A+, health & safety A+; Watch: schools F, amenities F, commute F.
- Elgin ISD (rural): math 17% / reading 26% proficiency, ranked #741 of 826 in TX (top 90%) — low school quality limits family demand, transient renter base, plan for 1-2y turnover; 67% free/reduced lunch — lower-income household profile, screen leases tightly.
- Market conditions: Rents rising (+3.1%/yr); 807 active listings in the ZIP; 8 comparable units currently listed for rent nearby; rentals at typical pace (median 15d on market — plan ~3-4 weeks tenant-placement turnaround); solid renter incomes; 1,841 units permitted in Bastrop County in 2024 (150 in 5+ unit buildings).
Forward outlook
- In year one you build about $32k of equity ($2k loan paydown + $30k appreciation (10.0% local appreciation)).
- Bastrop County population projected at +37% by 2050 — long-run rental-demand tailwind backs the buy-and-hold thesis.
- By year 2, paydown + projected appreciation supports a ~$52k cash-out refi (75% LTV) — recoverable capital for the next deal without selling this one.
Negotiation context
- It's been on market 131 days — a 12% lower offer ($158k) is reasonable based on typical stale-listing flexibility.
Risks & watch-outs
- Watch-outs: property tax is 2.5% of price.
- Climate carrying-cost: severe wind risk, 80% chance of damaging wind over 30y; extreme-heat days projected 7→23/yr by 2055 (HVAC capex compounding) — expect insurance premiums to compound above CPI over the hold.
Questions for the listing agent
- What do current leases actually rent for vs. the listed asking? Can we see a recent rent roll and the last 12 months of T-12 income?
- It's been on market 131 days. Have you received any prior offers? Is the seller open to a 12% concession, seller financing, or rate buy-down credit?
- Property tax is high relative to price — has the assessment been appealed recently, and will the sale trigger a re-assessment?
- Why hasn't it sold? Are there any deal-killer items the seller is aware of (foundation, flood, title, zoning, code violations)?
- Is there a deadline driving the sale (1031 exchange, divorce, estate, relocation)? That informs how much negotiation room exists.
- Schools are F-rated, which usually means shorter tenancies and higher turnover. Who's the typical renter profile here, and what's been the actual vacancy rate?
- The area grade is low — what's the realistic commute time and amenity access for the typical tenant pool here? Any planned neighborhood developments (good or bad) we should know about?
- What's the average days-on-market for RENTAL listings here right now (not sales)? A rising rental-DOM trend means longer vacancies and softer asking-rent achievability than the comps imply.
- What's the recent tenant-quality profile in this submarket — average credit score on applications, eviction rate, late-payment / NSF rate, and stable-employment percentage? A property-management company in the area should have these aggregated.
- How much new for-sale + rental construction is in the pipeline within 1–3 miles? Heavy new supply typically softens prices + rents 12–24 months out; constrained supply supports both.
Investment metrics
- 1% rule
- 0.62% ✗
- Cap rate
- 3.89%
- Cash-on-cash
- -8.59%
- DSCR
- 0.62
- GRM
- 13.4
CMA / ARV
- ARV (median comp)
- $300,403
- List price
- $179,990
- Delta
- -40.08%
- Verdict
- UNDERPRICED
- Comps
- 20 within 1.0 mi
Show comp detail 12 sales within ~0.75 mi
| Address | Dist | Beds/Ba | Sqft | Sold | Price | $/sf | Match |
|---|---|---|---|---|---|---|---|
| 117 Summer Dr | 0.41mi | 2/2.5 | 1,088 (+1%) | 2mo | $206,110 | $189 | 78 |
| 133 Daylily Dr | 0.45mi | 2/2.5 | 1,159 (+8%) | 4mo | $199,990 | $173 | 63 |
| 14705 Eagles Claw Way | 0.65mi | 3/2.0 (+1) | 1,076 (-0%) | 2mo | $255,900 | $238 | 61 |
| 18420 Stellers Sea St | 0.68mi | 3/2.0 (+1) | 1,076 (-0%) | 2mo | $252,900 | $235 | 60 |
| 129 Daylily Dr | 0.45mi | 3/2.5 (+1) | 1,153 (+7%) | 5mo | $199,990 | $173 | 58 |
| 14604 Wahlbergs Way | 0.70mi | 3/2.0 (+1) | 1,076 (-0%) | 3mo | $249,900 | $232 | 58 |
| 18404 Stellers Sea St | 0.71mi | 3/2.0 (+1) | 1,076 (-0%) | 4mo | $277,900 | $258 | 56 |
| 18308 Stellers Sea St | 0.75mi | 3/2.0 (+1) | 1,076 (-0%) | 3mo | $229,900 | $214 | 55 |
| 135 Summer Dr | 0.41mi | 3/2.0 (+1) | 1,191 (+10%) | 2mo | $214,840 | $180 | 54 |
| 143 Daylily Dr | 0.46mi | 3/2.0 (+1) | 1,191 (+10%) | 2mo | $209,990 | $176 | 53 |
| 104 Summer Dr | 0.42mi | 3/2.0 (+1) | 1,230 (+14%) | 1mo | $241,770 | $197 | 49 |
| 100 Daylily Dr | 0.48mi | 3/2.0 (+1) | 1,230 (+14%) | 2mo | $249,180 | $203 | 45 |
Match score weights: distance 35% · size 25% · config 20% · recency 20%. Top-matched comps best support the ARV.
Projected returns pro-forma
10.0% appreciation · 3.12% rent growth · sell at horizon
- IRR
- 18.3%
- Equity multiple
- 2.49×
- Total profit
- $125,508
- Equity at exit
- $270,627
- IRR
- 17.1%
- Equity multiple
- 5.76×
- Total profit
- $400,276
- Equity at exit
- $583,617
Cash invested: $84,113 (down + closing). Projections, not guarantees.
Landlord ↔ Tenant lean methodology
- Overall (STATE)
- 87 Strongly Landlord-Friendly
- State Texas
- 87 Strongly Landlord-Friendly · R+5
- County
- — inherits STATE
- City
- — inherits STATE
ZIP-level market 78621
- Home prices YoY
- 7.6%
- Rents YoY
- 3.1%
- Active inventory
- 807
- Price-to-rent
- 8.0×
Monthly cashflow live
- Estimated rent
- $1,866 high interval (Pro) →
- Mortgage (P&I)
- −$1,575
- Tax est. 1.5%
- −$376 /mo · $4,506/yr
- Insurance
- −$125
- HOA
- −$0
- Vacancy / Maint / Mgmt
- −$392
- Net cashflow
- $-602
Break-even live
UW: 25.0% down · 7.5% · 30yr · 1.5% tax · 5.0% vac · 8.0% maint · 8.0% mgmt
Financing live
Cash to close
- Down payment
- $75,101
- Closing costs
- $9,012
- Reserves months
- —
- Total cash needed
- —
Loan-product check · same deal, 3 products live
Conventional
25% down · 7.5% · 30yr
- Down + closing
- —
- Monthly P&I
- —
- Monthly cashflow
- —
- DSCR
- —
- Eligible?
- —
Personal DTI + credit; lowest rate.
DSCR
20% down · 8.5% · 30yr
- Down + closing
- —
- Monthly P&I
- —
- Monthly cashflow
- —
- DSCR
- —
- Eligible?
- —
No personal income docs; deal must DSCR.
Hard money
10% down · 12.0% · 12mo
- Down + closing
- —
- Monthly P&I
- —
- Monthly cashflow
- —
- DSCR
- —
- Eligible?
- —
Short-term bridge; refi at stabilization.
Rent comps 8 comps
| Address | Beds | Baths | Sqft | Rent | $/sqft | DOM | Units | Dist |
|---|---|---|---|---|---|---|---|---|
| 19405 Bear Grass Dr Elgin, TX | 3.0 | 2.0 | 1495 | $1,760 | $1.18 | 44d | 1 | 0.28mi |
| 18721 Quiet Range Dr Elgin, TX | 3.0–5.0 | 2.0–3.5 | 1773 | $2,085 | $1.18 | 2d | 1 | 0.35mi |
| 13817 County Line Rd Elgin, TX | 1.0–3.0 | 1.0–2.0 | 937 | $1,633 | $1.74 | 2d | 6 | 0.44mi |
| 14508 Wahlbergs Way Elgin, TX | 3.0 | 2.0 | 1076 | $2,045 | $1.90 | 11d | 1 | 0.70mi |
| 101 Bandara Woods Blvd Elgin, TX | 3.0 | 2.0 | 1499 | $1,769 | $1.18 | 15d | 1 | 0.71mi |
| 18316 Stellers Sea St Elgin, TX | 3.0 | 2.0 | 1076 | $2,045 | $1.90 | 19d | 1 | 0.76mi |
| 18200 Papuan Cv Elgin, TX | 3.0 | 2.0 | 1402 | $1,900 | $1.36 | 3d | 1 | 0.80mi |
| 102 Schuylerville Dr Elgin, TX | 3.0 | 2.0 | 1479 | $1,800 | $1.22 | 44d | 1 | 1.44mi |
Listing history 15 events
-
2026-06-18days on market $179,990 Active 131 DOM
-
2026-06-17price $179,990 Active 130 DOM
-
2026-06-17days on market $189,990 Active 130 DOM
-
2026-06-16days on market $189,990 Active 129 DOM
-
2026-06-15days on market $189,990 Active 128 DOM
-
2026-06-13days on market $189,990 Active 126 DOM
-
2026-06-09days on market $189,990 Active 122 DOM
-
2026-06-08days on market $189,990 Active 121 DOM
-
2026-06-07days on market $189,990 Active 120 DOM
-
2026-06-04days on market $189,990 Active 117 DOM
-
2026-06-03days on market $189,990 Active 116 DOM
-
2026-06-02days on market $189,990 Active 115 DOM
-
2026-06-01days on market $189,990 Active 114 DOM
-
2026-05-31days on market $189,990 Active 113 DOM
-
2026-02-07$189,990 Active 1067-char remark
Show marketing remark (1067 chars)
Welcome to Harvest Ridge, Elgin's most prestigious and award-winning master-planned community, where thoughtful design and true community spirit come together. With new homes starting in the $180s and options ranging from 2 to 5 bedrooms, there’s something here for every stage of life. Built around the idea that a neighborhood should be more than just a place to live, Harvest Ridge is designed to foster connection-with inviting front porches that encourage conversation, and a wide range of amenities that bring people together. Spend your days enjoying the resort-style pool, fishing ponds, playscapes, event lawns, food trucks, coffee bar, basketball and sports fields, and more. A full-time Lifestyle Director ensures there's always something happening, from seasonal festivals to family movie nights. Located just east of Austin near Highway 290, and now home to a brand-new onsite elementary school, Harvest Ridge offers the perfect balance of small-town charm and modern convenience. It's more than a neighborhood-it's a community built for belonging.
ⓘ Source: listings_history table (triggers on properties + properties_extension) + one-shot
backfill from property_details.listing_events for pre-trigger history.
Climate risk First Street
- Flood 1/10 Low FEMA zone X (unshaded) · 0% chance over 30 yrs
- Wildfire 4/10 Moderate
- Heat 8/10 Severe 7 d/yr ≥109°F today · 23 d/yr by 30 yrs out
- Wind 8/10 Severe 80% chance of damaging wind over 30 yrs
- Air quality 1/10 Low 0 unhealthy d/yr today · 0 by 30 yrs out
Nearby sold comps map
Loading sold comps map…
Walkable amenities ~0.75 mi
Loading nearby amenities…
Taxation est. · year 1
- Rental income
- $22,387
- − Mortgage interest
- −$16,827
- − Property taxes
- −$4,506
- − Insurance
- −$1,502
- − Repairs & maintenance
- −$1,791
- − Management
- −$1,791
- − Depreciation
- −$8,739
- Taxable loss
- −$12,769
- Est. tax savings @ 24.0%
- +$3,065
- After-tax cash flow
- $-4,162/yr
For passive investors: Depreciation is non-cash, so a rental often shows a tax loss while cash-flowing — sheltering income. Rental losses are passive: they offset passive income freely, and up to $25,000/yr can offset ordinary (W-2) income if you actively participate and your MAGI is under $100k (phasing out to $0 by $150k); unused losses carry forward. On sale, claimed depreciation is recaptured at up to 25%, and gains may owe capital-gains tax (a 1031 exchange can defer both). Figures are a year-1 estimate at your 24.0% rate — not tax advice; consult a CPA.
Condition & rehab AI · 1 photo
This home is in excellent condition with no visible repairs needed. It offers a great opportunity for a potential buyer or renter looking for a move-in-ready property in a prestigious community.
Value-add opportunities
- Both Paint exterior siding — Enhances curb appeal and value
- Both Install new front porch railings — Improves safety and adds charm
- Resale Upgrade kitchen appliances — Modernizes the kitchen and appeals to buyers
- Both Install smart home features — Enhances convenience and adds value
Renovation cost estimate screening
Value-add ROI direction
- Both Paint exterior siding — Enhances curb appeal and value ↑
- Both Install new front porch railings — Improves safety and adds charm ↑
- Resale Upgrade kitchen appliances — Modernizes the kitchen and appeals to buyers ↑
- Both Install smart home features — Enhances convenience and adds value ↑
ⓘ Cost ranges are severity-bucket heuristics (US national rule-of-thumb). Get contractor quotes + a written scope before underwriting a rehab budget.
Schools (NCES district)
- District
- Elgin ISD
- NCES district ID
- 4818360
- Math proficiency
- 17% ▼ -9.00%
- Reading proficiency
- 26% ▼ -5.00%
- Median HH income
- $55,176
- Composite
- 19.62/100
- National rank
- #8749
- State rank
- #741 of 826 in TX
Livability — Elgin
- Score
- 74/100
- State rank
- #167
- US rank
- #4404
Category grades
Schools grade is shown separately in the Schools card above.
Census & demographics
- County
- Bastrop County · 68,601 people
- City population
- 27,860
- Metro
- Austin-Round Rock-Georgetown, TX
- Population (ZIP)
- 30,411
- Household income
- $98,534
- Rent vs Own
- Severe rent burden
- 235.0
Population outlook (Bastrop County) Hauer SSP2
- Today (2025)
- 94,260 people
- By 2030
- 101,355 · +7.5%
- By 2040
- 115,578 · +22.6%
- By 2050
- 129,464 · +37.3%
- By 2075
- 168,068 · +78.3%
- By 2100
- 194,857 · +106.7%
Race, ethnicity, and origin ACS 2023
- Neighborhood character
- Diverse neighborhood (Simpson 0.64)
- Race & ethnicity
- Hispanic / Latino 46% White 38% Two or more races 19% Black 11% Native American 1%
- Hispanic origin (detail)
- Mexican 38%
- Common ancestry
- Slovak 2% Italian 2% Romanian 1%
- Foreign-born
- 17% · Canada, Vietnam
- Languages at home
- 63% English-only · Spanish 36%
Political lean MEDSL · Bastrop
- 2024 margin
- R (+18.4) · D 40.2% · R 58.6% · Other 1.2%
- 2008→2024 swing
- -10.2pp toward R · 2008: -8.2pp · 2024: -18.4pp
- All cycles
- 2024: R+18.4 2020: R+13.8 2016: R+20.4 2012: R+17.0 2008: R+8.2
Not yet ingested
- Civics
- —
Market trends
- HPI YoY
- ▲ 29.47%
- Current HPI
- 416.87
- Rent YoY
- ▲ 3.12%
- Metro
- Austin-Round Rock-Georgetown, TX
- State GDP YoY
- ▲ 3.95%
- F500 in state
- 110
Industry mix (Fortune 500 HQ in TX)
| Industry | F500 HQs | Revenue |
|---|---|---|
| Energy | 16 | $1,198B |
|
||
| Technology | 5 | $198B |
|
||
| Engineering / Construction | 4 | $72B |
|
||
| Energy Services | 3 | $60B |
|
||
| Utilities | 3 | $41B |
|
||
| Healthcare | 2 | $330B |
|
||
Price history
1 event — show timeline
- 2026-02-07 Listed $189,990 Zillow
Cash-flow waterfall
monthlySold comps — $/sqft
last 12 mo · ≤1 miLoading sold comps…