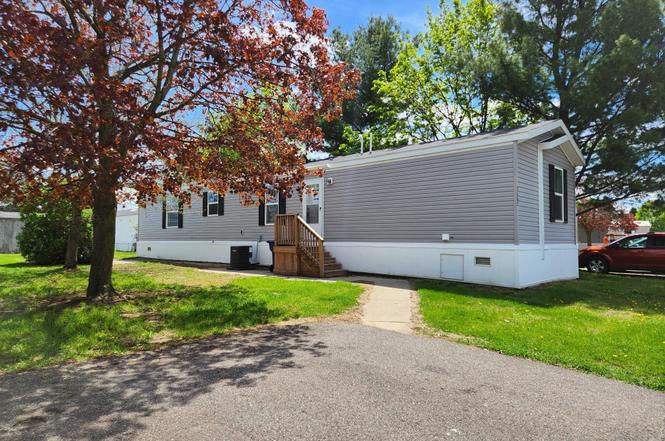
2 Bed 2 Bath Single Section Plan · Brandon, MI
Flood risk 1/10 · Minimal
- FEMA flood zone
- X (unshaded)
- Chance of flooding over 30 yrs
- 0.0%
- Est. flood insurance / yr
- $473 – $860
Fire risk 3/10 · Minor
- Est. fire insurance / yr
- $784 – $1,456
Heat risk 2/10 · Minimal
- Hot days now (above 95°F)
- 7 days/yr
- Hot days in 30 yrs
- 16 days/yr
Wind risk 2/10 · Minimal
- Chance of severe wind over 30 yrs
- —
Air-quality risk 3/10 · Minor
- Unhealthy air days now
- 2 days/yr
- Unhealthy air days in 30 yrs
- 4 days/yr
Risk factors via First Street. Map © Google.
Why this score? — see what drove the B- grade
The composite is a weighted blend of 9 inputs, each scored 0–100. Each bar is that input's sub-score; the figure is the points it added to the 100-point composite (weight × sub-score).
- Cash flow +30.0/30.0
- 1% rule +10.0/10.0
- DSCR +10.0/10.0
- ARV discount +7.5/15.0
- Schools +3.8/10.0
- Rent growth +2.5/5.0
- Livability +2.5/5.0
- Condition / age +2.5/5.0
- Appreciation +0.0/10.0
$41,900
🖨 Deal sheet 📄 Offer letter ✓ Due diligence
Listing remarks
Welcome to Sashabaw Meadows, where your dream home awaits! Our community is nestled near popular restaurants, stores, and top-rated schools in the Brandon School District. Enjoy outdoor adventures just minutes away at Independence Oaks County Park, Pine Knob Ski Resort, and Pine Knob Music Theater. Plus, you're a quick 15 minutes from bustling Auburn Hills. Live the lifestyle you've always wanted with a banquet room, barbecue and picnic area, a full-size baseball diamond, basketball court, clubhouse, fitness center, playground, and even RV parking. We're proudly pet-friendly! At Sashabaw Meadows, we prioritize community care. Our on-site management, sales office, well-lit streets, and wint
Key facts
- Listed 769 days
Property features AI
Finance
- Financial info: List price $70,900
Exterior
- Home design: Single-section home; 2 Bed 2 Bath Single Section plan
- Exterior features: Living area approximately 1,056
Interior
- Bedrooms: 2 bedrooms
- Bathrooms: 2 bathrooms (total)
- Interior features: Plan home
Neighborhood map
What this means for you Summary
Snapshot
- This is a 2-bed/2.0-bath manufactured listed at $42k.
Deal economics
- At list price, monthly cash flow is $871 ($10k/yr) — positive.
- The deal already cash-flows at list — no discount required.
- Meets the 1% rule at list price ($1k rent vs $42k).
- Recommended offer: $37k (12.0% below list) — sets the bar for market timing.
Location & tenants
- Location reads: area grade B — affects rentability + tenant quality, not the cash-flow math above.
- Brandon School District In The Counties Of Oakland And Lapee (town): math 35% / reading 48% proficiency, ranked #152 of 540 in MI (top 28%) — families likely to look elsewhere, expect single-tenant / working-renter base with shorter leases.
- Market conditions: 147 active listings in the ZIP; 3 comparable units currently listed for rent nearby; rentals leasing fast (median 2d on market — plan ~1-2 weeks tenant-placement turnaround); high-income renter base; 2,614 units permitted in Oakland County in 2024 (721 in 5+ unit buildings).
- This rent is only 14% of the median local income ($129k/yr) — well below the 30% rent-burden line; pricing power to push rent on renewal without tenant pushback.
Forward outlook
- Local home prices are declining (-3.0%/yr); year-one equity from $290 of loan paydown is wiped out by about $1k of value loss. Plan a longer hold.
- Oakland County population projected at +10% by 2050 — modest demand growth; plan on rents tracking national, not racing it.
- At projected returns (-3.0% appreciation + 3.0% rent growth), your $12k cash investment doubles in ~2 years — after that, you're playing with house money.
Negotiation context
- It's been on market 769 days — a 12% lower offer ($37k) is reasonable based on typical stale-listing flexibility.
Questions for the listing agent
- It's been on market 769 days. Have you received any prior offers? Is the seller open to a 12% concession, seller financing, or rate buy-down credit?
- Why hasn't it sold? Are there any deal-killer items the seller is aware of (foundation, flood, title, zoning, code violations)?
- Is there a deadline driving the sale (1031 exchange, divorce, estate, relocation)? That informs how much negotiation room exists.
- What's the average days-on-market for RENTAL listings here right now (not sales)? A rising rental-DOM trend means longer vacancies and softer asking-rent achievability than the comps imply.
- What's the recent tenant-quality profile in this submarket — average credit score on applications, eviction rate, late-payment / NSF rate, and stable-employment percentage? A property-management company in the area should have these aggregated.
- How much new for-sale + rental construction is in the pipeline within 1–3 miles? Heavy new supply typically softens prices + rents 12–24 months out; constrained supply supports both.
Investment metrics
- 1% rule
- 3.51% ✓
- Cap rate
- 31.23%
- Cash-on-cash
- 89.06%
- DSCR
- 4.96
- GRM
- 2.4
CMA / ARV
No comps found within radius.
Projected returns pro-forma
-3.0% appreciation · 3.0% rent growth · sell at horizon
- IRR
- 89.7%
- Equity multiple
- 5.15×
- Total profit
- $48,689
- Equity at exit
- $6,247
- IRR
- 92.7%
- Equity multiple
- 10.71×
- Total profit
- $113,896
- Equity at exit
- $3,623
Cash invested: $11,732 (down + closing). Projections, not guarantees.
Landlord ↔ Tenant lean methodology
- Overall (STATE)
- 62 Landlord-Friendly
- State Michigan
- 62 Landlord-Friendly · EVEN
- County
- — inherits STATE
- City
- — inherits STATE
ZIP-level market 48348
- Active inventory
- 147
- Price-to-rent
- 2.4×
Monthly cashflow live
- Estimated rent
- $1,469 medium interval (Pro) →
- Mortgage (P&I)
- −$220
- Tax est. 1.5%
- −$52 /mo · $628/yr
- Insurance
- −$17
- HOA
- −$0
- Vacancy / Maint / Mgmt
- −$308
- Net cashflow
- $871
Break-even live
UW: 25.0% down · 7.5% · 30yr · 1.5% tax · 5.0% vac · 8.0% maint · 8.0% mgmt
Financing live
Cash to close
- Down payment
- $10,475
- Closing costs
- $1,257
- Reserves months
- —
- Total cash needed
- —
Loan-product check · same deal, 3 products live
Conventional
25% down · 7.5% · 30yr
- Down + closing
- —
- Monthly P&I
- —
- Monthly cashflow
- —
- DSCR
- —
- Eligible?
- —
Personal DTI + credit; lowest rate.
DSCR
20% down · 8.5% · 30yr
- Down + closing
- —
- Monthly P&I
- —
- Monthly cashflow
- —
- DSCR
- —
- Eligible?
- —
No personal income docs; deal must DSCR.
Hard money
10% down · 12.0% · 12mo
- Down + closing
- —
- Monthly P&I
- —
- Monthly cashflow
- —
- DSCR
- —
- Eligible?
- —
Short-term bridge; refi at stabilization.
Rent comps 3 comps
| Address | Beds | Baths | Sqft | Rent | $/sqft | DOM | Units | Dist |
|---|---|---|---|---|---|---|---|---|
| 3618 Juniper St Unit 795 Village of Clarkston, MI | 3.0 | 2.0 | 1056 | $1,399 | $1.32 | 2d | 1 | 0.26mi |
| 3628 Birch St Unit 837 Village of Clarkston, MI | 2.0 | 2.0 | 1056 | $1,379 | $1.31 | 2d | 1 | 0.26mi |
| 3684 Willow Ct Unit 747 Village of Clarkston, MI | 3.0 | 2.0 | 1216 | $1,329 | $1.09 | 2d | 1 | 0.34mi |
Listing history 14 events
-
2026-06-18days on market $41,900 Active 769 DOM
-
2026-06-18pricedays on market $41,900 Active 768 DOM
-
2026-06-17days on market $34,900 Active 209 DOM
-
2026-06-16days on market $34,900 Active 208 DOM
-
2026-06-15days on market $34,900 Active 207 DOM
-
2026-06-13pricedays on market $34,900 Active 205 DOM
-
2026-06-09days on market $36,900 Active 201 DOM
-
2026-06-08days on market $36,900 Active 200 DOM
-
2026-06-07days on market $36,900 Active 199 DOM
-
2026-06-04days on market $36,900 Active 196 DOM
-
2026-06-03days on market $36,900 Active 195 DOM
-
2026-06-02days on market $36,900 Active 194 DOM
-
2026-06-01days on market $36,900 Active 193 DOM
-
2026-05-31days on market $36,900 Active 192 DOM
ⓘ Source: listings_history table (triggers on properties + properties_extension) + one-shot
backfill from property_details.listing_events for pre-trigger history.
Climate risk First Street
- Flood 1/10 Low FEMA zone X (unshaded) · 0% chance over 30 yrs
- Wildfire 3/10 Moderate
- Heat 2/10 Low 7 d/yr ≥95°F today · 16 d/yr by 30 yrs out
- Wind 2/10 Low
- Air quality 3/10 Moderate 2 unhealthy d/yr today · 4 by 30 yrs out
Nearby sold comps map
Loading sold comps map…
Walkable amenities ~0.75 mi
Loading nearby amenities…
Taxation est. · year 1
- Rental income
- $17,624
- − Mortgage interest
- −$2,347
- − Property taxes
- −$628
- − Insurance
- −$210
- − Repairs & maintenance
- −$1,410
- − Management
- −$1,410
- − Depreciation
- −$1,219
- Taxable income
- $10,401
- Est. tax owed @ 24.0%
- −$2,496
- After-tax cash flow
- $7,952/yr
For passive investors: Depreciation is non-cash, so a rental often shows a tax loss while cash-flowing — sheltering income. Rental losses are passive: they offset passive income freely, and up to $25,000/yr can offset ordinary (W-2) income if you actively participate and your MAGI is under $100k (phasing out to $0 by $150k); unused losses carry forward. On sale, claimed depreciation is recaptured at up to 25%, and gains may owe capital-gains tax (a 1031 exchange can defer both). Figures are a year-1 estimate at your 24.0% rate — not tax advice; consult a CPA.
Schools (NCES district)
- District
- Brandon School District In The Counties Of Oakland And Lapee
- NCES district ID
- 2606570
- Math proficiency
- 35% ▼ -8.00%
- Reading proficiency
- 48% ▼ -1.00%
- Median HH income
- $73,593
- Composite
- 37.94/100
- National rank
- #4306
- State rank
- #152 of 540 in MI
Livability — Brandon
No livability data for this city. (Only ~50 U.S. cities are tracked.)
Census & demographics
- County
- Oakland County · 1,009,092 people
- Metro
- Detroit-Warren-Dearborn, MI
- Population (ZIP)
- 24,574
- Household income
- $129,410
- Rent vs Own
- Severe rent burden
- 212.0
Population outlook (Oakland County) Hauer SSP2
- Today (2025)
- 1,335,747 people
- By 2030
- 1,375,100 · +2.9%
- By 2040
- 1,435,385 · +7.5%
- By 2050
- 1,469,250 · +10.0%
- By 2075
- 1,531,946 · +14.7%
- By 2100
- 1,450,485 · +8.6%
Race, ethnicity, and origin ACS 2023
- Neighborhood character
- Predominantly White (87%)
- Race & ethnicity
- White 87% Two or more races 6% Hispanic / Latino 5% Black 2% Asian 2%
- Hispanic origin (detail)
- Mexican 2%
- Common ancestry
- Romanian 10% Slovak 4% Lithuanian 3%
- Foreign-born
- 5% · Canada, Vietnam
- Languages at home
- 95% English-only · Spanish 2% French/Haitian/Cajun 1% Other Indo-European 1%
Political lean MEDSL · Oakland
- 2024 margin
- D (+10.6) · D 54.4% · R 43.8% · Other 1.9%
- 2008→2024 swing
- -3.9pp toward R · 2008: 14.5pp · 2024: 10.6pp
- All cycles
- 2024: D+10.6 2020: D+14.1 2016: D+8.1 2012: D+8.1 2008: D+14.5
Not yet ingested
- Civics
- —
Market trends
- HPI YoY
- ▼ -275.65%
- Current HPI
- 196.4302
- Rent YoY
- —
- Metro
- Detroit-Warren-Dearborn, MI
- State GDP YoY
- ▲ 1.37%
- F500 in state
- 28
Industry mix (Fortune 500 HQ in MI)
| Industry | F500 HQs | Revenue |
|---|---|---|
| Automotive Parts | 3 | $48B |
|
||
| Automotive | 2 | $372B |
|
||
| Chemicals | 1 | $45B |
|
||
| Automotive Retail | 1 | $29B |
|
||
| Healthcare / Medical Devices | 1 | $23B |
|
||
| Automotive Technology | 1 | $20B |
|
||
Cash-flow waterfall
monthlySold comps — $/sqft
last 12 mo · ≤1 miLoading sold comps…