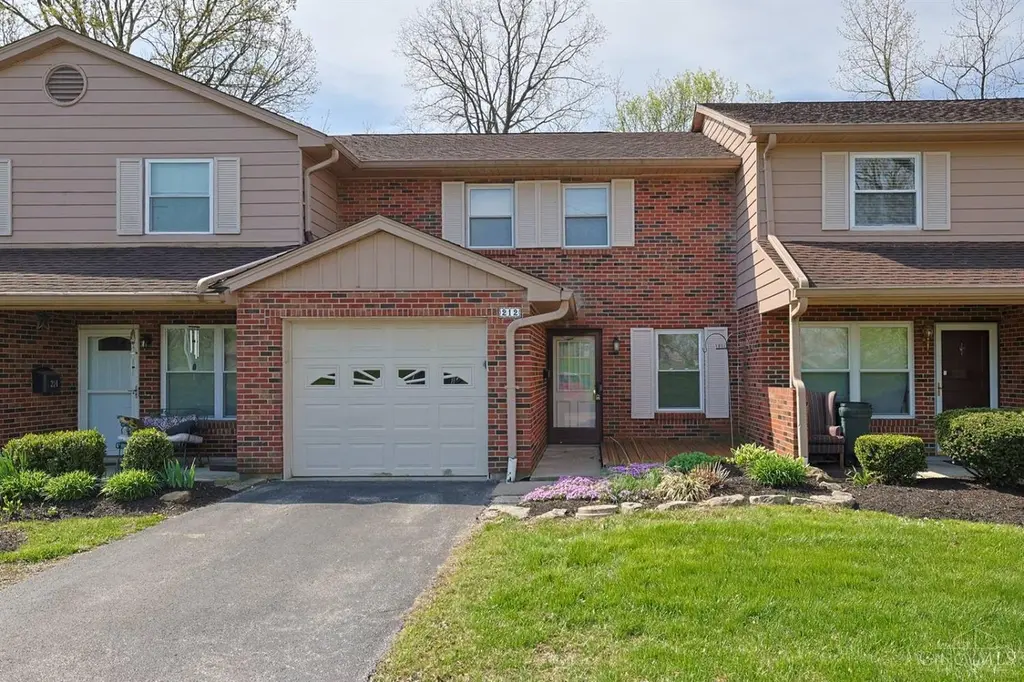
212 Duchess Ln · Mount Carmel, OH
Flood risk 3/10 · Minor
- FEMA flood zone
- X (unshaded)
- Chance of flooding over 30 yrs
- 0.1%
- Est. flood insurance / yr
- $507 – $1,088
Fire risk 1/10 · Minimal
- Est. fire insurance / yr
- $713 – $1,323
Heat risk 4/10 · Minor
- Hot days now (above 102°F)
- 7 days/yr
- Hot days in 30 yrs
- 19 days/yr
Wind risk 2/10 · Minimal
- Chance of severe wind over 30 yrs
- 1.0%
Air-quality risk 3/10 · Minor
- Unhealthy air days now
- 2 days/yr
- Unhealthy air days in 30 yrs
- 4 days/yr
Risk factors via First Street. Map © Google.
Why this score? — see what drove the D grade
The composite is a weighted blend of 9 inputs, each scored 0–100. Each bar is that input's sub-score; the figure is the points it added to the 100-point composite (weight × sub-score).
- ARV discount +15.0/15.0
- Cash flow +7.1/30.0
- Schools +4.7/10.0
- 1% rule +4.2/10.0
- Condition / age +4.0/5.0
- Rent growth +3.4/5.0
- Livability +3.4/5.0
- DSCR +1.3/10.0
- Appreciation +0.0/10.0
$175,000
🖨 Deal sheet 📄 Offer letter ✓ Due diligence
Listing remarks MLS
Location, location, location! Close to shopping, expressway and restaurants! Newer plank flooring on main level and carpet installed upstairs. 2 large bedrooms and 2 full baths upstairs, study on first floor. Large living room and dining area. Private patio on the rear of the unit. HOA offers pool, pickleball and tennis courts. Stocked fishing pond.
Key facts
- Newer plank flooring
- Hoa offers pool
- Pickleball courts
Tags
Neighborhood map
What this means for you Summary
Snapshot
- This is a 2-bed/2.5-bath townhouse listed at $175k. Condition is rated good.
Deal economics
- At list price, monthly cash flow is $-252 ($-3k/yr) — negative.
- To cash-flow at today's rent, offer at most $139k (20.8% below list).
- To meet the 1% rule (rent ≥ 1% of price), the offer needs to be $162k (7.6% below list).
- Recommended offer: $139k (20.8% below list) — sets the bar for cash-flow.
- Cap rate 4.6% vs local median 3.4% in Mount Carmel — top-decile yield for the area; either an underpriced asset or a hidden risk that comps aren't pricing in. Stress-test before assuming the spread holds.
Location & tenants
- Location reads 68/100 on livability (#583 in OH) — a middle-class / working-renter tenant base. Strengths: cost of living A+, housing A+, crime A-; Watch: schools D-, amenities F, commute F.
- West Clermont Local (suburban): math 51% / reading 57% proficiency, ranked #373 of 656 in OH (top 57%) — acceptable for families but not a draw, mixed tenant base, ~2y average lease.
- Market conditions: Rents rising (+3.4%/yr); 44 active listings in the ZIP; 29 comparable units currently listed for rent nearby; rentals at typical pace (median 24d on market — plan ~3-4 weeks tenant-placement turnaround); 45% of comp listings sitting > 30 days — soft ceiling on asking rent; solid renter incomes; 996 units permitted in Clermont County in 2024 (210 in 5+ unit buildings).
Forward outlook
- Local home prices are declining (-3.0%/yr); year-one equity from $1k of loan paydown is wiped out by about $5k of value loss. Plan a longer hold.
Negotiation context
- It's been on market 69 days — a 6% lower offer ($164k) is reasonable based on typical stale-listing flexibility.
Questions for the listing agent
- What do current leases actually rent for vs. the listed asking? Can we see a recent rent roll and the last 12 months of T-12 income?
- It's been on market 69 days. Have you received any prior offers? Is the seller open to a 21% concession, seller financing, or rate buy-down credit?
- Built in 1975 — when were the roof, HVAC, electrical panel, plumbing, and water heater last replaced?
- What does the HOA fee cover, when was the last increase, and are there any pending special assessments or reserve-fund shortfalls?
- Why hasn't it sold? Are there any deal-killer items the seller is aware of (foundation, flood, title, zoning, code violations)?
- Is there a deadline driving the sale (1031 exchange, divorce, estate, relocation)? That informs how much negotiation room exists.
- Schools are D-rated, which usually means shorter tenancies and higher turnover. Who's the typical renter profile here, and what's been the actual vacancy rate?
- The area grade is low — what's the realistic commute time and amenity access for the typical tenant pool here? Any planned neighborhood developments (good or bad) we should know about?
- What's the average days-on-market for RENTAL listings here right now (not sales)? A rising rental-DOM trend means longer vacancies and softer asking-rent achievability than the comps imply.
- What's the recent tenant-quality profile in this submarket — average credit score on applications, eviction rate, late-payment / NSF rate, and stable-employment percentage? A property-management company in the area should have these aggregated.
- How much new for-sale + rental construction is in the pipeline within 1–3 miles? Heavy new supply typically softens prices + rents 12–24 months out; constrained supply supports both.
Investment metrics
- 1% rule
- 0.92% ✗
- Cap rate
- 4.57%
- Cash-on-cash
- -6.16%
- DSCR
- 0.73
- GRM
- 9.0
CMA / ARV
- ARV (median comp)
- $230,862
- List price
- $175,000
- Delta
- -24.20%
- Verdict
- UNDERPRICED
- Comps
- 20 within 1.0 mi
Show comp detail 12 sales within ~0.75 mi
| Address | Dist | Beds/Ba | Sqft | Sold | Price | $/sf | Match |
|---|---|---|---|---|---|---|---|
| 439 Mcintosh Dr Unit 20B | 0.04mi | 2/2.5 | 1,404 (0%) | 4mo | $189,500 | $135 | 95 |
| 296 Jonathan Ct | 0.14mi | 2/2.5 | 1,404 (0%) | 12mo | $170,000 | $121 | 83 |
| 493 Mcintosh Dr | 0.15mi | 3/2.5 (+1) | 1,452 (+3%) | 7mo | $195,000 | $134 | 77 |
| 551 Tradition Rdg #81201 | 0.72mi | 2/2.0 | 1,422 (+1%) | 4mo | $378,235 | $266 | 59 |
| 607 Tradition Rdg #80204 | 0.72mi | 2/2.0 | 1,411 (+0%) | 13mo | $341,922 | $242 | 53 |
| 653 Tradition Rdg #79202 | 0.53mi | 2/2.0 | 1,351 (-4%) | 18mo | $271,900 | $201 | 52 |
| 655 Tradition Rdg #79102 | 0.69mi | 2/2.0 | 1,326 (-6%) | 8mo | $225,900 | $170 | 50 |
| 677 Tradition Rdg #77103 | 0.68mi | 2/2.0 | 1,326 (-6%) | 15mo | $252,900 | $191 | 45 |
| 667 Tradition Rdg #77204 | 0.68mi | 2/2.0 | 1,469 (+5%) | 18mo | $314,900 | $214 | 43 |
| 621 Tradition Rdg #80202 | 0.71mi | 2/2.0 | 1,351 (-4%) | 19mo | $283,900 | $210 | 43 |
| 695 Tradition Rdg #77201 | 0.68mi | 2/2.0 | 1,469 (+5%) | 19mo | $326,900 | $223 | 43 |
| 4297 Value Springs Dr #104 | 0.74mi | 2/2.0 | 1,554 (+11%) | 18mo | $273,000 | $176 | 30 |
Match score weights: distance 35% · size 25% · config 20% · recency 20%. Top-matched comps best support the ARV.
Projected returns pro-forma
-3.0% appreciation · 3.41% rent growth · sell at horizon
- IRR
- -26.1%
- Equity multiple
- 0.11×
- Total profit
- $-43,488
- Equity at exit
- $26,093
- IRR
- -20.8%
- Equity multiple
- -0.12×
- Total profit
- $-54,829
- Equity at exit
- $15,131
Cash invested: $49,000 (down + closing). Projections, not guarantees.
Landlord ↔ Tenant lean methodology
- Overall (STATE)
- 73 Landlord-Friendly
- State Ohio
- 73 Landlord-Friendly · R+6
- County
- — inherits STATE
- City
- — inherits STATE
ZIP-level market 45255
- Rents YoY
- 3.4%
- Active inventory
- 44
- Price-to-rent
- 9.0×
Monthly cashflow live
- Estimated rent
- $1,618 high interval (Pro) →
- Mortgage (P&I)
- −$918
- Tax est. 1.5%
- −$219 /mo · $2,625/yr
- Insurance
- −$73
- HOA
- −$320
- Vacancy / Maint / Mgmt
- −$340
- Net cashflow
- $-252
Break-even live
UW: 25.0% down · 7.5% · 30yr · 1.5% tax · 5.0% vac · 8.0% maint · 8.0% mgmt
Financing live
Cash to close
- Down payment
- $43,750
- Closing costs
- $5,250
- Reserves months
- —
- Total cash needed
- —
Loan-product check · same deal, 3 products live
Conventional
25% down · 7.5% · 30yr
- Down + closing
- —
- Monthly P&I
- —
- Monthly cashflow
- —
- DSCR
- —
- Eligible?
- —
Personal DTI + credit; lowest rate.
DSCR
20% down · 8.5% · 30yr
- Down + closing
- —
- Monthly P&I
- —
- Monthly cashflow
- —
- DSCR
- —
- Eligible?
- —
No personal income docs; deal must DSCR.
Hard money
10% down · 12.0% · 12mo
- Down + closing
- —
- Monthly P&I
- —
- Monthly cashflow
- —
- DSCR
- —
- Eligible?
- —
Short-term bridge; refi at stabilization.
Rent comps 29 comps
| Address | Beds | Baths | Sqft | Rent | $/sqft | DOM | Units | Dist |
|---|---|---|---|---|---|---|---|---|
| 4100 Fox Run Trl Cincinnati, OH | 2.0 | 2.0 | 1000 | $1,628 | $1.63 | 1d | 10 | 0.21mi |
| 4207 Edinburgh Dr Cincinnati, OH | 3.0 | 2.0 | 1366 | $2,181 | $1.60 | 2d | 1 | 0.41mi |
| 4037 Mount Carmel Tobasco Rd Cincinnati, OH | 1.0–3.0 | 1.0–2.0 | 933 | $1,770 | $1.90 | 1d | 12 | 0.44mi |
| 4341 Value Spgs Cincinnati, OH | 2.0 | 2.0 | 1274 | $2,000 | $1.57 | 16d | 1 | 0.65mi |
| 1745 Pinebluff Ln Cincinnati, OH | 3.0 | 2.5 | 1280 | $2,096 | $1.64 | 43d | 1 | 0.93mi |
| 503 Stone Creek Way Cincinnati, OH | 2.0 | 1.0 | 940 | $1,225 | $1.30 | 43d | 1 | 0.93mi |
| 8436 Linderwood Ln Cincinnati, OH | 3.0 | 2.0 | 1080 | $1,895 | $1.75 | 23d | 1 | 1.04mi |
| 724 Ohio Pike Apt A Cincinnati, OH | 2.0 | 1.5 | 1200 | $1,350 | $1.12 | 7d | 1 | 1.09mi |
| 500 Anchor Dr Cincinnati, OH | 2.0 | 1.0 | 858 | $1,162 | $1.35 | 7d | 9 | 1.09mi |
| 726 Ohio Pike Unit 3 Cincinnati, OH | 2.0 | 2.0 | 1300 | $1,550 | $1.19 | 7d | 1 | 1.10mi |
| 720 Ohio Pike Unit H Cincinnati, OH | 2.0 | 1.5 | 1200 | $1,405 | $1.17 | 23d | 1 | 1.12mi |
| 720 Ohio Pike Unit G Cincinnati, OH | 2.0 | 1.5 | 1200 | $1,350 | $1.12 | 7d | 1 | 1.13mi |
| 720 Ohio Pike Unit C Cincinnati, OH | 2.0 | 1.5 | 1200 | $1,450 | $1.21 | 43d | 1 | 1.13mi |
| 720 Ohio Pike Unit A Cincinnati, OH | 2.0 | 2.0 | 1300 | $1,450 | $1.12 | 4d | 1 | 1.13mi |
| 732 Ohio Pike Unit 726-3 Cincinnati, OH | 2.0 | 2.0 | 1250 | $1,495 | $1.20 | 23d | 1 | 1.15mi |
| 732 Ohio Pike Unit 39 Cincinnati, OH | 2.0 | 2.0 | 1300 | $1,525 | $1.17 | 43d | 1 | 1.15mi |
| 732 Ohio Pike Unit 40 Cincinnati, OH | 2.0 | 2.0 | 1300 | $1,575 | $1.21 | 43d | 1 | 1.15mi |
| 732 Ohio Pike Unit 37 Cincinnati, OH | 2.0 | 2.0 | 1300 | $1,450 | $1.12 | 7d | 1 | 1.15mi |
| 732 Ohio Pike Unit 41 Cincinnati, OH | 2.0 | 2.0 | 1300 | $1,600 | $1.23 | 43d | 1 | 1.15mi |
| 730 Ohio Pike Unit 25 Cincinnati, OH | 2.0 | 1.5 | 1250 | $1,275 | $1.02 | 43d | 1 | 1.19mi |
| 730 Ohio Pike Unit 22 Cincinnati, OH | 2.0 | 1.5 | 1200 | $1,175 | $0.98 | 4d | 1 | 1.19mi |
| 730 Ohio Pike Unit 31 Cincinnati, OH | 2.0 | 1.5 | 1150 | $1,275 | $1.11 | 20d | 1 | 1.19mi |
| 726 Ohio Pike Unit 726-G Cincinnati, OH | 2.0 | 1.5 | 1200 | $1,350 | $1.12 | 43d | 1 | 1.20mi |
| 726 Ohio Pike Unit 2 Cincinnati, OH | 2.0 | 2.0 | 1250 | $1,475 | $1.18 | 43d | 1 | 1.20mi |
| 3978 Brandychase Way Unit BC2-256 Cincinnati, OH | 2.0 | 2.0 | 1125 | $1,370 | $1.22 | 43d | 1 | 1.23mi |
| 3978 Brandychase Way Unit BC2-316 Cincinnati, OH | 2.0 | 2.0 | 1125 | $1,570 | $1.40 | 43d | 1 | 1.23mi |
| 3969 Brandychase Way Cincinnati, OH | 1.0–2.0 | 1.0–2.0 | 1135 | $1,610 | $1.42 | 43d | 1 | 1.24mi |
| 65 Carriage Station Dr Unit CST-49 Cincinnati, OH | 2.0 | 1.5 | 980 | $1,525 | $1.56 | 1d | 1 | 1.25mi |
| 780 Ohio Pike Cincinnati, OH | 1.0–2.0 | 1.0 | 995 | $1,145 | $1.15 | 43d | 4 | 1.36mi |
HOA detail
- Monthly dues
- $320 · $3,840/yr
- Likely covers
- pool
Listing history 16 events
-
2026-06-18days on market $175,000 Active 69 DOM
-
2026-06-17days on market $175,000 Active 68 DOM
-
2026-06-16days on market $175,000 Active 67 DOM
-
2026-06-15days on market $175,000 Active 66 DOM
-
2026-06-13days on market $175,000 Active 64 DOM
-
2026-06-13days on market $175,000 Active 63 DOM
-
2026-06-09days on market $175,000 Active 60 DOM
-
2026-06-08days on market $175,000 Active 59 DOM
-
2026-06-07pricedays on market $175,000 Active 58 DOM
-
2026-06-05days on market $190,000 Active 55 DOM
-
2026-06-03days on market $190,000 Active 54 DOM
-
2026-06-02days on market $190,000 Active 53 DOM
-
2026-06-01days on market $190,000 Active 52 DOM
-
2026-05-31days on market $190,000 Active 51 DOM
-
2026-05-08price $190,000 351-char remark
Show marketing remark (351 chars)
Location, location, location! Close to shopping, expressway and restaurants! Newer plank flooring on main level and carpet installed upstairs. 2 large bedrooms and 2 full baths upstairs, study on first floor. Large living room and dining area. Private patio on the rear of the unit. HOA offers pool, pickleball and tennis courts. Stocked fishing pond.
-
2026-04-10$200,000 Active 351-char remark
Show marketing remark (351 chars)
Location, location, location! Close to shopping, expressway and restaurants! Newer plank flooring on main level and carpet installed upstairs. 2 large bedrooms and 2 full baths upstairs, study on first floor. Large living room and dining area. Private patio on the rear of the unit. HOA offers pool, pickleball and tennis courts. Stocked fishing pond.
ⓘ Source: listings_history table (triggers on properties + properties_extension) + one-shot
backfill from property_details.listing_events for pre-trigger history.
Climate risk First Street
- Flood 3/10 Moderate FEMA zone X (unshaded) · 10% chance over 30 yrs
- Wildfire 1/10 Low
- Heat 4/10 Moderate 7 d/yr ≥102°F today · 19 d/yr by 30 yrs out
- Wind 2/10 Low 100% chance of damaging wind over 30 yrs
- Air quality 3/10 Moderate 2 unhealthy d/yr today · 4 by 30 yrs out
Nearby sold comps map
Loading sold comps map…
Walkable amenities ~0.75 mi
Loading nearby amenities…
Taxation est. · year 1
- Rental income
- $19,410
- − Mortgage interest
- −$9,803
- − Property taxes
- −$2,625
- − Insurance
- −$875
- − Repairs & maintenance
- −$1,553
- − Management
- −$1,553
- − HOA
- −$3,840
- − Depreciation
- −$5,091
- Taxable loss
- −$5,929
- Est. tax savings @ 24.0%
- +$1,423
- After-tax cash flow
- $-1,596/yr
For passive investors: Depreciation is non-cash, so a rental often shows a tax loss while cash-flowing — sheltering income. Rental losses are passive: they offset passive income freely, and up to $25,000/yr can offset ordinary (W-2) income if you actively participate and your MAGI is under $100k (phasing out to $0 by $150k); unused losses carry forward. On sale, claimed depreciation is recaptured at up to 25%, and gains may owe capital-gains tax (a 1031 exchange can defer both). Figures are a year-1 estimate at your 24.0% rate — not tax advice; consult a CPA.
Condition & rehab AI · 12 photos
This townhouse is in good condition with recent updates, offering a move-in-ready living experience.
Value-add opportunities
- Both Paint exterior trim — Enhances curb appeal and value
- Both Replace carpet with hardwood — Improves aesthetics and value
- Both Install new kitchen backsplash — Modernizes kitchen and adds value
Renovation cost estimate screening
Value-add ROI direction
- Both Paint exterior trim — Enhances curb appeal and value ↑
- Both Replace carpet with hardwood — Improves aesthetics and value ↑
- Both Install new kitchen backsplash — Modernizes kitchen and adds value ↑
ⓘ Cost ranges are severity-bucket heuristics (US national rule-of-thumb). Get contractor quotes + a written scope before underwriting a rehab budget.
Schools (NCES district)
- District
- West Clermont Local
- NCES district ID
- 3904635
- Math proficiency
- 51% ▼ -14.00%
- Reading proficiency
- 57% ▼ -11.00%
- Median HH income
- $56,436
- Composite
- 46.7/100
- National rank
- #2402
- State rank
- #373 of 656 in OH
Livability — Mount Carmel
- Score
- 68/100
- State rank
- #583
- US rank
- #9934
Category grades
Schools grade is shown separately in the Schools card above.
Census & demographics
- County
- Hamilton County · 701,295 people
- Metro
- Cincinnati, OH-KY-IN
- Population (ZIP)
- 22,313
- Household income
- $92,035
- Rent vs Own
- Severe rent burden
- 915.0
Population outlook (Clermont County) Hauer SSP2
- Today (2025)
- 210,162 people
- By 2030
- 212,463 · +1.1%
- By 2040
- 212,504 · +1.1%
- By 2050
- 205,957 · -2.0%
- By 2075
- 182,728 · -13.1%
- By 2100
- 143,986 · -31.5%
Race, ethnicity, and origin ACS 2023
- Neighborhood character
- Predominantly White (87%)
- Race & ethnicity
- White 87% Two or more races 5% Hispanic / Latino 4% Black 3% Asian 3%
- Common ancestry
- Slovak 3% Romanian 2% Lithuanian 2%
- Foreign-born
- 4% · Canada, China
- Languages at home
- 95% English-only · Spanish 2% Other Asian/Pacific 1% Other Indo-European 1%
Political lean MEDSL · Clermont
- 2024 margin
- Solid R (+35.8) · D 31.7% · R 67.4%
- 2008→2024 swing
- -3.4pp toward R · 2008: -32.4pp · 2024: -35.8pp
- All cycles
- 2024: R+35.8 2020: R+36.6 2016: R+41.3 2012: R+35.5 2008: R+32.4
Not yet ingested
- Civics
- —
Market trends
- HPI YoY
- ▼ -182.21%
- Current HPI
- 234.8489
- Rent YoY
- ▲ 3.41%
- Metro
- Cincinnati, OH-KY-IN
- State GDP YoY
- ▲ 1.98%
- F500 in state
- 48
Industry mix (Fortune 500 HQ in OH)
| Industry | F500 HQs | Revenue |
|---|---|---|
| Insurance | 3 | $145B |
|
||
| Industrial Machinery | 3 | $49B |
|
||
| Financial Services | 3 | $24B |
|
||
| Consumer Goods | 2 | $93B |
|
||
| Aerospace / Defense | 2 | $47B |
|
||
| Utilities | 2 | $33B |
|
||
Price history
-5.0% since first listed2 events — show timeline
- 2026-05-08 Price Changed $190,000 Cincy MLS
- 2026-04-10 Listed $200,000 Cincy MLS
Cash-flow waterfall
monthlySold comps — $/sqft
last 12 mo · ≤1 miLoading sold comps…