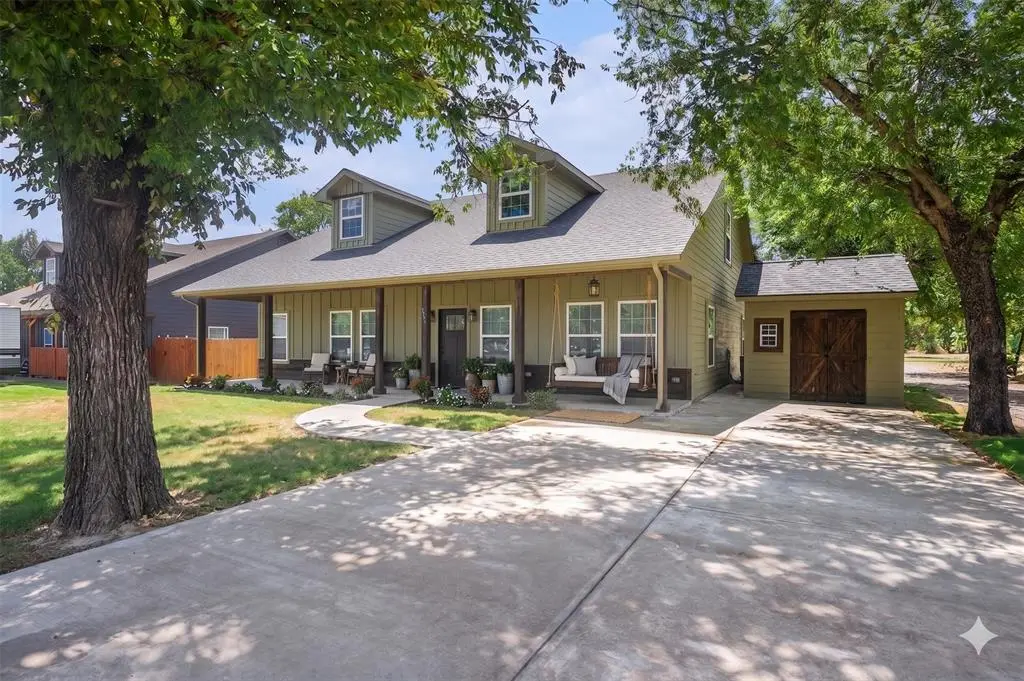
290 E Aurora St · Rhome, TX
Flood risk No data
- FEMA flood zone
- —
- Chance of flooding over 30 yrs
- —
- Est. flood insurance / yr
- —
Fire risk No data
- Est. fire insurance / yr
- —
Heat risk No data
- Hot days now (above threshold)
- —
- Hot days in 30 yrs
- —
Wind risk No data
- Chance of severe wind over 30 yrs
- —
Air-quality risk No data
- Unhealthy air days now
- —
- Unhealthy air days in 30 yrs
- —
Risk factors via First Street. Map © Google.
Why this score? — see what drove the D- grade
The composite is a weighted blend of 9 inputs, each scored 0–100. Each bar is that input's sub-score; the figure is the points it added to the 100-point composite (weight × sub-score).
- Appreciation +10.0/10.0
- ARV discount +8.5/15.0
- Cash flow +5.6/30.0
- Schools +4.6/10.0
- Livability +3.7/5.0
- Rent growth +2.5/5.0
- Condition / age +2.5/5.0
- 1% rule +1.7/10.0
- DSCR +0.0/10.0
$339,000
🖨 Deal sheet 📄 Offer letter ✓ Due diligence
Listing remarks
This stunning property perfectly blends modern comfort with small-town charm, offering an inviting and spacious layout that is perfect for both relaxed daily living and vibrant entertaining. From the moment you step inside, you will notice the bright, open-concept living spaces, highlighted by beautiful finishes, abundant natural light, and a stylish kitchen equipped with ample cabinetry and premium countertops. The generous primary suite serves as a private oasis, complete with a beautifully appointed en-suite bath and a spacious walk-in closet, while the additional bedrooms are versatile and perfectly sized for family, guests, or a dedicated home office. Step outside to your private backy
Key facts
- Private backyard
- Walk-in closet
- Stylish kitchen
Tags
Property features AI
Finance
- Other: Standard listing; possession at closing/funding
- Financial info: Second mortgage: none; Loan type: Treat As Clear
- HOA & community: No association (no HOA)
Exterior
- Parking: Driveway parking; No garage or carport spaces
- Security: No smart home features listed
- Utilities: All-weather road listed under utilities; Not in a municipal utility district
- Home design: Single-family residence; One story; Residential property
- Construction: Built in 2022; Board & batten siding
- Exterior features: Lot less than 0.5 acre (approximately 0.161 acre); All-weather road access; Subdivision: BC Rhome Add
Interior
- Kitchen: Dishwasher; Disposal; Electric range; Eat-in kitchen
- Bedrooms: 3 bedrooms; Primary bedroom on main level with ensuite bath, dual sinks and separate vanities, and walk-in closet (15 x 17)
- Flooring: No flooring information provided
- Bathrooms: 3 full bathrooms; Primary bath features dual sinks and separate vanities
- Heating & cooling: Central heating; Central air conditioning
- Interior features: Decorative lighting; Double vanity in bathroom; Eat-in kitchen; High-speed internet available; In-law suite floorplan; Walk-in closets; Two living areas; One dining area; Total of 4 rooms; One-level living
- Laundry & utility: No specific laundry details provided
Neighborhood map
What this means for you Summary
Snapshot
- This is a 3-bed/3.0-bath single-family listed at $339k.
Deal economics
- At list price, monthly cash flow is $-708 ($-8k/yr) — negative.
- To cash-flow at today's rent, offer at most $214k (36.9% below list).
- To meet the 1% rule (rent ≥ 1% of price), the offer needs to be $228k (32.9% below list).
- Recommended offer: $214k (36.9% below list) — sets the bar for cash-flow.
Location & tenants
- Location reads 74/100 on livability (#165 in TX, #4,376 nationally) — a middle-class / working-renter tenant base. Strengths: cost of living A+, housing A+, crime A-; Watch: amenities F, commute F.
- Northwest ISD (rural): math 48% / reading 52% proficiency, ranked #120 of 826 in TX (top 14%) — acceptable for families but not a draw, mixed tenant base, ~2y average lease.
- Zoned schools: Prairie View El (math 21% / reading 27%, grade F, #3,221 of 4,322 statewide, top 75%, 631 students, 54% FRL) — zoned schools average 54% FRL vs 22% district-wide (32 pts higher); higher-poverty schools than district average — tighter screening recommended.
- Zoned-school proficiency averages 24% at this address vs 50% district-wide (-26 pts) — the specific schools serving this property underperform the Northwest ISD average; the district grade overstates school quality for this exact location.
- Market conditions: 262 active listings in the ZIP; 3 comparable units currently listed for rent nearby; rentals leasing fast (median 2d on market — plan ~1-2 weeks tenant-placement turnaround); solid renter incomes; 460 units permitted in Wise County in 2024 (243 in 5+ unit buildings).
Forward outlook
- In year one you build about $36k of equity ($2k loan paydown + $34k appreciation (10.0% local appreciation)).
- Wise County population projected at +27% by 2050 — long-run rental-demand tailwind backs the buy-and-hold thesis.
- By year 2, paydown + projected appreciation supports a ~$58k cash-out refi (75% LTV) — recoverable capital for the next deal without selling this one.
Negotiation context
- It's been on market 23 days — a 2% lower offer ($334k) is reasonable based on typical stale-listing flexibility.
- 5 sale attempts with the ask held roughly flat each time — persistent listings suggest the price (not the market) is what's stuck; bring a comps-based counter.
Questions for the listing agent
- What do current leases actually rent for vs. the listed asking? Can we see a recent rent roll and the last 12 months of T-12 income?
- Is there a deadline driving the sale (1031 exchange, divorce, estate, relocation)? That informs how much negotiation room exists.
- Schools are D-rated, which usually means shorter tenancies and higher turnover. Who's the typical renter profile here, and what's been the actual vacancy rate?
- The area grade is low — what's the realistic commute time and amenity access for the typical tenant pool here? Any planned neighborhood developments (good or bad) we should know about?
- What's the average days-on-market for RENTAL listings here right now (not sales)? A rising rental-DOM trend means longer vacancies and softer asking-rent achievability than the comps imply.
- What's the recent tenant-quality profile in this submarket — average credit score on applications, eviction rate, late-payment / NSF rate, and stable-employment percentage? A property-management company in the area should have these aggregated.
- How much new for-sale + rental construction is in the pipeline within 1–3 miles? Heavy new supply typically softens prices + rents 12–24 months out; constrained supply supports both.
Investment metrics
- 1% rule
- 0.67% ✗
- Cap rate
- 3.79%
- Cash-on-cash
- -8.95%
- DSCR
- 0.60
- GRM
- 12.4
CMA / ARV
- ARV (on-the-fly)
- $346,519
- Comps found
- 12
Show comp detail 12 sales within ~0.75 mi
| Address | Dist | Beds/Ba | Sqft | Sold | Price | $/sf | Match |
|---|---|---|---|---|---|---|---|
| 121 Kings Way Dr | 0.34mi | 3/2.0 | 1,880 (-6%) | 2mo | $279,900 | $149 | 68 |
| 133 Medina Ln | 0.72mi | 4/2.0 (+1) | 2,014 (+0%) | 1mo | $354,990 | $176 | 55 |
| 119 Castell Ct | 0.73mi | 4/2.0 (+1) | 2,014 (+0%) | 3mo | $344,990 | $171 | 54 |
| 109 Medina Ln | 0.67mi | 4/2.0 (+1) | 2,039 (+2%) | 4mo | $349,160 | $171 | 53 |
| 126 Castell Ct | 0.74mi | 4/2.0 (+1) | 2,014 (+0%) | 4mo | $349,990 | $174 | 52 |
| 104 Crown Dr | 0.35mi | 4/2.0 (+1) | 1,727 (-14%) | 3mo | $278,000 | $161 | 49 |
| 118 Stanton Ave | 0.72mi | 4/2.0 (+1) | 2,110 (+5%) | 1mo | $364,990 | $173 | 48 |
| 141 Leon Ave | 0.74mi | 4/2.0 (+1) | 2,110 (+5%) | 0mo | $364,990 | $173 | 47 |
| 111 Castell Ct | 0.74mi | 4/2.0 (+1) | 2,110 (+5%) | 3mo | $344,990 | $164 | 45 |
| 110 Stanton Ave | 0.73mi | 4/2.0 (+1) | 1,837 (-8%) | 0mo | $344,990 | $188 | 43 |
| 129 Medina Ln | 0.71mi | 4/2.0 (+1) | 1,837 (-8%) | 3mo | $334,990 | $182 | 42 |
| 122 Castell Ct | 0.74mi | 4/2.0 (+1) | 1,837 (-8%) | 4mo | $333,990 | $182 | 39 |
Match score weights: distance 35% · size 25% · config 20% · recency 20%. Top-matched comps best support the ARV.
Projected returns pro-forma
10.0% appreciation · 3.0% rent growth · sell at horizon
- IRR
- 18.0%
- Equity multiple
- 2.47×
- Total profit
- $139,657
- Equity at exit
- $305,398
- IRR
- 16.9%
- Equity multiple
- 5.71×
- Total profit
- $447,005
- Equity at exit
- $658,602
Cash invested: $94,920 (down + closing). Projections, not guarantees.
Landlord ↔ Tenant lean methodology
- Overall (STATE)
- 87 Strongly Landlord-Friendly
- State Texas
- 87 Strongly Landlord-Friendly · R+5
- County
- — inherits STATE
- City
- — inherits STATE
ZIP-level market 76078
- Home prices YoY
- 6.5%
- Active inventory
- 262
- Price-to-rent
- 12.4×
Monthly cashflow live
- Estimated rent
- $2,275 medium interval (Pro) →
- Mortgage (P&I)
- −$1,778
- Tax from tax record
- −$587 /mo · $7,040/yr
- Insurance
- −$141
- HOA
- −$0
- Vacancy / Maint / Mgmt
- −$478
- Net cashflow
- $-708
Break-even live
UW: 25.0% down · 7.5% · 30yr · 1.5% tax · 5.0% vac · 8.0% maint · 8.0% mgmt
Financing live
Cash to close
- Down payment
- $84,750
- Closing costs
- $10,170
- Reserves months
- —
- Total cash needed
- —
Loan-product check · same deal, 3 products live
Conventional
25% down · 7.5% · 30yr
- Down + closing
- —
- Monthly P&I
- —
- Monthly cashflow
- —
- DSCR
- —
- Eligible?
- —
Personal DTI + credit; lowest rate.
DSCR
20% down · 8.5% · 30yr
- Down + closing
- —
- Monthly P&I
- —
- Monthly cashflow
- —
- DSCR
- —
- Eligible?
- —
No personal income docs; deal must DSCR.
Hard money
10% down · 12.0% · 12mo
- Down + closing
- —
- Monthly P&I
- —
- Monthly cashflow
- —
- DSCR
- —
- Eligible?
- —
Short-term bridge; refi at stabilization.
Rent comps 3 comps
| Address | Beds | Baths | Sqft | Rent | $/sqft | DOM | Units | Dist |
|---|---|---|---|---|---|---|---|---|
| 135 Lunayena Rd Rhome, TX | 4.0 | 2.0 | 2039 | $2,200 | $1.08 | 22d | 1 | 1.00mi |
| 135 Lunayena Rd Rhome, TX | 4.0 | 2.0 | 2039 | $2,200 | $1.08 | 1d | 1 | 1.00mi |
| 611 Gladness Unit A Rhome, TX | 3.0 | 2.5 | 1828 | $2,385 | $1.30 | 1d | 1 | 1.44mi |
Listing history 27 events
-
2026-06-18days on market $339,000 Active 23 DOM
-
2026-06-17days on market $339,000 Active 22 DOM
-
2026-06-16days on market $339,000 Active 21 DOM
-
2026-06-15days on market $339,000 Active 20 DOM
-
2026-06-13days on market $339,000 Active 18 DOM
-
2026-06-09days on market $339,000 Active 14 DOM
-
2026-06-08days on market $339,000 Active 13 DOM
-
2026-06-07days on market $339,000 Active 12 DOM
-
2026-06-04days on market $339,000 Active 9 DOM
-
2026-06-03days on market $339,000 Active 8 DOM
-
2026-06-02days on market $339,000 Active 7 DOM
-
2026-06-01days on market $339,000 Active 6 DOM
-
2026-05-31days on market $339,000 Active 5 DOM
-
2026-05-26$339,000 Active
-
2026-03-31historical
-
2026-02-10price $350,000
-
2026-01-28status Active
-
2025-12-16$360,000 Active
-
2025-11-30historical
-
2025-10-08price $360,000
-
2025-08-13price $365,000
-
2025-08-04$375,000 Active
-
2025-02-14historical
-
2025-01-14$395,000
-
2023-09-11soldstatus
-
2020-04-06soldstatus
-
2019-04-30soldstatus
ⓘ Source: listings_history table (triggers on properties + properties_extension) + one-shot
backfill from property_details.listing_events for pre-trigger history.
Tax reassessment forecast TX · Resets to sale price
- Current annual tax
- $7,040 · $587/mo
- Projected year-2 tax
- $7,040 · $587/mo
- Expected delta
- $0/yr ($0/mo · -0.0%)
ⓘ Screening estimate from a state-policy table — verify with the county assessor before closing.
Nearby sold comps map
Loading sold comps map…
Walkable amenities ~0.75 mi
Loading nearby amenities…
Taxation est. · year 1
- Rental income
- $27,304
- − Mortgage interest
- −$18,989
- − Property taxes
- −$7,040
- − Insurance
- −$1,695
- − Repairs & maintenance
- −$2,184
- − Management
- −$2,184
- − Depreciation
- −$9,862
- Taxable loss
- −$14,651
- Est. tax savings @ 24.0%
- +$3,516
- After-tax cash flow
- $-4,982/yr
For passive investors: Depreciation is non-cash, so a rental often shows a tax loss while cash-flowing — sheltering income. Rental losses are passive: they offset passive income freely, and up to $25,000/yr can offset ordinary (W-2) income if you actively participate and your MAGI is under $100k (phasing out to $0 by $150k); unused losses carry forward. On sale, claimed depreciation is recaptured at up to 25%, and gains may owe capital-gains tax (a 1031 exchange can defer both). Figures are a year-1 estimate at your 24.0% rate — not tax advice; consult a CPA.
Schools (NCES district)
- District
- Northwest ISD
- NCES district ID
- 4833180
- Math proficiency
- 48% ▼ -15.00%
- Reading proficiency
- 52% ▼ -8.00%
- Median HH income
- $85,315
- Composite
- 46.15/100
- National rank
- #2504
- State rank
- #120 of 826 in TX
Livability — Rhome
- Score
- 74/100
- State rank
- #165
- US rank
- #4376
Category grades
Schools grade is shown separately in the Schools card above.
Census & demographics
- Census place
- Rhome, TX
- County
- Wise County · 49,037 people
- Metro
- Dallas-Fort Worth-Arlington, TX
- Population (ZIP)
- 10,828
- Household income
- $99,866
- Rent vs Own
- Severe rent burden
- 10.0
Population outlook (Wise County) Hauer SSP2
- Today (2025)
- 71,620 people
- By 2030
- 75,858 · +5.9%
- By 2040
- 83,908 · +17.2%
- By 2050
- 90,717 · +26.7%
- By 2075
- 107,583 · +50.2%
- By 2100
- 114,996 · +60.6%
Race, ethnicity, and origin ACS 2023
- Neighborhood character
- Predominantly White (69%)
- Race & ethnicity
- White 69% Hispanic / Latino 24% Two or more races 11% Native American 4% Black 2%
- Hispanic origin (detail)
- Mexican 20% Puerto Rican 3%
- Common ancestry
- Slovak 2% Lithuanian 2% Italian 1%
- Foreign-born
- 6% · Canada
- Languages at home
- 85% English-only · Spanish 14% German/W. Germanic 1%
Political lean MEDSL · Wise
- 2024 margin
- Solid R (+70.0) · D 14.7% · R 84.7%
- 2008→2024 swing
- -14.3pp toward R · 2008: -55.7pp · 2024: -70.0pp
- All cycles
- 2024: R+70.0 2020: R+68.2 2016: R+69.9 2012: R+67.5 2008: R+55.7
Not yet ingested
- Civics
- —
Market trends
- HPI YoY
- ▲ 19.94%
- Current HPI
- 325.22
- Rent YoY
- —
- Metro
- Dallas-Fort Worth-Arlington, TX
- State GDP YoY
- ▲ 3.95%
- F500 in state
- 110
Industry mix (Fortune 500 HQ in TX)
| Industry | F500 HQs | Revenue |
|---|---|---|
| Energy | 16 | $1,198B |
|
||
| Technology | 5 | $198B |
|
||
| Engineering / Construction | 4 | $72B |
|
||
| Energy Services | 3 | $60B |
|
||
| Utilities | 3 | $41B |
|
||
| Healthcare | 2 | $330B |
|
||
Price history
-14.2% since first listed14 events — show timeline
- 2026-05-26 Listed $339,000 NTREIS
- 2026-03-31 Listing Removed — NTREIS
- 2026-02-10 Price Changed $350,000 NTREIS
- 2026-01-28 Relisted — NTREIS
- 2025-12-16 Listed $360,000 NTREIS
- 2025-11-30 Listing Removed — NTREIS
- 2025-10-08 Price Changed $360,000 NTREIS
- 2025-08-13 Price Changed $365,000 NTREIS
- 2025-08-04 Listed $375,000 NTREIS
- 2025-02-14 Listing Removed — NTREIS
- 2025-01-14 Listed $395,000 NTREIS
- 2023-09-11 Sold (Public Records) — Public Records
- 2020-04-06 Sold (Public Records) — Public Records
- 2019-04-30 Sold (Public Records) — Public Records
Property tax history
+12.9%/yrLatest (2025): $7,040 · -5.4% YoY. Source: county tax records.
Cash-flow waterfall
monthlySold comps — $/sqft
last 12 mo · ≤1 miLoading sold comps…