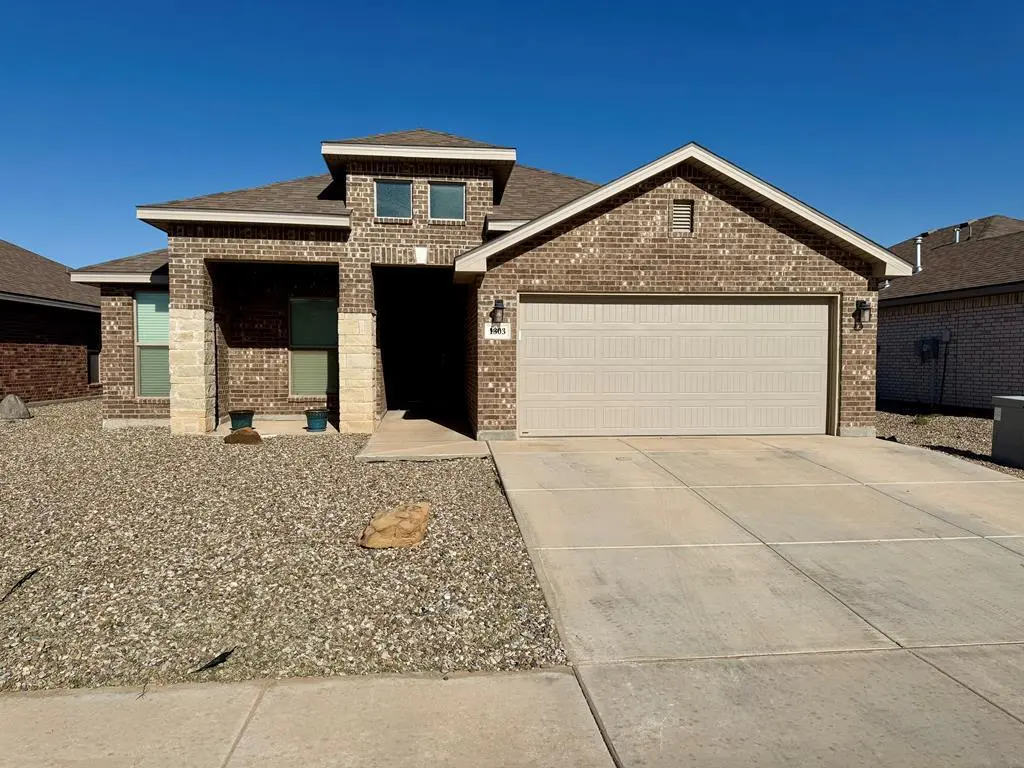
1303 Masquerade Blvd · Odessa, TX
Flood risk 1/10 · Minimal
- FEMA flood zone
- X (unshaded)
- Chance of flooding over 30 yrs
- 0.0%
- Est. flood insurance / yr
- $507 – $1,088
Fire risk 6/10 · Moderate
- Est. fire insurance / yr
- $1,222 – $2,270
Heat risk 6/10 · Moderate
- Hot days now (above 101°F)
- 7 days/yr
- Hot days in 30 yrs
- 22 days/yr
Wind risk 2/10 · Minimal
- Chance of severe wind over 30 yrs
- 4.0%
Air-quality risk 1/10 · Minimal
- Unhealthy air days now
- 0 days/yr
- Unhealthy air days in 30 yrs
- 0 days/yr
Risk factors via First Street. Map © Google.
Why this score? — see what drove the D grade
The composite is a weighted blend of 9 inputs, each scored 0–100. Each bar is that input's sub-score; the figure is the points it added to the 100-point composite (weight × sub-score).
- Cash flow +11.2/30.0
- ARV discount +10.5/15.0
- Condition / age +4.0/5.0
- Livability +3.8/5.0
- DSCR +3.3/10.0
- 1% rule +2.9/10.0
- Rent growth +2.6/5.0
- Schools +2.2/10.0
- Appreciation +0.0/10.0
$315,000
🖨 Deal sheet (PDF) 📄 Offer letter ✓ Due diligence
Listing remarks MLS
Beautiful, gently lived in, contemporary brick home in excellent condition. The home features an open concept living, dining and kitchen areas providing a spacious feel. Granite clad kitchen with all of the appliances included in the sale. Sequestered primary bedroom with a spa like bathroom featuring granite countertops, dual sinks and a separate tub and shower. Two good sized guest bedrooms and a second bath. Plus a low maintenance fenced yard with a covered patio for entertaining.
Key facts
- Open concept living
- Spa like bathroom
- Covered patio
Tags
Neighborhood map
What this means for you Summary
Snapshot
- This is a 3-bed/2.0-bath single-family listed at $315k. Condition is rated good.
Deal economics
- At list price, monthly cash flow is $-122 ($-1k/yr) — negative.
- To cash-flow at today's rent, offer at most $294k (6.8% below list).
- To meet the 1% rule (rent ≥ 1% of price), the offer needs to be $250k (20.6% below list).
- Recommended offer: $250k (20.6% below list) — sets the bar for 1% rule.
Location & tenants
- Location reads 75/100 on livability (#132 in TX, #3,928 nationally) — a middle-class / working-renter tenant base. Strengths: cost of living A+, housing A+, health & safety A+; Watch: commute D+, amenities D.
- Ector County ISD (urban): math 22% / reading 27% proficiency, ranked #707 of 826 in TX (top 86%) — low school quality limits family demand, transient renter base, plan for 1-2y turnover.
- Zoned schools: Barbara Jordan El (math 33% / reading 42%, grade F, #1,744 of 4,322 statewide, top 41%, 854 students, 51% FRL); Wilson & Young Medal of Honor Middle (math 14% / reading 31%, grade F, #1,341 of 1,662 statewide, top 82%, 1,245 students, 56% FRL); Permian H S (math 19% / reading 29%, grade F, #1,333 of 1,632 statewide, top 82%, 3,978 students, 51% FRL) — zoned schools at 53% FRL track the district average.
- Market conditions: Rents flat; 433 active listings in the ZIP; 32 comparable units currently listed for rent nearby; rentals lingering (median 45d on market — plan ~5-8 weeks vacancy on turnover, expect pricing pressure); 53% of comp listings sitting > 30 days — soft ceiling on asking rent; solid renter incomes; 1,004 units permitted in Ector County in 2024 (0 in 5+ unit buildings).
Forward outlook
- Local home prices are declining (-3.0%/yr); year-one equity from $2k of loan paydown is wiped out by about $9k of value loss. Plan a longer hold.
- Ector County population projected at +78% by 2050 — long-run rental-demand tailwind backs the buy-and-hold thesis.
Negotiation context
- It's been on market 141 days — a 12% lower offer ($277k) is reasonable based on typical stale-listing flexibility.
Risks & watch-outs
- Climate carrying-cost: major wildfire risk; extreme-heat days projected 7→22/yr by 2055 (HVAC capex compounding) — expect insurance premiums to compound above CPI over the hold.
Questions for the listing agent
- What do current leases actually rent for vs. the listed asking? Can we see a recent rent roll and the last 12 months of T-12 income?
- It's been on market 141 days. Have you received any prior offers? Is the seller open to a 21% concession, seller financing, or rate buy-down credit?
- Why hasn't it sold? Are there any deal-killer items the seller is aware of (foundation, flood, title, zoning, code violations)?
- Is there a deadline driving the sale (1031 exchange, divorce, estate, relocation)? That informs how much negotiation room exists.
- Schools are F-rated, which usually means shorter tenancies and higher turnover. Who's the typical renter profile here, and what's been the actual vacancy rate?
- The area grade is low — what's the realistic commute time and amenity access for the typical tenant pool here? Any planned neighborhood developments (good or bad) we should know about?
- What's the average days-on-market for RENTAL listings here right now (not sales)? A rising rental-DOM trend means longer vacancies and softer asking-rent achievability than the comps imply.
- What's the recent tenant-quality profile in this submarket — average credit score on applications, eviction rate, late-payment / NSF rate, and stable-employment percentage? A property-management company in the area should have these aggregated.
- How much new for-sale + rental construction is in the pipeline within 1–3 miles? Heavy new supply typically softens prices + rents 12–24 months out; constrained supply supports both.
Investment metrics
- 1% rule
- 0.79% ✗
- Cap rate
- 5.83%
- Cash-on-cash
- -1.65%
- DSCR
- 0.93
- GRM
- 10.5
CMA / ARV
- ARV (median comp)
- $337,311
- List price
- $315,000
- Delta
- -6.61%
- Verdict
- FAIR
- Comps
- 4 within 1.0 mi
Show comp detail 1 sale within ~0.75 mi
| Address | Dist | Beds/Ba | Sqft | Sold | Price | $/sf | Match |
|---|---|---|---|---|---|---|---|
| 8914 Ratliff Ridge Ave | 0.29mi | 3/2.0 | 1,760 (-14%) | 22mo | $289,000 | $164 | 45 |
Match score weights: distance 35% · size 25% · config 20% · recency 20%. Top-matched comps best support the ARV.
Projected returns pro-forma
-3.0% appreciation · 0.54% rent growth · sell at horizon
- IRR
- -21.7%
- Equity multiple
- 0.26×
- Total profit
- $-64,839
- Equity at exit
- $46,968
- IRR
- -22.5%
- Equity multiple
- -0.02×
- Total profit
- $-90,083
- Equity at exit
- $27,235
Cash invested: $88,200 (down + closing). Projections, not guarantees.
Landlord ↔ Tenant lean methodology
- Overall (STATE)
- 87 Strongly Landlord-Friendly
- State Texas
- 87 Strongly Landlord-Friendly · R+5
- County
- — inherits STATE
- City
- — inherits STATE
ZIP-level market 79765
- Home prices YoY
- -28.7%
- Rents YoY
- 0.5%
- Active inventory
- 433
- Price-to-rent
- 10.5×
Monthly cashflow live
- Estimated rent
- $2,502 high interval (Pro) →
- Mortgage (P&I)
- −$1,652
- Tax from tax record
- −$315 /mo · $3,783/yr
- Insurance
- −$131
- HOA
- −$0
- Vacancy / Maint / Mgmt
- −$526
- Net cashflow
- $-122
Break-even live
Sensitivity live
| Price | -10% $57 | -5% $-32 | +0% $-122 | +5% $-211 | +10% $-300 |
|---|---|---|---|---|---|
| Rent | -10% $-319 | -5% $-220 | +0% $-122 | +5% $-23 | +10% $76 |
| Rate | -1.0pp $37 | -0.5pp $-41 | base $-122 | +0.5pp $-203 | +1.0pp $-286 |
UW: 25.0% down · 7.5% · 30yr · 1.5% tax · 5.0% vac · 8.0% maint · 8.0% mgmt
Financing live
Cash to close
- Down payment
- $78,750
- Closing costs
- $9,450
- Reserves months
- —
- Total cash needed
- —
Loan-product check · same deal, 3 products live
Conventional
25% down · 7.5% · 30yr
- Down + closing
- —
- Monthly P&I
- —
- Monthly cashflow
- —
- DSCR
- —
- Eligible?
- —
Personal DTI + credit; lowest rate.
DSCR
20% down · 8.5% · 30yr
- Down + closing
- —
- Monthly P&I
- —
- Monthly cashflow
- —
- DSCR
- —
- Eligible?
- —
No personal income docs; deal must DSCR.
Hard money
10% down · 12.0% · 12mo
- Down + closing
- —
- Monthly P&I
- —
- Monthly cashflow
- —
- DSCR
- —
- Eligible?
- —
Short-term bridge; refi at stabilization.
Rent comps 32 comps
| Address | Beds | Baths | Sqft | Rent | $/sqft | DOM | Units | Dist |
|---|---|---|---|---|---|---|---|---|
| 1320 E 89th St Odessa, TX | 3.0 | 2.0 | 1450 | $2,800 | $1.93 | 45d | 1 | 0.03mi |
| 1218 E 89th St Odessa, TX | 3.0 | 2.0 | 1667 | $2,400 | $1.44 | 22d | 1 | 0.08mi |
| 1210 E 89th St Odessa, TX | 3.0 | 2.0 | 1582 | $2,600 | $1.64 | 45d | 1 | 0.12mi |
| 1028 E 90th St Odessa, TX | 3.0 | 2.0 | 1461 | $2,145 | $1.47 | 14d | 1 | 0.17mi |
| 1023 E 90th St Odessa, TX | 3.0 | 2.0 | 1760 | $2,500 | $1.42 | 14d | 1 | 0.19mi |
| 1115 Canal St Odessa, TX | 3.0 | 2.0 | 1833 | $2,400 | $1.31 | 45d | 1 | 0.24mi |
| 1508 E 89th St Odessa, TX | 4.0 | 2.0 | 2056 | $2,700 | $1.31 | 22d | 1 | 0.25mi |
| 1808 Big Easy St Odessa, TX | 4.0 | 2.5 | 2348 | $2,950 | $1.26 | 22d | 1 | 0.29mi |
| 1102 Canal St Odessa, TX | 4.0 | 2.0 | 2095 | $2,600 | $1.24 | 22d | 1 | 0.30mi |
| 9031 Antelope Ave Odessa, TX | 3.0 | 2.0 | 1923 | $2,500 | $1.30 | 45d | 1 | 0.32mi |
| 1025 Pine Leaf Pl Odessa, TX | 3.0 | 2.0 | 1411 | $2,200 | $1.56 | 45d | 1 | 0.42mi |
| 915 Canal St Odessa, TX | 4.0 | 2.0 | 2080 | $3,100 | $1.49 | 22d | 1 | 0.43mi |
| 9017 Pepper Grass Ave Odessa, TX | 3.0 | 2.0 | 1778 | $2,500 | $1.41 | 45d | 1 | 0.43mi |
| 88 Maverick Dr Odessa, TX | 3.0 | 2.0 | 1403 | $2,200 | $1.57 | 45d | 1 | 0.46mi |
| 1226 E 92nd St Odessa, TX | 3.0 | 2.0 | 1526 | $2,250 | $1.47 | 14d | 1 | 0.51mi |
| 912 Purdue St Odessa, TX | 3.0 | 2.0 | 1773 | $2,400 | $1.35 | 45d | 1 | 0.62mi |
| 908 Purdue St Odessa, TX | 3.0 | 2.0 | 1480 | $2,500 | $1.69 | 45d | 1 | 0.63mi |
| 1109 Wagon Way Odessa, TX | 3.0 | 2.0 | 1515 | $2,400 | $1.58 | 14d | 1 | 0.68mi |
| 800 E 92nd St Odessa, TX | 3.0 | 2.0 | 2005 | $2,550 | $1.27 | 45d | 1 | 0.75mi |
| 1306 E 94th St Odessa, TX | 3.0 | 2.0 | 1488 | $2,350 | $1.58 | 22d | 1 | 0.76mi |
| 8732 Rainbow Dr Odessa, TX | 3.0 | 2.0 | 1573 | $2,400 | $1.53 | 45d | 1 | 0.81mi |
| 900 E 96th St Odessa, TX | 3.0 | 2.0 | 1644 | $2,300 | $1.40 | 45d | 1 | 0.90mi |
| 808 E 96th St Odessa, TX | 3.0 | 2.0 | 1474 | $2,350 | $1.59 | 45d | 1 | 0.92mi |
| 819 E 97th Ct Odessa, TX | 3.0 | 2.0 | 1635 | $2,350 | $1.44 | 14d | 1 | 0.98mi |
| 713 E 96th St Odessa, TX | 3.0 | 2.0 | 1564 | $2,500 | $1.60 | 45d | 1 | 1.01mi |
| 9219 Holiday Dr Odessa, TX | 3.0 | 2.5 | 2118 | $2,800 | $1.32 | 45d | 1 | 1.12mi |
| 216 E 91st St Odessa, TX | 3.0 | 3.0 | 1602 | $2,500 | $1.56 | 14d | 1 | 1.18mi |
| 618 Juniper Ct Odessa, TX | 3.0 | 2.0 | 1606 | $2,700 | $1.68 | 14d | 1 | 1.20mi |
| 8610 Lamar Ave Unit NA Odessa, TX | 3.0 | 2.0 | 1700 | $2,200 | $1.29 | 14d | 1 | 1.20mi |
| 9914 Rainbow Dr Odessa, TX | 4.0 | 2.0 | 2069 | $3,200 | $1.55 | 45d | 1 | 1.27mi |
| 9918 Lamar Ave Odessa, TX | 3.0 | 2.0 | 1596 | $2,400 | $1.50 | 14d | 1 | 1.48mi |
| 320 Panhandle Dr Odessa, TX | 3.0 | 2.0 | 1595 | $2,500 | $1.57 | 45d | 1 | 1.48mi |
Listing history 10 events
-
2026-06-10days on market $315,000 Active 141 DOM
-
2026-06-09days on market $315,000 Active 140 DOM
-
2026-06-08days on market $315,000 Active 139 DOM
-
2026-06-07days on market $315,000 Active 138 DOM
-
2026-06-03days on market $315,000 Active 133 DOM
-
2026-06-01days on market $315,000 Active 132 DOM
-
2026-05-31days on market $315,000 Active 131 DOM
-
2026-05-30days on market $315,000 Active 130 DOM
-
2026-03-31price $315,000 488-char remark
Show marketing remark (488 chars)
Beautiful, gently lived in, contemporary brick home in excellent condition. The home features an open concept living, dining and kitchen areas providing a spacious feel. Granite clad kitchen with all of the appliances included in the sale. Sequestered primary bedroom with a spa like bathroom featuring granite countertops, dual sinks and a separate tub and shower. Two good sized guest bedrooms and a second bath. Plus a low maintenance fenced yard with a covered patio for entertaining.
-
2026-01-20$325,000 Active 488-char remark
Show marketing remark (488 chars)
Beautiful, gently lived in, contemporary brick home in excellent condition. The home features an open concept living, dining and kitchen areas providing a spacious feel. Granite clad kitchen with all of the appliances included in the sale. Sequestered primary bedroom with a spa like bathroom featuring granite countertops, dual sinks and a separate tub and shower. Two good sized guest bedrooms and a second bath. Plus a low maintenance fenced yard with a covered patio for entertaining.
ⓘ Source: listings_history table (triggers on properties + properties_extension) + one-shot
backfill from property_details.listing_events for pre-trigger history.
Tax reassessment forecast TX · Resets to sale price
- Current annual tax
- $3,783 · $315/mo
- Projected year-2 tax
- $5,764 · $480/mo
- Expected delta
- +$1,981/yr (+$165/mo · 52.4%)
ⓘ Screening estimate from a state-policy table — verify with the county assessor before closing.
Climate risk First Street
- Flood 1/10 Low FEMA zone X (unshaded) · 0% chance over 30 yrs
- Wildfire 6/10 Major
- Heat 6/10 Major 7 d/yr ≥101°F today · 22 d/yr by 30 yrs out
- Wind 2/10 Low 4% chance of damaging wind over 30 yrs
- Air quality 1/10 Low 0 unhealthy d/yr today · 0 by 30 yrs out
Nearby sold comps map
Loading sold comps map…
Walkable amenities ~0.75 mi
Loading nearby amenities…
Taxation est. · year 1
- Rental income
- $30,029
- − Mortgage interest
- −$17,645
- − Property taxes
- −$3,783
- − Insurance
- −$1,575
- − Repairs & maintenance
- −$2,402
- − Management
- −$2,402
- − Depreciation
- −$9,164
- Taxable loss
- −$6,943
- Est. tax savings @ 24.0%
- +$1,666
- After-tax cash flow
- $208/yr
For passive investors: Depreciation is non-cash, so a rental often shows a tax loss while cash-flowing — sheltering income. Rental losses are passive: they offset passive income freely, and up to $25,000/yr can offset ordinary (W-2) income if you actively participate and your MAGI is under $100k (phasing out to $0 by $150k); unused losses carry forward. On sale, claimed depreciation is recaptured at up to 25%, and gains may owe capital-gains tax (a 1031 exchange can defer both). Figures are a year-1 estimate at your 24.0% rate — not tax advice; consult a CPA.
Condition & rehab AI · 12 photos
This home is in excellent condition with a good condition score of 80. It features an open concept living area, granite kitchen, and a spa-like bathroom. The exterior is well-maintained, and the home is move-in ready with minor cosmetic updates needed.
Value-add opportunities
- Both Painting exterior and interior walls — Enhances curb appeal and interior aesthetics
- Both Replacing ceiling fans with energy-efficient models — Improves energy efficiency and reduces maintenance costs
- Resale Upgrading kitchen appliances — Modernizes the kitchen and adds value
- Both Adding smart home features — Enhances convenience and adds value for both resale and rental
Renovation cost estimate screening
Value-add ROI direction
- Both Painting exterior and interior walls — Enhances curb appeal and interior aesthetics ↑
- Both Replacing ceiling fans with energy-efficient models — Improves energy efficiency and reduces maintenance costs ↑
- Resale Upgrading kitchen appliances — Modernizes the kitchen and adds value ↑
- Both Adding smart home features — Enhances convenience and adds value for both resale and rental ↑
ⓘ Cost ranges are severity-bucket heuristics (US national rule-of-thumb). Get contractor quotes + a written scope before underwriting a rehab budget.
Schools (NCES district)
- District
- Ector County ISD
- NCES district ID
- 4818000
- Math proficiency
- 22% ▼ -9.00%
- Reading proficiency
- 27% ▼ -4.00%
- Median HH income
- $52,740
- Composite
- 21.89/100
- National rank
- #8233
- State rank
- #707 of 826 in TX
Livability — Odessa
- Score
- 75/100
- State rank
- #132
- US rank
- #3928
Category grades
Schools grade is shown separately in the Schools card above.
Census & demographics
- Census place
- Odessa, TX
- County
- Ector County · 131,169 people
- City population
- 131,169
- Metro
- Odessa, TX
- Population (ZIP)
- 25,904
- Household income
- $104,965
- Rent vs Own
- Severe rent burden
- 884.0
Population outlook (Ector County) Hauer SSP2
- Today (2025)
- 212,765 people
- By 2030
- 241,962 · +13.7%
- By 2040
- 306,582 · +44.1%
- By 2050
- 379,755 · +78.5%
- By 2075
- 568,991 · +167.4%
- By 2100
- 709,829 · +233.6%
Race, ethnicity, and origin ACS 2023
- Neighborhood character
- Diverse neighborhood (Simpson 0.59)
- Race & ethnicity
- Hispanic / Latino 49% White 41% Two or more races 15% Black 5% Asian 3% Native American 1%
- Hispanic origin (detail)
- Mexican 45%
- Common ancestry
- Romanian 1% Slovak 1% Lithuanian 1%
- Foreign-born
- 10% · Canada, China, South Korea
- Languages at home
- 63% English-only · Spanish 31% German/W. Germanic 1% Tagalog/Filipino 1%
Political lean MEDSL · Ector
- 2024 margin
- Solid R (+52.9) · D 23.2% · R 76.1%
- 2008→2024 swing
- -4.9pp toward R · 2008: -48.0pp · 2024: -52.9pp
- All cycles
- 2024: R+52.9 2020: R+47.8 2016: R+40.6 2012: R+48.9 2008: R+48.0
Not yet ingested
- Civics
- —
Market trends
- HPI YoY
- ▼ -69.68%
- Current HPI
- 173.4252
- Rent YoY
- ▲ 0.54%
- Metro
- Odessa, TX
- State GDP YoY
- ▲ 3.95%
- F500 in state
- 110
Industry mix (Fortune 500 HQ in TX)
| Industry | F500 HQs | Revenue |
|---|---|---|
| Energy | 16 | $1,198B |
|
||
| Technology | 5 | $198B |
|
||
| Engineering / Construction | 4 | $72B |
|
||
| Energy Services | 3 | $60B |
|
||
| Utilities | 3 | $41B |
|
||
| Healthcare | 2 | $330B |
|
||
Price history
-3.1% since first listed2 events — show timeline
- 2026-03-31 Price Changed $315,000 ODMLS
- 2026-01-20 Listed $325,000 ODMLS
Property tax history
+157.6%/yrLatest (2025): $3,783 · -24.2% YoY. Source: county tax records.
Cash-flow waterfall
monthlySold comps — $/sqft
last 12 mo · ≤1 miLoading sold comps…