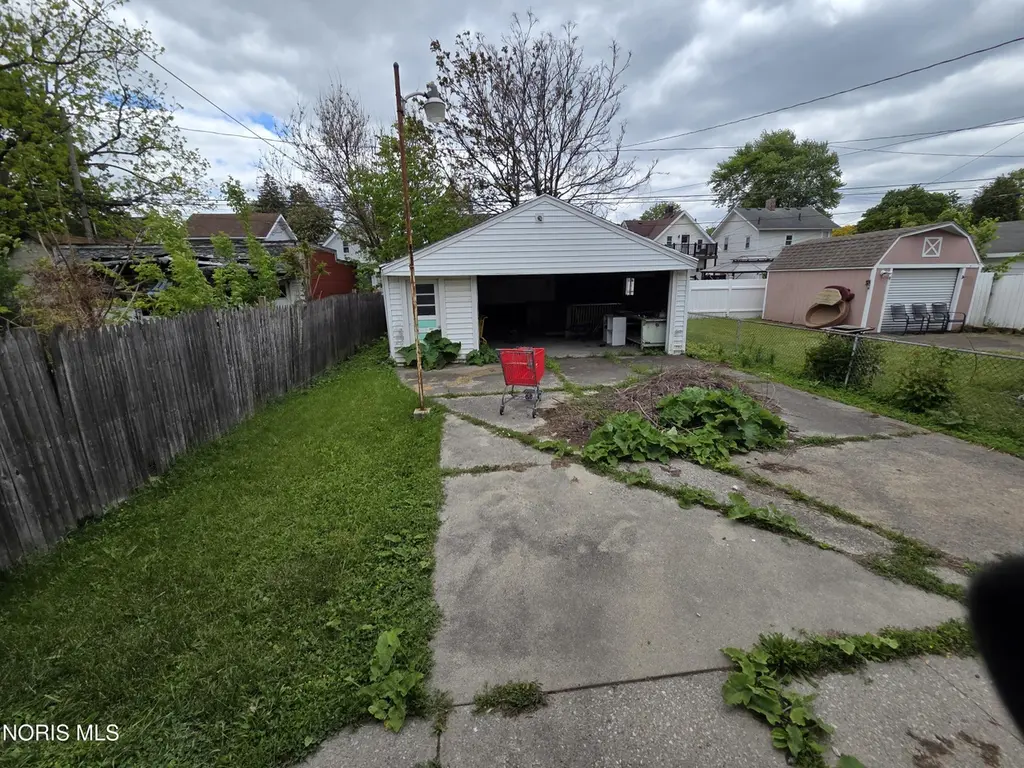
514 E Weber St · Toledo, OH
Flood risk 1/10 · Minimal
- FEMA flood zone
- X (unshaded)
- Chance of flooding over 30 yrs
- 0.0%
- Est. flood insurance / yr
- $473 – $860
Fire risk 1/10 · Minimal
- Est. fire insurance / yr
- $713 – $1,323
Heat risk 3/10 · Minor
- Hot days now (above 100°F)
- 7 days/yr
- Hot days in 30 yrs
- 16 days/yr
Wind risk 2/10 · Minimal
- Chance of severe wind over 30 yrs
- —
Air-quality risk 2/10 · Minimal
- Unhealthy air days now
- 1 days/yr
- Unhealthy air days in 30 yrs
- 3 days/yr
Risk factors via First Street. Map © Google.
Why this score? — see what drove the B+ grade
The composite is a weighted blend of 9 inputs, each scored 0–100. Each bar is that input's sub-score; the figure is the points it added to the 100-point composite (weight × sub-score).
- Cash flow +30.0/30.0
- ARV discount +15.0/15.0
- 1% rule +10.0/10.0
- DSCR +10.0/10.0
- Rent growth +3.5/5.0
- Livability +3.3/5.0
- Condition / age +2.5/5.0
- Schools +1.6/10.0
- Appreciation +0.0/10.0
$54,900
🖨 Deal sheet (PDF) 📄 Offer letter ✓ Due diligence
Listing remarks MLS
To settle estate-pretty decent place-good bones! Located on a nice block behind Woodward High. Make Offer!
Key facts
- 4,400 sq ft lot
- 2 garage spots
- Built 1923
Property features AI
Finance
- HOA & community: Curbs; Street lights; Sidewalks
Exterior
- Parking: Detached garage; 2 garage spaces; Additional parking; Driveway; On-street parking; Paved parking; Concrete parking; Storage (in parking area); Total parking for 8 vehicles
- Security: Smoke detector(s)
- Utilities: Electricity connected (circuit breakers); Natural gas connected; Public water; Public sewer; Sewer connected; Water connected
- Home design: Single family residence (house); One and one-half levels; No common walls; Located on a city street; Level lot
- Construction: Aluminum siding and brick exterior; Combination/other foundation; Built (year source: public records)
- Exterior features: Private yard; Storage; Enclosed porch; Front porch; Asphalt roof; Fencing (other); Garages/other structures
Interior
- Kitchen: Electric oven; Electric range; Refrigerator; Electric range connection; Water heater
- Bedrooms: Bedroom 2 (Upper); Bedroom 3 (Upper)
- Flooring: Carpet; Wood
- Bathrooms: 2 full bathrooms
- Heating & cooling: Central heating; Forced air; Natural gas
- Interior features: Storage; Ceiling fan(s); Window screens; Partial basement
- Laundry & utility: Washer hookup; Electric dryer hookup
Neighborhood map
What this means for you Summary
Snapshot
- This is a 3-bed/3.0-bath single-family listed at $55k.
Deal economics
- At list price, monthly cash flow is $426 ($5k/yr) — positive.
- The deal already cash-flows at list — no discount required.
- Meets the 1% rule at list price ($1k rent vs $55k).
- Recommended offer: $54k (1.5% below list) — sets the bar for market timing.
- Cap rate 15.6% vs local median 7.6% in Toledo — top-decile yield for the area; either an underpriced asset or a hidden risk that comps aren't pricing in. Stress-test before assuming the spread holds.
Location & tenants
- Location reads 66/100 on livability (#645 in OH) — a middle-class / working-renter tenant base. Strengths: cost of living A+, housing A+, health & safety A+; Watch: amenities C-, crime F, commute F.
- Toledo City (urban): math 15% / reading 24% proficiency, ranked #634 of 656 in OH (top 97%) — low school quality limits family demand, transient renter base, plan for 1-2y turnover; 72% free/reduced lunch — lower-income household profile, screen leases tightly.
- Zoned schools: Leverette Elementary School (math 3% / reading 13%, grade F, #1,517 of 1,584 statewide, top 96%, 429 students, 0% FRL); Woodward High School (math 2% / reading 22%, grade F, #726 of 781 statewide, top 94%, 672 students, 0% FRL) — zoned schools average 0% FRL vs 72% district-wide (72 pts lower); this property's tenant base skews higher-income than the district average.
- Market conditions: Rents rising (+3.9%/yr); 58 active listings in the ZIP; 30 comparable units currently listed for rent nearby; rentals at typical pace (median 24d on market — plan ~3-4 weeks tenant-placement turnaround); lower-income renter base — watch delinquency; 415 units permitted in Lucas County in 2024 (122 in 5+ unit buildings).
- This rent runs 42% of the median local income ($29k/yr) — at the standard rent-burdened threshold; future hikes will face affordability resistance.
Forward outlook
- Local home prices are declining (-3.0%/yr); year-one equity from $380 of loan paydown is wiped out by about $2k of value loss. Plan a longer hold.
- Lucas County population projected at -16% by 2050 — secular population decline; favor cash flow + early exit over multi-decade hold.
- At projected returns (-3.0% appreciation + 3.9% rent growth), your $15k cash investment doubles in ~4 years — after that, you're playing with house money.
Negotiation context
- It's been on market 28 days — a 2% lower offer ($54k) is reasonable based on typical stale-listing flexibility.
- 6 sale attempts since 17y ago with the ask held roughly flat each time — persistent listings suggest the price (not the market) is what's stuck; bring a comps-based counter.
- Current owner paid $14k; list at $55k implies a 279% gain — meaningful room to come down on a strong offer.
Risks & watch-outs
- Watch-outs: built in 1923 — expect roof / HVAC / electrical / plumbing capex.
Questions for the listing agent
- Built in 1923 — when were the roof, HVAC, electrical panel, plumbing, and water heater last replaced?
- Is there a deadline driving the sale (1031 exchange, divorce, estate, relocation)? That informs how much negotiation room exists.
- Schools are D-rated, which usually means shorter tenancies and higher turnover. Who's the typical renter profile here, and what's been the actual vacancy rate?
- Crime grade is F in this area — have there been break-ins, vandalism, or insurance claims at this property in the last 3 years? What carrier currently insures it and at what premium?
- What's the average days-on-market for RENTAL listings here right now (not sales)? A rising rental-DOM trend means longer vacancies and softer asking-rent achievability than the comps imply.
- What's the recent tenant-quality profile in this submarket — average credit score on applications, eviction rate, late-payment / NSF rate, and stable-employment percentage? A property-management company in the area should have these aggregated.
- How much new for-sale + rental construction is in the pipeline within 1–3 miles? Heavy new supply typically softens prices + rents 12–24 months out; constrained supply supports both.
Investment metrics
- 1% rule
- 1.88% ✓
- Cap rate
- 15.61%
- Cash-on-cash
- 33.29%
- DSCR
- 2.48
- GRM
- 4.4
CMA / ARV
- ARV (on-the-fly)
- $70,977
- Comps found
- 12
Show comp detail 12 sales within ~0.75 mi
| Address | Dist | Beds/Ba | Sqft | Sold | Price | $/sf | Match |
|---|---|---|---|---|---|---|---|
| 330 E Lake St | 0.34mi | 3/2.0 | 1,211 (+1%) | 3mo | $72,000 | $59 | 76 |
| 532 Dexter St | 0.31mi | 3/1.5 | 1,307 (+9%) | 2mo | $62,000 | $47 | 64 |
| 235 Bronson Ave | 0.36mi | 3/2.0 | 1,104 (-8%) | 2mo | $48,000 | $43 | 63 |
| 307 Majestic Dr | 0.50mi | 3/2.0 | 1,309 (+9%) | 3mo | $91,000 | $70 | 56 |
| 3233 Jeannette Ave | 0.70mi | 3/1.0 | 1,173 (-2%) | 3mo | $86,000 | $73 | 53 |
| 414 Palmer St | 0.60mi | 2/1.0 (-1) | 1,239 (+3%) | 3mo | $65,000 | $52 | 52 |
| 3550 Wersell Ave | 0.43mi | 3/1.0 | 1,054 (-12%) | 3mo | $48,000 | $46 | 49 |
| 255 E Pearl St | 0.42mi | 4/2.0 (+1) | 1,360 (+13%) | 1mo | $97,000 | $71 | 49 |
| 3405 Maher St | 0.69mi | 3/1.5 | 1,293 (+8%) | 2mo | $105,000 | $81 | 48 |
| 1101 Ketcham Ave | 0.58mi | 3/1.0 | 1,068 (-11%) | 3mo | $25,850 | $24 | 43 |
| 1102 Woodward Ave | 0.59mi | 3/1.0 | 1,041 (-14%) | 4mo | $62,000 | $60 | 39 |
| 3209 Jeannette Ave | 0.70mi | 3/1.0 | 1,353 (+12%) | 2mo | $71,000 | $52 | 37 |
Match score weights: distance 35% · size 25% · config 20% · recency 20%. Top-matched comps best support the ARV.
Projected returns pro-forma
-3.0% appreciation · 3.89% rent growth · sell at horizon
- IRR
- 29.6%
- Equity multiple
- 2.25×
- Total profit
- $19,219
- Equity at exit
- $8,186
- IRR
- 37.4%
- Equity multiple
- 4.62×
- Total profit
- $55,704
- Equity at exit
- $4,747
Cash invested: $15,372 (down + closing). Projections, not guarantees.
Landlord ↔ Tenant lean methodology
- Overall (STATE)
- 73 Landlord-Friendly
- State Ohio
- 73 Landlord-Friendly · R+6
- County
- — inherits STATE
- City
- — inherits STATE
ZIP-level market 43608
- Home prices YoY
- -21.3%
- Rents YoY
- 3.9%
- Active inventory
- 58
- Price-to-rent
- 4.4×
Monthly cashflow live
- Estimated rent
- $1,035 high interval (Pro) →
- Mortgage (P&I)
- −$288
- Tax from tax record
- −$80 /mo · $963/yr
- Insurance
- −$23
- HOA
- −$0
- Vacancy / Maint / Mgmt
- −$217
- Net cashflow
- $426
Break-even live
Sensitivity live
| Price | -10% $457 | -5% $442 | +0% $426 | +5% $411 | +10% $395 |
|---|---|---|---|---|---|
| Rent | -10% $345 | -5% $386 | +0% $426 | +5% $467 | +10% $508 |
| Rate | -1.0pp $454 | -0.5pp $440 | base $426 | +0.5pp $412 | +1.0pp $398 |
UW: 25.0% down · 7.5% · 30yr · 1.5% tax · 5.0% vac · 8.0% maint · 8.0% mgmt
Financing live
Cash to close
- Down payment
- $13,725
- Closing costs
- $1,647
- Reserves months
- —
- Total cash needed
- —
Loan-product check · same deal, 3 products live
Conventional
25% down · 7.5% · 30yr
- Down + closing
- —
- Monthly P&I
- —
- Monthly cashflow
- —
- DSCR
- —
- Eligible?
- —
Personal DTI + credit; lowest rate.
DSCR
20% down · 8.5% · 30yr
- Down + closing
- —
- Monthly P&I
- —
- Monthly cashflow
- —
- DSCR
- —
- Eligible?
- —
No personal income docs; deal must DSCR.
Hard money
10% down · 12.0% · 12mo
- Down + closing
- —
- Monthly P&I
- —
- Monthly cashflow
- —
- DSCR
- —
- Eligible?
- —
Short-term bridge; refi at stabilization.
Rent comps 30 comps
| Address | Beds | Baths | Sqft | Rent | $/sqft | DOM | Units | Dist |
|---|---|---|---|---|---|---|---|---|
| 516 E Hudson St Toledo, OH | 3.0 | 1.0 | 1204 | $1,098 | $0.91 | 14d | 1 | 0.15mi |
| 524 E Hudson St Toledo, OH | 3.0 | 1.0 | 1150 | $895 | $0.78 | 22d | 1 | 0.15mi |
| 524 E Hudson St Toledo, OH | 2.0 | 1.0 | 1050 | $825 | $0.79 | 44d | 1 | 0.15mi |
| 424 E Lake St Toledo, OH | 3.0 | 1.0 | 1228 | $1,075 | $0.88 | 14d | 1 | 0.28mi |
| 319 Dexter St Toledo, OH | 2.0 | 1.0 | 990 | $1,005 | $1.02 | 44d | 1 | 0.33mi |
| 333 E Lake St Toledo, OH | 2.0 | 1.0 | 800 | $495 | $0.62 | 24d | 1 | 0.36mi |
| 420 Everett St Toledo, OH | 2.0 | 1.0 | 1000 | $975 | $0.97 | 24d | 1 | 0.36mi |
| 710 E Lake St Toledo, OH | 3.0 | 1.0 | 1242 | $1,000 | $0.81 | 14d | 1 | 0.39mi |
| 405 E Manhattan Blvd Toledo, OH | 2.0 | 1.0 | 1000 | $900 | $0.90 | 14d | 1 | 0.39mi |
| 227 Everett St Toledo, OH | 2.0 | 1.0 | 914 | $850 | $0.93 | 44d | 1 | 0.40mi |
| 329 Mettler St Toledo, OH | 2.0 | 1.0 | 908 | $975 | $1.07 | 14d | 1 | 0.42mi |
| 830 Homer Ave Toledo, OH | 3.0 | 1.0 | 1208 | $895 | $0.74 | 44d | 1 | 0.51mi |
| 2621 Chestnut St Toledo, OH | 3.0 | 1.0 | 1444 | $1,250 | $0.87 | 44d | 1 | 0.52mi |
| 59 E Hudson St Toledo, OH | 3.0 | 1.0 | 1368 | $1,100 | $0.80 | 44d | 1 | 0.53mi |
| 225 Palmer St Toledo, OH | 2.0 | 1.0 | 924 | $895 | $0.97 | 44d | 1 | 0.64mi |
| 1337 Moore St Toledo, OH | 3.0 | 1.5 | 1194 | $995 | $0.83 | 22d | 1 | 0.65mi |
| 152 Austin St Toledo, OH | 4.0 | 1.5 | 1370 | $1,150 | $0.84 | 24d | 1 | 0.66mi |
| 31 W Oakland St Toledo, OH | 4.0 | 1.0 | 1188 | $1,249 | $1.05 | 24d | 1 | 0.69mi |
| 3439 Jeannette Ave Toledo, OH | 3.0 | 1.0 | 1098 | $1,095 | $1.00 | 44d | 1 | 0.80mi |
| 3474 Maher St Toledo, OH | 2.0 | 1.0 | 736 | $1,125 | $1.53 | 44d | 1 | 0.80mi |
| 3405 Beaumont Dr Toledo, OH | 2.0 | 1.0 | 855 | $745 | $0.87 | 14d | 1 | 0.87mi |
| 425 Boston Pl Unit A Toledo, OH | 2.0 | 1.0 | 1200 | $895 | $0.75 | 24d | 1 | 1.11mi |
| 610 Cadillac Ct Toledo, OH | 3.0 | 1.0 | 1409 | $1,050 | $0.75 | 24d | 1 | 1.23mi |
| 1031 N Michigan St Toledo, OH | 3.0 | 2.0 | 1488 | $1,195 | $0.80 | 24d | 1 | 1.31mi |
| 2907 Rockwood Pl Toledo, OH | 3.0 | 1.0 | 1494 | $1,100 | $0.74 | 14d | 1 | 1.31mi |
| 426 Beacon St Toledo, OH | 1.0–2.0 | 1.0–1.5 | 809 | $882 | $1.09 | 14d | 10 | 1.32mi |
| 2131 Franklin Ave Toledo, OH | 2.0 | 2.0 | 1255 | $900 | $0.72 | 44d | 1 | 1.36mi |
| 630 Mulberry St Toledo, OH | 2.0 | 1.0 | 1000 | $950 | $0.95 | 24d | 1 | 1.42mi |
| 1449 N Huron St Toledo, OH | 4.0 | 2.0 | 1430 | $1,045 | $0.73 | 14d | 1 | 1.45mi |
| 3950 Woodhaven Dr Toledo, OH | 2.0 | 1.0 | 1072 | $745 | $0.69 | 24d | 1 | 1.48mi |
Listing history 28 events
-
2026-06-18days on market $54,900 Active 28 DOM
-
2026-06-17days on market $54,900 Active 27 DOM
-
2026-06-16days on market $54,900 Active 26 DOM
-
2026-06-15days on market $54,900 Active 25 DOM
-
2026-06-14days on market $54,900 Active 23 DOM
-
2026-06-10days on market $54,900 Active 20 DOM
-
2026-06-09days on market $54,900 Active 19 DOM
-
2026-06-08days on market $54,900 Active 18 DOM
-
2026-06-07days on market $54,900 Active 17 DOM
-
2026-06-05days on market $54,900 Active 14 DOM
-
2026-06-03days on market $54,900 Active 13 DOM
-
2026-06-02days on market $54,900 Active 12 DOM
-
2026-06-01days on market $54,900 Active 11 DOM
-
2026-05-31days on market $54,900 Active 10 DOM
-
2026-05-30days on market $54,900 Active 9 DOM
-
2026-05-18$54,900 Active
-
2025-10-13price $14,500 108-char remark
Show marketing remark (108 chars)
To settle estate-pretty decent place-good bones! Located on a nice block behind Woodward High. Make Offer!
-
2011-04-01soldstatus $14,500
-
2011-03-30soldstatus $14,500 108-char remark
Show marketing remark (108 chars)
To settle estate-pretty decent place-good bones! Located on a nice block behind Woodward High. Make Offer!
-
2010-12-17$23,900 108-char remark
Show marketing remark (108 chars)
To settle estate-pretty decent place-good bones! Located on a nice block behind Woodward High. Make Offer!
-
2010-12-05historical
-
2010-06-05$32,000
-
2010-05-25historical
-
2010-03-04historical
-
2009-11-25$42,000
-
2009-11-25$37,500
-
2009-09-30historical
-
2009-03-30$45,000
ⓘ Source: listings_history table (triggers on properties + properties_extension) + one-shot
backfill from property_details.listing_events for pre-trigger history.
Tax reassessment forecast OH · Partial reset (capped growth)
- Current annual tax
- $963 · $80/mo
- Projected year-2 tax
- $963 · $80/mo
- Expected delta
- $0/yr ($0/mo · 0.0%)
ⓘ Screening estimate from a state-policy table — verify with the county assessor before closing.
Climate risk First Street
- Flood 1/10 Low FEMA zone X (unshaded) · 0% chance over 30 yrs
- Wildfire 1/10 Low
- Heat 3/10 Moderate 7 d/yr ≥100°F today · 16 d/yr by 30 yrs out
- Wind 2/10 Low
- Air quality 2/10 Low 1 unhealthy d/yr today · 3 by 30 yrs out
Nearby sold comps map
Loading sold comps map…
Walkable amenities ~0.75 mi
Loading nearby amenities…
Taxation est. · year 1
- Rental income
- $12,417
- − Mortgage interest
- −$3,075
- − Property taxes
- −$963
- − Insurance
- −$274
- − Repairs & maintenance
- −$993
- − Management
- −$993
- − Depreciation
- −$1,597
- Taxable income
- $4,520
- Est. tax owed @ 24.0%
- −$1,085
- After-tax cash flow
- $4,032/yr
For passive investors: Depreciation is non-cash, so a rental often shows a tax loss while cash-flowing — sheltering income. Rental losses are passive: they offset passive income freely, and up to $25,000/yr can offset ordinary (W-2) income if you actively participate and your MAGI is under $100k (phasing out to $0 by $150k); unused losses carry forward. On sale, claimed depreciation is recaptured at up to 25%, and gains may owe capital-gains tax (a 1031 exchange can defer both). Figures are a year-1 estimate at your 24.0% rate — not tax advice; consult a CPA.
Schools (NCES district)
- District
- Toledo City
- NCES district ID
- 3904490
- Math proficiency
- 15% ▼ -16.00%
- Reading proficiency
- 24% ▼ -13.00%
- Median HH income
- $32,137
- Composite
- 15.76/100
- National rank
- #9276
- State rank
- #634 of 656 in OH
Livability — Toledo
- Score
- 66/100
- State rank
- #645
- US rank
- #11442
Category grades
Schools grade is shown separately in the Schools card above.
Census & demographics
- Census place
- Toledo, OH
- County
- Lucas County · 380,724 people
- City population
- 280,811
- Metro
- Toledo, OH
- Population (ZIP)
- 13,593
- Household income
- $29,275
- Rent vs Own
- Severe rent burden
- 911.0
Population outlook (Lucas County) Hauer SSP2
- Today (2025)
- 420,751 people
- By 2030
- 410,187 · -2.5%
- By 2040
- 384,019 · -8.7%
- By 2050
- 355,125 · -15.6%
- By 2075
- 291,683 · -30.7%
- By 2100
- 233,670 · -44.5%
Race, ethnicity, and origin ACS 2023
- Neighborhood character
- Diverse neighborhood (Simpson 0.60)
- Race & ethnicity
- Black 57% White 25% Two or more races 9% Hispanic / Latino 8% Asian 2%
- Hispanic origin (detail)
- Mexican 4%
- Common ancestry
- Romanian 4% Lithuanian 2% Slovak 1%
- Foreign-born
- 4% · Canada, China
- Languages at home
- 91% English-only · Spanish 7%
Political lean MEDSL · Lucas
- 2024 margin
- D (+12.6) · D 55.8% · R 43.2%
- 2008→2024 swing
- -18.9pp toward R · 2008: 31.4pp · 2024: 12.6pp
- All cycles
- 2024: D+12.6 2020: D+16.8 2016: D+17.4 2012: D+30.4 2008: D+31.4
Not yet ingested
- Civics
- —
Market trends
- HPI YoY
- ▼ -37.73%
- Current HPI
- 139.4964
- Rent YoY
- ▲ 3.89%
- Metro
- Toledo, OH
- State GDP YoY
- ▲ 1.98%
- F500 in state
- 48
Industry mix (Fortune 500 HQ in OH)
| Industry | F500 HQs | Revenue |
|---|---|---|
| Insurance | 3 | $145B |
|
||
| Industrial Machinery | 3 | $49B |
|
||
| Financial Services | 3 | $24B |
|
||
| Consumer Goods | 2 | $93B |
|
||
| Aerospace / Defense | 2 | $47B |
|
||
| Utilities | 2 | $33B |
|
||
Price history
+22.0% since first listed13 events — show timeline
- 2026-05-18 Listed $54,900 NORIS
- 2025-10-13 Price Changed $14,500 NORIS
- 2011-04-01 Sold (Public Records) $14,500 Public Records
- 2011-03-30 Sold (MLS) $14,500 NORIS
- 2010-12-17 Listed $23,900 NORIS
- 2010-12-05 Listing Removed — NORIS
- 2010-06-05 Listed $32,000 NORIS
- 2010-05-25 Listing Removed — NORIS
- 2010-03-04 Listing Removed — NORIS
- 2009-11-25 Listed $37,500 NORIS
- 2009-11-25 Listed $42,000 NORIS
- 2009-09-30 Listing Removed — NORIS
- 2009-03-30 Listed $45,000 NORIS
Property tax history
+7.0%/yrLatest (2025): $963 · +1.6% YoY. Source: county tax records.
Cash-flow waterfall
monthlySold comps — $/sqft
last 12 mo · ≤1 miLoading sold comps…