646 W Seitz St · Haysville, IN
Flood risk 1/10 · Minimal
- FEMA flood zone
- X (unshaded)
- Chance of flooding over 30 yrs
- 0.0%
- Est. flood insurance / yr
- $507 – $1,088
Fire risk 1/10 · Minimal
- Est. fire insurance / yr
- $717 – $1,331
Heat risk 5/10 · Moderate
- Hot days now (above 104°F)
- 7 days/yr
- Hot days in 30 yrs
- 19 days/yr
Wind risk 2/10 · Minimal
- Chance of severe wind over 30 yrs
- 3.0%
Air-quality risk 2/10 · Minimal
- Unhealthy air days now
- 1 days/yr
- Unhealthy air days in 30 yrs
- 2 days/yr
Risk factors via First Street. Map © Google.
Why this score? — see what drove the C+ grade
The composite is a weighted blend of 9 inputs, each scored 0–100. Each bar is that input's sub-score; the figure is the points it added to the 100-point composite (weight × sub-score).
- Cash flow +26.0/30.0
- DSCR +8.8/10.0
- ARV discount +7.5/15.0
- 1% rule +5.8/10.0
- Schools +4.5/10.0
- Rent growth +2.5/5.0
- Livability +2.5/5.0
- Condition / age +2.5/5.0
- Appreciation +0.0/10.0
$139,000
🖨 Deal sheet 📄 Offer letter ✓ Due diligence
Listing remarks
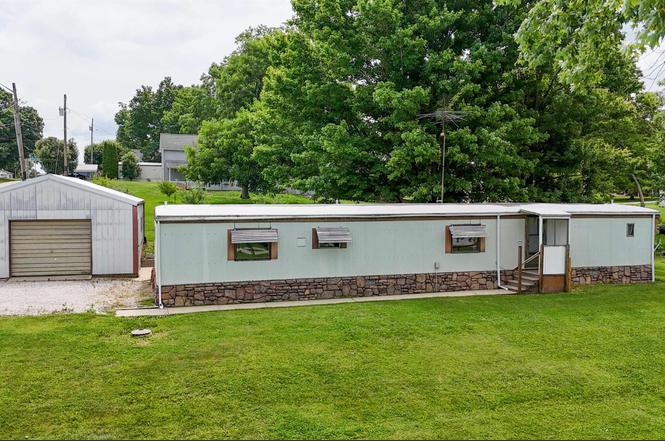
Discover the potential in this 3-bedroom, 2-bath home set on a generously sized lot with plenty of outdoor space to enjoy. The split-bedroom layout offers added privacy, while the open living and dining area provides a comfortable setting for everyday living or entertaining. Step outside to appreciate the expansive yard—perfect for gardening, pets, or creating your own outdoor retreat. With ample space for parking and room to personalize, this property presents a great opportunity for buyers looking to add their own touches and build equity over time. Additional features include a detached garage, offering convenient storage, workspace, or covered parking options. Whether you're an in
Key facts
- Split-bedroom layout
- Expansive yard
- Outdoor space
Tags
Property features AI
Finance
- Financial info: Annual tax amount reported
Exterior
- Parking: Detached 1-car garage
- Utilities: Public water; Public sewer
- Home design: Manufactured home; Residential property
- Construction: Aluminum siding construction
- Exterior features: Aluminum siding; 0.2-acre lot
Interior
- Bedrooms: Main-level bedrooms
- Bathrooms: Two full bathrooms on the main level
- Heating & cooling: Central air conditioning; Forced-air heating
- Interior features: Crawl space basement; 3 total rooms
- Laundry & utility: Main-level laundry
Neighborhood map
What this means for you Summary
Snapshot
- This is a 3-bed/1.0-bath single-family listed at $139k.
Deal economics
- At list price, monthly cash flow is $346 ($4k/yr) — positive.
- The deal already cash-flows at list — no discount required.
- Meets the 1% rule at list price ($2k rent vs $139k).
Location & tenants
- Location reads: area grade C — affects rentability + tenant quality, not the cash-flow math above.
- Northeast Dubois County School Corporation (rural): math 56% / reading 48% proficiency, ranked #40 of 301 in IN (top 13%) — acceptable for families but not a draw, mixed tenant base, ~2y average lease; only 17% free/reduced lunch — higher-income household profile.
- Zoned schools: Northeast Dubois Elementary School (235 students, 29% FRL); Northeast Dubois Jr/Sr High School (math 47% / reading 57%, grade D+, #106 of 369 statewide, top 31%, 368 students, 25% FRL).
- Market conditions: 14 active listings in the ZIP; 197 units permitted in Dubois County in 2024 (20 in 5+ unit buildings).
Forward outlook
- Local home prices are declining (-3.0%/yr); year-one equity from $961 of loan paydown is wiped out by about $4k of value loss. Plan a longer hold.
- Dubois County population projected to shrink 5% by 2050 — rents likely to lag national; underwrite the cash flow, not the appreciation.
Negotiation context
- Only 3 days on market — expect competitive offers; lowballing is unlikely to land.
Risks & watch-outs
- Climate carrying-cost: extreme-heat days projected 7→19/yr by 2055 (HVAC capex compounding) — expect insurance premiums to compound above CPI over the hold.
Questions for the listing agent
- Is there a deadline driving the sale (1031 exchange, divorce, estate, relocation)? That informs how much negotiation room exists.
- What's the average days-on-market for RENTAL listings here right now (not sales)? A rising rental-DOM trend means longer vacancies and softer asking-rent achievability than the comps imply.
- What's the recent tenant-quality profile in this submarket — average credit score on applications, eviction rate, late-payment / NSF rate, and stable-employment percentage? A property-management company in the area should have these aggregated.
- How much new for-sale + rental construction is in the pipeline within 1–3 miles? Heavy new supply typically softens prices + rents 12–24 months out; constrained supply supports both.
Investment metrics
- 1% rule
- 1.08% ✓
- Cap rate
- 9.28%
- Cash-on-cash
- 10.68%
- DSCR
- 1.48
- GRM
- 7.7
CMA / ARV
No comps found within radius.
Projected returns pro-forma
-3.0% appreciation · 3.0% rent growth · sell at horizon
- IRR
- -0.3%
- Equity multiple
- 0.99×
- Total profit
- $-514
- Equity at exit
- $20,725
- IRR
- 9.3%
- Equity multiple
- 1.71×
- Total profit
- $27,756
- Equity at exit
- $12,018
Cash invested: $38,920 (down + closing). Projections, not guarantees.
Landlord ↔ Tenant lean methodology
- Overall (STATE)
- 90 Strongly Landlord-Friendly
- State Indiana
- 90 Strongly Landlord-Friendly · R+11
- County
- — inherits STATE
- City
- — inherits STATE
ZIP-level market 47546
- Home prices YoY
- -25.3%
- Active inventory
- 14
- Price-to-rent
- 7.7×
Monthly cashflow live
- Estimated rent
- $1,506 medium interval (Pro) →
- Mortgage (P&I)
- −$729
- Tax from tax record
- −$56 /mo · $676/yr
- Insurance
- −$58
- HOA
- −$0
- Vacancy / Maint / Mgmt
- −$316
- Net cashflow
- $346
Break-even live
Sensitivity live
| Price | -10% $425 | -5% $386 | +0% $346 | +5% $307 | +10% $268 |
|---|---|---|---|---|---|
| Rent | -10% $227 | -5% $287 | +0% $346 | +5% $406 | +10% $465 |
| Rate | -1.0pp $416 | -0.5pp $382 | base $346 | +0.5pp $310 | +1.0pp $274 |
UW: 25.0% down · 7.5% · 30yr · 1.5% tax · 5.0% vac · 8.0% maint · 8.0% mgmt
Financing live
Cash to close
- Down payment
- $34,750
- Closing costs
- $4,170
- Reserves months
- —
- Total cash needed
- —
Loan-product check · same deal, 3 products live
Conventional
25% down · 7.5% · 30yr
- Down + closing
- —
- Monthly P&I
- —
- Monthly cashflow
- —
- DSCR
- —
- Eligible?
- —
Personal DTI + credit; lowest rate.
DSCR
20% down · 8.5% · 30yr
- Down + closing
- —
- Monthly P&I
- —
- Monthly cashflow
- —
- DSCR
- —
- Eligible?
- —
No personal income docs; deal must DSCR.
Hard money
10% down · 12.0% · 12mo
- Down + closing
- —
- Monthly P&I
- —
- Monthly cashflow
- —
- DSCR
- —
- Eligible?
- —
Short-term bridge; refi at stabilization.
Listing history 4 events
-
2026-06-19days on market $139,000 Active 3 DOM
-
2026-06-18days on market $139,000 Active 2 DOM
-
2026-06-17remarks 693-char remark
-
2026-06-17$139,000 Active 1 DOM
ⓘ Source: listings_history table (triggers on properties + properties_extension) + one-shot
backfill from property_details.listing_events for pre-trigger history.
Tax reassessment forecast IN · Partial reset (capped growth)
- Current annual tax
- $676 · $56/mo
- Projected year-2 tax
- $929 · $77/mo
- Expected delta
- +$253/yr (+$21/mo · 37.4%)
ⓘ Screening estimate from a state-policy table — verify with the county assessor before closing.
Climate risk First Street
- Flood 1/10 Low FEMA zone X (unshaded) · 0% chance over 30 yrs
- Wildfire 1/10 Low
- Heat 5/10 Major 7 d/yr ≥104°F today · 19 d/yr by 30 yrs out
- Wind 2/10 Low 3% chance of damaging wind over 30 yrs
- Air quality 2/10 Low 1 unhealthy d/yr today · 2 by 30 yrs out
Nearby sold comps map
Loading sold comps map…
Walkable amenities ~0.75 mi
Loading nearby amenities…
Taxation est. · year 1
- Rental income
- $18,068
- − Mortgage interest
- −$7,786
- − Property taxes
- −$676
- − Insurance
- −$695
- − Repairs & maintenance
- −$1,445
- − Management
- −$1,445
- − Depreciation
- −$4,044
- Taxable income
- $1,977
- Est. tax owed @ 24.0%
- −$474
- After-tax cash flow
- $3,682/yr
For passive investors: Depreciation is non-cash, so a rental often shows a tax loss while cash-flowing — sheltering income. Rental losses are passive: they offset passive income freely, and up to $25,000/yr can offset ordinary (W-2) income if you actively participate and your MAGI is under $100k (phasing out to $0 by $150k); unused losses carry forward. On sale, claimed depreciation is recaptured at up to 25%, and gains may owe capital-gains tax (a 1031 exchange can defer both). Figures are a year-1 estimate at your 24.0% rate — not tax advice; consult a CPA.
Schools (NCES district)
- District
- Northeast Dubois County School Corporation
- NCES district ID
- 1808120
- Math proficiency
- 56% ▼ -5.00%
- Reading proficiency
- 48% ▼ -3.00%
- Median HH income
- $54,828
- Composite
- 44.95/100
- National rank
- #2707
- State rank
- #40 of 301 in IN
Livability — Haysville
No livability data for this city. (Only ~50 U.S. cities are tracked.)
Census & demographics
- Census place
- Haysville, IN
- County
- Dubois County · 22,191 people
- Metro
- Jasper, IN
- Population (ZIP)
- 22,191
- Household income
- $73,659
- Rent vs Own
- Severe rent burden
- 347.0
Population outlook (Dubois County) Hauer SSP2
- Today (2025)
- 43,036 people
- By 2030
- 43,079 · +0.1%
- By 2040
- 42,531 · -1.2%
- By 2050
- 40,762 · -5.3%
- By 2075
- 36,227 · -15.8%
- By 2100
- 28,083 · -34.7%
Race, ethnicity, and origin ACS 2023
- Neighborhood character
- Predominantly White (90%)
- Race & ethnicity
- White 90% Hispanic / Latino 6% Two or more races 3% Asian 1%
- Hispanic origin (detail)
- Mexican 4%
- Common ancestry
- Lithuanian 2% Slovak 1% Romanian 1%
- Foreign-born
- 5% · Canada
- Languages at home
- 93% English-only · Spanish 5% Other Indo-European 1% German/W. Germanic 1%
Political lean MEDSL · Dubois
- 2024 margin
- Solid R (+42.2) · D 27.8% · R 70.0% · Other 2.2%
- 2008→2024 swing
- -38.0pp toward R · 2008: -4.2pp · 2024: -42.2pp
- All cycles
- 2024: R+42.2 2020: R+40.1 2016: R+40.0 2012: R+27.7 2008: R+4.2
Not yet ingested
- Civics
- —
Market trends
- HPI YoY
- ▼ -64.86%
- Current HPI
- 191.3025
- Rent YoY
- —
- Metro
- Jasper, IN
- State GDP YoY
- ▲ 2.90%
- F500 in state
- 18
Industry mix (Fortune 500 HQ in IN)
| Industry | F500 HQs | Revenue |
|---|---|---|
| Industrial Machinery | 2 | $37B |
|
||
| Healthcare | 1 | $177B |
|
||
| Pharmaceuticals | 1 | $45B |
|
||
| Metals / Steel | 1 | $18B |
|
||
| Agriculture | 1 | $17B |
|
||
| Packaging | 1 | $12B |
|
||
Price history
1 event — show timeline
- 2026-06-16 Listed $139,000 IRMLS
Property tax history
+9.3%/yrLatest (2024): $676 · +3.3% YoY. Source: county tax records.
Cash-flow waterfall
monthlySold comps — $/sqft
last 12 mo · ≤1 miLoading sold comps…