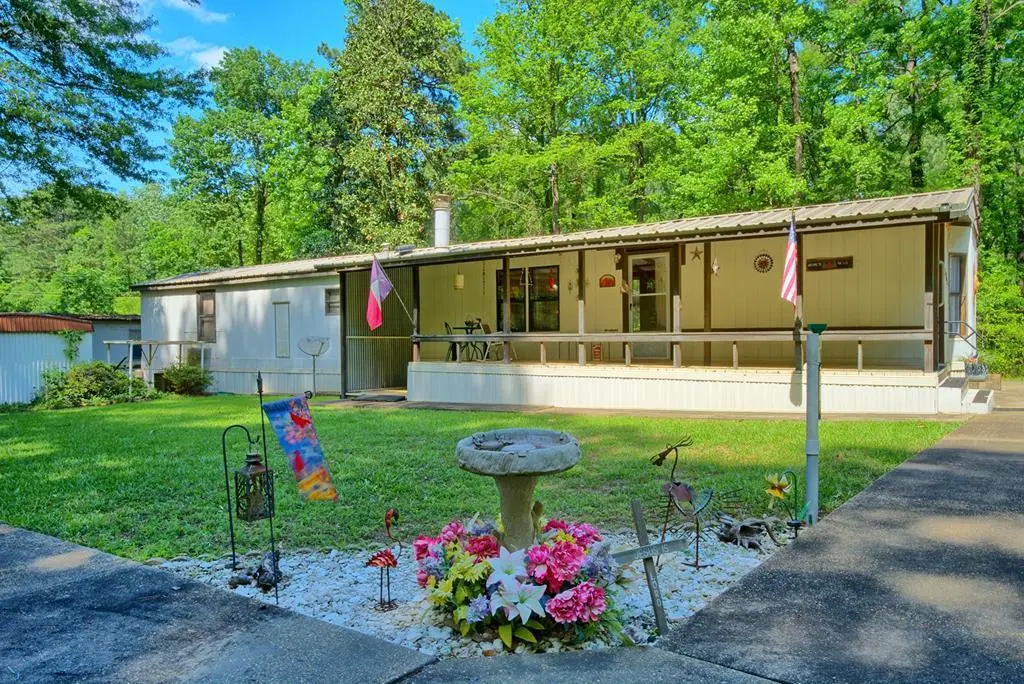
125 Coral Dr · Milam, TX
Flood risk 1/10 · Minimal
- FEMA flood zone
- —
- Chance of flooding over 30 yrs
- 0.0%
- Est. flood insurance / yr
- —
Fire risk 3/10 · Minor
- Est. fire insurance / yr
- $1,222 – $2,270
Heat risk 7/10 · Major
- Hot days now (above 111°F)
- 7 days/yr
- Hot days in 30 yrs
- 22 days/yr
Wind risk 8/10 · Major
- Chance of severe wind over 30 yrs
- 80.0%
Air-quality risk 1/10 · Minimal
- Unhealthy air days now
- 0 days/yr
- Unhealthy air days in 30 yrs
- 0 days/yr
Risk factors via First Street. Map © Google.
Why this score? — see what drove the C- grade
The composite is a weighted blend of 9 inputs, each scored 0–100. Each bar is that input's sub-score; the figure is the points it added to the 100-point composite (weight × sub-score).
- Cash flow +21.0/30.0
- ARV discount +7.5/15.0
- DSCR +6.7/10.0
- 1% rule +5.0/10.0
- Schools +3.2/10.0
- Livability +3.0/5.0
- Rent growth +2.5/5.0
- Condition / age +2.5/5.0
- Appreciation +0.0/10.0
$89,000
🖨 Deal sheet 📄 Offer letter ✓ Due diligence
Listing remarks MLS
Cute Getaway Near Toledo Bend! Clean and immaculate 2BR/2BA mobile home being sold furnished and move-in ready! This charming property features a nice covered front porch, new carport cover, small workshop, and additional storage building. There's also an RV setup with electric and sewer hookups already in place. Located in an HOA subdivision with dues of only $25/month, owners enjoy access to a small golf course, 2 private boat ramps, playground area, and pavilion. Conveniently located close to the new Pendleton Harbor SRA Park, this property would make a fantastic Airbnb investment, weekend retreat, or full-time getaway near beautiful Toledo Bend Reservoir.
Key facts
- Covered front porch
- Small workshop
- New carport cover
Tags
Neighborhood map
What this means for you Summary
Snapshot
- This is a 2-bed/2.0-bath manufactured listed at $89k.
Deal economics
- At list price, monthly cash flow is $125 ($2k/yr) — positive.
- The deal already cash-flows at list — no discount required.
- Meets the 1% rule at list price ($892 rent vs $89k).
- Recommended offer: $88k (1.5% below list) — sets the bar for market timing.
- Cap rate 8.0% vs local median 1.9% in Milam — top-decile yield for the area; either an underpriced asset or a hidden risk that comps aren't pricing in. Stress-test before assuming the spread holds.
Location & tenants
- Location reads 59/100 on livability (#1,169 in TX) — a working-class tenant base; expect higher turnover. Strengths: cost of living A+, crime A, housing A-; Watch: schools F, amenities F, commute F.
- Hemphill ISD (rural): math 37% / reading 41% proficiency, ranked #466 of 826 in TX (top 56%) — families likely to look elsewhere, expect single-tenant / working-renter base with shorter leases.
- Market conditions: 235 active listings in the ZIP.
Forward outlook
- Local home prices are declining (-3.0%/yr); year-one equity from $615 of loan paydown is wiped out by about $3k of value loss. Plan a longer hold.
- Sabine County population projected at -23% by 2050 — secular population decline; favor cash flow + early exit over multi-decade hold.
Negotiation context
- It's been on market 29 days — a 2% lower offer ($88k) is reasonable based on typical stale-listing flexibility.
Risks & watch-outs
- Climate carrying-cost: severe wind risk, 80% chance of damaging wind over 30y; extreme-heat days projected 7→22/yr by 2055 (HVAC capex compounding) — expect insurance premiums to compound above CPI over the hold.
Questions for the listing agent
- What does the HOA fee cover, when was the last increase, and are there any pending special assessments or reserve-fund shortfalls?
- Is there a deadline driving the sale (1031 exchange, divorce, estate, relocation)? That informs how much negotiation room exists.
- Schools are F-rated, which usually means shorter tenancies and higher turnover. Who's the typical renter profile here, and what's been the actual vacancy rate?
- What's the average days-on-market for RENTAL listings here right now (not sales)? A rising rental-DOM trend means longer vacancies and softer asking-rent achievability than the comps imply.
- What's the recent tenant-quality profile in this submarket — average credit score on applications, eviction rate, late-payment / NSF rate, and stable-employment percentage? A property-management company in the area should have these aggregated.
- How much new for-sale + rental construction is in the pipeline within 1–3 miles? Heavy new supply typically softens prices + rents 12–24 months out; constrained supply supports both.
Investment metrics
- 1% rule
- 1.00% ✓
- Cap rate
- 7.98%
- Cash-on-cash
- 6.03%
- DSCR
- 1.27
- GRM
- 8.3
CMA / ARV
No comps found within radius.
Projected returns pro-forma
-3.0% appreciation · 3.0% rent growth · sell at horizon
- IRR
- -7.0%
- Equity multiple
- 0.74×
- Total profit
- $-6,451
- Equity at exit
- $13,270
- IRR
- 2.6%
- Equity multiple
- 1.19×
- Total profit
- $4,623
- Equity at exit
- $7,695
Cash invested: $24,920 (down + closing). Projections, not guarantees.
Landlord ↔ Tenant lean methodology
- Overall (STATE)
- 87 Strongly Landlord-Friendly
- State Texas
- 87 Strongly Landlord-Friendly · R+5
- County
- — inherits STATE
- City
- — inherits STATE
ZIP-level market 75948
- Home prices YoY
- -17.7%
- Active inventory
- 235
- Price-to-rent
- 8.3×
Monthly cashflow live
- Estimated rent
- $892 medium interval (Pro) →
- Mortgage (P&I)
- −$467
- Tax from tax record
- −$51 /mo · $608/yr
- Insurance
- −$37
- HOA
- −$25
- Vacancy / Maint / Mgmt
- −$187
- Net cashflow
- $125
Break-even live
UW: 25.0% down · 7.5% · 30yr · 1.5% tax · 5.0% vac · 8.0% maint · 8.0% mgmt
Financing live
Cash to close
- Down payment
- $22,250
- Closing costs
- $2,670
- Reserves months
- —
- Total cash needed
- —
Loan-product check · same deal, 3 products live
Conventional
25% down · 7.5% · 30yr
- Down + closing
- —
- Monthly P&I
- —
- Monthly cashflow
- —
- DSCR
- —
- Eligible?
- —
Personal DTI + credit; lowest rate.
DSCR
20% down · 8.5% · 30yr
- Down + closing
- —
- Monthly P&I
- —
- Monthly cashflow
- —
- DSCR
- —
- Eligible?
- —
No personal income docs; deal must DSCR.
Hard money
10% down · 12.0% · 12mo
- Down + closing
- —
- Monthly P&I
- —
- Monthly cashflow
- —
- DSCR
- —
- Eligible?
- —
Short-term bridge; refi at stabilization.
HOA detail
- Monthly dues
- $25 · $300/yr
- Likely covers
- sewerelectric
Listing history 15 events
-
2026-06-18days on market $89,000 Active 29 DOM
-
2026-06-17days on market $89,000 Active 28 DOM
-
2026-06-16days on market $89,000 Active 27 DOM
-
2026-06-15days on market $89,000 Active 26 DOM
-
2026-06-13days on market $89,000 Active 24 DOM
-
2026-06-12days on market $89,000 Active 23 DOM
-
2026-06-10days on market $89,000 Active 20 DOM
-
2026-06-08days on market $89,000 Active 19 DOM
-
2026-06-08days on market $89,000 Active 18 DOM
-
2026-06-07days on market $89,000 Active 17 DOM
-
2026-06-03days on market $89,000 Active 14 DOM
-
2026-06-02days on market $89,000 Active 13 DOM
-
2026-06-01days on market $89,000 Active 12 DOM
-
2026-05-31days on market $89,000 Active 11 DOM
-
2026-05-14$89,000 Active 667-char remark
Show marketing remark (667 chars)
Cute Getaway Near Toledo Bend! Clean and immaculate 2BR/2BA mobile home being sold furnished and move-in ready! This charming property features a nice covered front porch, new carport cover, small workshop, and additional storage building. There's also an RV setup with electric and sewer hookups already in place. Located in an HOA subdivision with dues of only $25/month, owners enjoy access to a small golf course, 2 private boat ramps, playground area, and pavilion. Conveniently located close to the new Pendleton Harbor SRA Park, this property would make a fantastic Airbnb investment, weekend retreat, or full-time getaway near beautiful Toledo Bend Reservoir.
ⓘ Source: listings_history table (triggers on properties + properties_extension) + one-shot
backfill from property_details.listing_events for pre-trigger history.
Tax reassessment forecast TX · Resets to sale price
- Current annual tax
- $608 · $51/mo
- Projected year-2 tax
- $1,629 · $136/mo
- Expected delta
- +$1,021/yr (+$85/mo · 168.1%)
ⓘ Screening estimate from a state-policy table — verify with the county assessor before closing.
Climate risk First Street
- Flood 1/10 Low 0% chance over 30 yrs
- Wildfire 3/10 Moderate
- Heat 7/10 Severe 7 d/yr ≥111°F today · 22 d/yr by 30 yrs out
- Wind 8/10 Severe 80% chance of damaging wind over 30 yrs
- Air quality 1/10 Low 0 unhealthy d/yr today · 0 by 30 yrs out
Nearby sold comps map
Loading sold comps map…
Walkable amenities ~0.75 mi
Loading nearby amenities…
Taxation est. · year 1
- Rental income
- $10,705
- − Mortgage interest
- −$4,985
- − Property taxes
- −$608
- − Insurance
- −$445
- − Repairs & maintenance
- −$856
- − Management
- −$856
- − HOA
- −$300
- − Depreciation
- −$2,589
- Taxable income
- $65
- Est. tax owed @ 24.0%
- −$16
- After-tax cash flow
- $1,488/yr
For passive investors: Depreciation is non-cash, so a rental often shows a tax loss while cash-flowing — sheltering income. Rental losses are passive: they offset passive income freely, and up to $25,000/yr can offset ordinary (W-2) income if you actively participate and your MAGI is under $100k (phasing out to $0 by $150k); unused losses carry forward. On sale, claimed depreciation is recaptured at up to 25%, and gains may owe capital-gains tax (a 1031 exchange can defer both). Figures are a year-1 estimate at your 24.0% rate — not tax advice; consult a CPA.
Schools (NCES district)
- District
- Hemphill ISD
- NCES district ID
- 4822890
- Math proficiency
- 37% ▼ -1.00%
- Reading proficiency
- 41% ▲ 4.00%
- Median HH income
- $33,330
- Composite
- 32.06/100
- National rank
- #5821
- State rank
- #466 of 826 in TX
Livability — Milam
- Score
- 59/100
- State rank
- #1169
- US rank
- #20453
Category grades
Schools grade is shown separately in the Schools card above.
Census & demographics
- Census place
- Milam, TX
- Population (ZIP)
- 5,218
Population outlook (Sabine County) Hauer SSP2
- Today (2025)
- 9,354 people
- By 2030
- 8,806 · -5.9%
- By 2040
- 7,871 · -15.9%
- By 2050
- 7,224 · -22.8%
- By 2075
- 6,351 · -32.1%
- By 2100
- 5,465 · -41.6%
Race, ethnicity, and origin ACS 2023
- Neighborhood character
- Predominantly White (78%)
- Race & ethnicity
- White 78% Hispanic / Latino 7% Black 6% Two or more races 6% Asian 3% Native American 2%
- Hispanic origin (detail)
- Mexican 5%
- Common ancestry
- Lithuanian 5% Italian 2% Serbian 1%
- Foreign-born
- 2% · Canada
- Languages at home
- 96% English-only · Vietnamese 2% Spanish 1%
Political lean MEDSL · Sabine
- 2024 margin
- Solid R (+78.5) · D 10.6% · R 89.1%
- 2008→2024 swing
- -23.7pp toward R · 2008: -54.8pp · 2024: -78.5pp
- All cycles
- 2024: R+78.5 2020: R+75.0 2016: R+72.8 2012: R+63.9 2008: R+54.8
Not yet ingested
- Civics
- —
Market trends
- HPI YoY
- ▼ -34.26%
- Current HPI
- 159.0093
- Rent YoY
- —
- Metro
- —
- State GDP YoY
- ▲ 3.95%
- F500 in state
- 110
Industry mix (Fortune 500 HQ in TX)
| Industry | F500 HQs | Revenue |
|---|---|---|
| Energy | 16 | $1,198B |
|
||
| Technology | 5 | $198B |
|
||
| Engineering / Construction | 4 | $72B |
|
||
| Energy Services | 3 | $60B |
|
||
| Utilities | 3 | $41B |
|
||
| Healthcare | 2 | $330B |
|
||
Price history
1 event — show timeline
- 2026-05-14 Listed $89,000 Deep East Texas MLS
Property tax history
+4.7%/yrLatest (2025): $608 · +15.3% YoY. Source: county tax records.
Cash-flow waterfall
monthlySold comps — $/sqft
last 12 mo · ≤1 miLoading sold comps…