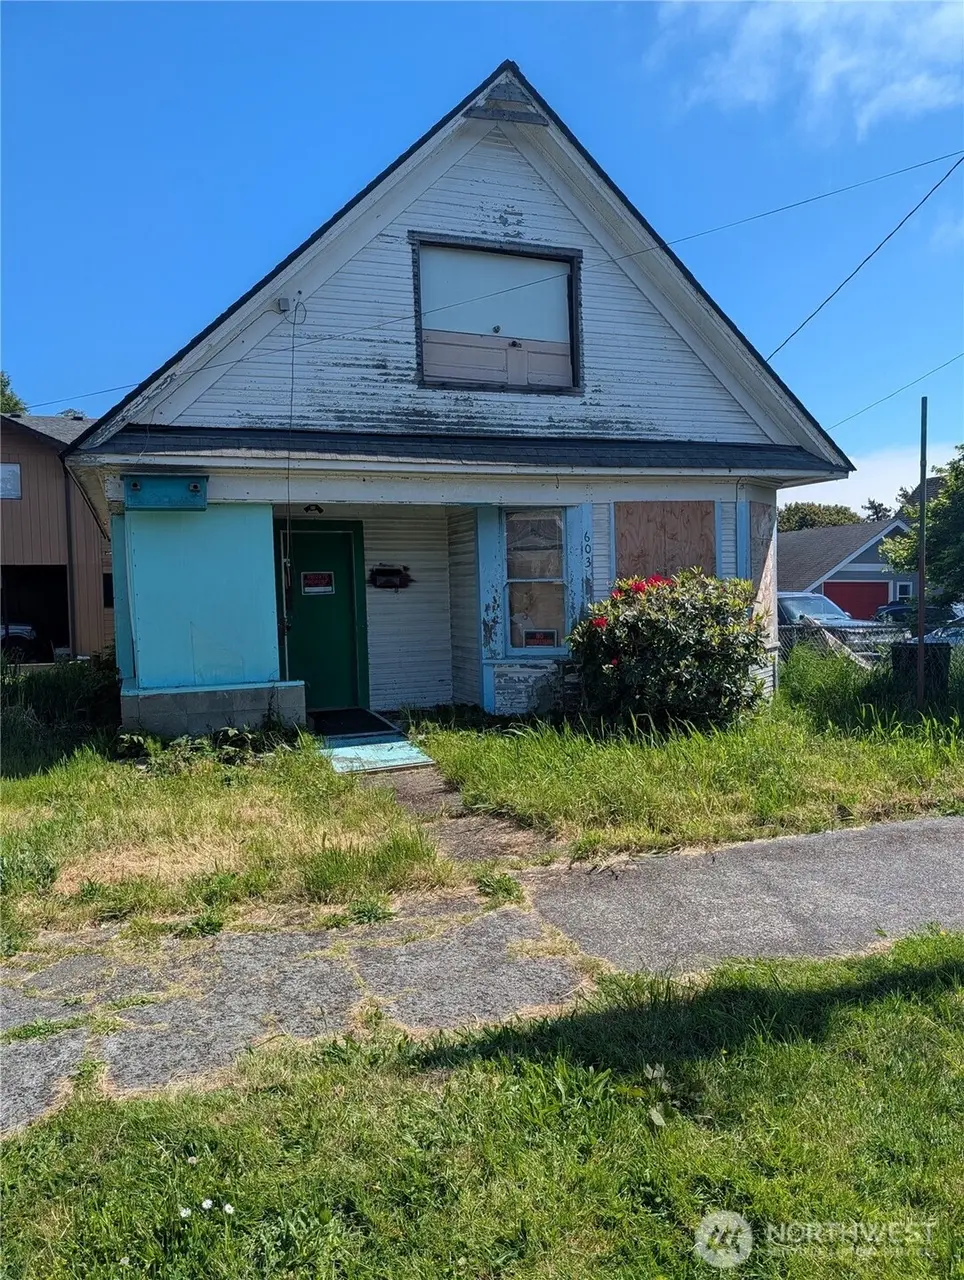
603 6th St · Hoquiam, WA
Flood risk 6/10 · Moderate
- FEMA flood zone
- AE
- Chance of flooding over 30 yrs
- 0.75%
- Est. flood insurance / yr
- $1,737 – $8,500
Fire risk 1/10 · Minimal
- Est. fire insurance / yr
- $604 – $1,122
Heat risk 1/10 · Minimal
- Hot days now (above 77°F)
- 8 days/yr
- Hot days in 30 yrs
- 19 days/yr
Wind risk 1/10 · Minimal
- Chance of severe wind over 30 yrs
- —
Air-quality risk 6/10 · Moderate
- Unhealthy air days now
- 6 days/yr
- Unhealthy air days in 30 yrs
- 6 days/yr
Risk factors via First Street. Map © Google.
Why this score? — see what drove the B- grade
The composite is a weighted blend of 9 inputs, each scored 0–100. Each bar is that input's sub-score; the figure is the points it added to the 100-point composite (weight × sub-score).
- Cash flow +30.0/30.0
- 1% rule +10.0/10.0
- DSCR +10.0/10.0
- ARV discount +7.5/15.0
- Livability +3.8/5.0
- Schools +3.2/10.0
- Rent growth +2.5/5.0
- Condition / age +2.5/5.0
- Appreciation +0.0/10.0
$80,000
🖨 Deal sheet 📄 Offer letter ✓ Due diligence
Listing remarks
Fix and flip or add this little gem to your rental portfolio. It's in a stable, desirable neighborhood of well-kept homes. It's size and layout make it a good entry-level project for an investor or DIYer. There's so much potential for the buyer who has determination and a vision. Layout was for a 2 bedroom, possible 3rd, with a single bath. Buyer advised to do their due diligence.
Key facts
- 2,091 sq ft lot
- Built 1910
- Listed 23 days
Property features AI
Finance
- Financial info: Listing terms: Cash
Exterior
- Parking: No dedicated parking
- Utilities: Community water (City of Hoquiam); Sewer connected (City of Hoquiam); Electric water heater; Power provided by Grays Harbor PUD; Cable and internet connected (Xfinity)
- Home design: Single-family residence; One and one-half story; Main-level entry; Built on lot
- Construction: Wood construction; Composition roof; Block and pier (pillar/post/pier) foundation; Built with electric energy source
- Exterior features: Wood exterior products; Paved lot with sidewalk; Level topography; Has a view
Interior
- Bedrooms: 2 bedrooms (1 on main level, 1 on upper level)
- Bathrooms: 1 full bathroom (main level) with bathtub and shower
- Heating & cooling: Forced air heating; No cooling
- Interior features: Water heater
Neighborhood map
What this means for you Summary
Snapshot
- This is a 2-bed/1.0-bath single-family listed at $80k.
Deal economics
- At list price, monthly cash flow is $323 ($4k/yr) — positive.
- The deal already cash-flows at list — no discount required.
- Meets the 1% rule at list price ($2k rent vs $80k).
- Recommended offer: $79k (1.5% below list) — sets the bar for market timing.
- Cap rate 17.5% vs local median 3.8% in Hoquiam — top-decile yield for the area; either an underpriced asset or a hidden risk that comps aren't pricing in. Stress-test before assuming the spread holds.
Location & tenants
- Location reads 75/100 on livability (#171 in WA, #4,268 nationally) — a middle-class / working-renter tenant base. Strengths: commute A+, cost of living A+, housing A+; Watch: health & safety C-, employment D, amenities F.
- Hoquiam School District (town): math 30% / reading 41% proficiency, ranked #250 of 291 in WA (top 86%) — families likely to look elsewhere, expect single-tenant / working-renter base with shorter leases.
- Zoned schools: Hoquiam High School (450 students, 66% FRL).
- Market conditions: 154 active listings in the ZIP; 3 comparable units currently listed for rent nearby; rentals lingering (median 44d on market — plan ~5-8 weeks vacancy on turnover, expect pricing pressure); 100% of comp listings sitting > 30 days — soft ceiling on asking rent; 297 units permitted in Grays Harbor County in 2024 (17 in 5+ unit buildings).
Forward outlook
- Local home prices are declining (-3.0%/yr); year-one equity from $553 of loan paydown is wiped out by about $2k of value loss. Plan a longer hold.
- Grays Harbor County population projected at -24% by 2050 — secular population decline; favor cash flow + early exit over multi-decade hold.
- At projected returns (-3.0% appreciation + 3.0% rent growth), your $22k cash investment doubles in ~7 years — after that, you're playing with house money.
Negotiation context
- It's been on market 24 days — a 2% lower offer ($79k) is reasonable based on typical stale-listing flexibility.
- 2 sale attempts since 8y ago with the ask held roughly flat each time — persistent listings suggest the price (not the market) is what's stuck; bring a comps-based counter.
- Current owner paid $27k; list at $80k implies a 196% gain — meaningful room to come down on a strong offer.
Risks & watch-outs
- Watch-outs: flood insurance adds $427/mo; built in 1910 — expect roof / HVAC / electrical / plumbing capex.
- Climate carrying-cost: in FEMA flood zone AE (mandatory federal flood insurance) — expect insurance premiums to compound above CPI over the hold.
Questions for the listing agent
- Built in 1910 — when were the roof, HVAC, electrical panel, plumbing, and water heater last replaced?
- What's the actual annual flood-insurance premium (NFIP or private), and is the property in a SFHA with mandatory coverage?
- Is there a deadline driving the sale (1031 exchange, divorce, estate, relocation)? That informs how much negotiation room exists.
- Schools are D-rated, which usually means shorter tenancies and higher turnover. Who's the typical renter profile here, and what's been the actual vacancy rate?
- What's the average days-on-market for RENTAL listings here right now (not sales)? A rising rental-DOM trend means longer vacancies and softer asking-rent achievability than the comps imply.
- What's the recent tenant-quality profile in this submarket — average credit score on applications, eviction rate, late-payment / NSF rate, and stable-employment percentage? A property-management company in the area should have these aggregated.
- How much new for-sale + rental construction is in the pipeline within 1–3 miles? Heavy new supply typically softens prices + rents 12–24 months out; constrained supply supports both.
Investment metrics
- 1% rule
- 2.02% ✓
- Cap rate
- 17.54%
- Cash-on-cash
- 40.16%
- DSCR
- 2.79
- GRM
- 4.1
CMA / ARV
- ARV (on-the-fly)
- $221,369
- Comps found
- 12
Show comp detail 12 sales within ~0.75 mi
| Address | Dist | Beds/Ba | Sqft | Sold | Price | $/sf | Match |
|---|---|---|---|---|---|---|---|
| 402 L St | 0.14mi | 2/1.0 | 1,052 (-9%) | 5mo | $255,000 | $242 | 74 |
| 816 Spruce St | 0.49mi | 2/1.0 | 1,199 (+4%) | 1mo | $274,000 | $229 | 70 |
| 401 Emerson Ave | 0.40mi | 3/1.0 (+1) | 1,196 (+3%) | 3mo | $249,885 | $209 | 69 |
| 432 Eklund Ave | 0.46mi | 2/1.0 | 1,088 (-6%) | 1mo | $190,000 | $175 | 67 |
| 624 L St | 0.05mi | 2/2.0 | 1,326 (+14%) | 4mo | $234,000 | $176 | 66 |
| 311 N St | 0.22mi | 2/1.0 | 1,269 (+10%) | 10mo | $220,500 | $174 | 65 |
| 213 Garfield St | 0.42mi | 2/1.0 | 1,226 (+6%) | 11mo | $115,500 | $94 | 62 |
| 324 Wheeler Ave | 0.63mi | 2/1.0 | 1,176 (+2%) | 15mo | $235,000 | $200 | 56 |
| 408 Karr Ave | 0.43mi | 3/1.0 (+1) | 1,284 (+11%) | 5mo | $211,500 | $165 | 53 |
| 245 Eklund Ave | 0.60mi | 3/1.0 (+1) | 1,288 (+11%) | 3mo | $246,000 | $191 | 46 |
| 231 Karr Ave | 0.58mi | 3/1.0 (+1) | 1,046 (-10%) | 12mo | $265,000 | $253 | 42 |
| 342 Wheeler Ave | 0.61mi | 3/1.0 (+1) | 996 (-14%) | 2mo | $105,000 | $105 | 41 |
Match score weights: distance 35% · size 25% · config 20% · recency 20%. Top-matched comps best support the ARV.
Projected returns pro-forma
-3.0% appreciation · 3.0% rent growth · sell at horizon
- IRR
- 8.9%
- Equity multiple
- 1.35×
- Total profit
- $7,883
- Equity at exit
- $11,928
- IRR
- 18.3%
- Equity multiple
- 2.54×
- Total profit
- $34,458
- Equity at exit
- $6,917
Cash invested: $22,400 (down + closing). Projections, not guarantees.
Landlord ↔ Tenant lean methodology
- Overall (STATE)
- 28 Tenant-Leaning
- State Washington
- 28 Tenant-Leaning · D+8
- County
- — inherits STATE
- City
- — inherits STATE
ZIP-level market 98550
- Active inventory
- 154
- Price-to-rent
- 4.1×
Monthly cashflow live
- Estimated rent
- $1,616 medium interval (Pro) →
- Mortgage (P&I)
- −$420
- Tax from tax record
- −$74 /mo · $891/yr
- Insurance
- −$33
- Flood insurance flood zone
- −$427 /mo · $5,118/yr
- HOA
- −$0
- Vacancy / Maint / Mgmt
- −$339
- Net cashflow
- $323
Break-even live
UW: 25.0% down · 7.5% · 30yr · 1.5% tax · 5.0% vac · 8.0% maint · 8.0% mgmt
Financing live
Cash to close
- Down payment
- $20,000
- Closing costs
- $2,400
- Reserves months
- —
- Total cash needed
- —
Loan-product check · same deal, 3 products live
Conventional
25% down · 7.5% · 30yr
- Down + closing
- —
- Monthly P&I
- —
- Monthly cashflow
- —
- DSCR
- —
- Eligible?
- —
Personal DTI + credit; lowest rate.
DSCR
20% down · 8.5% · 30yr
- Down + closing
- —
- Monthly P&I
- —
- Monthly cashflow
- —
- DSCR
- —
- Eligible?
- —
No personal income docs; deal must DSCR.
Hard money
10% down · 12.0% · 12mo
- Down + closing
- —
- Monthly P&I
- —
- Monthly cashflow
- —
- DSCR
- —
- Eligible?
- —
Short-term bridge; refi at stabilization.
Rent comps 3 comps
| Address | Beds | Baths | Sqft | Rent | $/sqft | DOM | Units | Dist |
|---|---|---|---|---|---|---|---|---|
| 2435 Bay Ave Hoquiam, WA | 2.0 | 1.0 | 900 | $1,399 | $1.55 | 43d | 1 | 1.02mi |
| 2515 Sumner Ave Unit 2 Hoquiam, WA | 2.0 | 1.0 | 700 | $1,250 | $1.79 | 43d | 1 | 1.05mi |
| 335 Endresen Rd Hoquiam, WA | 3.0 | 1.0 | 914 | $2,300 | $2.52 | 43d | 1 | 1.19mi |
Listing history 20 events
-
2026-06-19days on market $80,000 Active 24 DOM
-
2026-06-18days on market $80,000 Active 23 DOM
-
2026-06-17days on market $80,000 Active 22 DOM
-
2026-06-16days on market $80,000 Active 21 DOM
-
2026-06-15days on market $80,000 Active 20 DOM
-
2026-06-14days on market $80,000 Active 18 DOM
-
2026-06-12days on market $80,000 Active 17 DOM
-
2026-06-09days on market $80,000 Active 14 DOM
-
2026-06-08days on market $80,000 Active 13 DOM
-
2026-06-07days on market $80,000 Active 12 DOM
-
2026-06-05days on market $80,000 Active 9 DOM
-
2026-06-03days on market $80,000 Active 8 DOM
-
2026-06-02days on market $80,000 Active 7 DOM
-
2026-06-01days on market $80,000 Active 6 DOM
-
2026-05-31days on market $80,000 Active 5 DOM
-
2026-05-30days on market $80,000 Active 4 DOM
-
2026-05-26$80,000 Active
-
2018-06-05soldstatus $27,000 Sold
-
2018-05-23status Pending
-
2018-05-16$30,000 Active
ⓘ Source: listings_history table (triggers on properties + properties_extension) + one-shot
backfill from property_details.listing_events for pre-trigger history.
Tax reassessment forecast WA · Resets to sale price
- Current annual tax
- $891 · $74/mo
- Projected year-2 tax
- $891 · $74/mo
- Expected delta
- $0/yr ($0/mo · 0.0%)
ⓘ Screening estimate from a state-policy table — verify with the county assessor before closing.
Climate risk First Street
- Flood 6/10 Major FEMA zone AE · 75% chance over 30 yrs
- Wildfire 1/10 Low
- Heat 1/10 Low 8 d/yr ≥77°F today · 19 d/yr by 30 yrs out
- Wind 1/10 Low
- Air quality 6/10 Major 6 unhealthy d/yr today · 6 by 30 yrs out
Nearby sold comps map
Loading sold comps map…
Walkable amenities ~0.75 mi
Loading nearby amenities…
Taxation est. · year 1
- Rental income
- $19,394
- − Mortgage interest
- −$4,481
- − Property taxes
- −$891
- − Insurance
- −$5,518
- − Repairs & maintenance
- −$1,551
- − Management
- −$1,551
- − Depreciation
- −$2,327
- Taxable income
- $3,072
- Est. tax owed @ 24.0%
- −$737
- After-tax cash flow
- $3,139/yr
For passive investors: Depreciation is non-cash, so a rental often shows a tax loss while cash-flowing — sheltering income. Rental losses are passive: they offset passive income freely, and up to $25,000/yr can offset ordinary (W-2) income if you actively participate and your MAGI is under $100k (phasing out to $0 by $150k); unused losses carry forward. On sale, claimed depreciation is recaptured at up to 25%, and gains may owe capital-gains tax (a 1031 exchange can defer both). Figures are a year-1 estimate at your 24.0% rate — not tax advice; consult a CPA.
Schools (NCES district)
- District
- Hoquiam School District
- NCES district ID
- 5303660
- Math proficiency
- 30% ▬ 0.00%
- Reading proficiency
- 41% ▲ 1.00%
- Median HH income
- $39,039
- Composite
- 32.31/100
- National rank
- #10914
- State rank
- #250 of 291 in WA
Livability — Hoquiam
- Score
- 75/100
- State rank
- #171
- US rank
- #4268
Category grades
Schools grade is shown separately in the Schools card above.
Census & demographics
- Census place
- Hoquiam, WA
- County
- Grays Harbor County · 44,693 people
- City population
- 12,316
- Metro
- Aberdeen, WA
- Population (ZIP)
- 12,316
- Household income
- $55,040
- Rent vs Own
- Severe rent burden
- 438.0
Population outlook (Grays Harbor County) Hauer SSP2
- Today (2025)
- 66,443 people
- By 2030
- 63,255 · -4.8%
- By 2040
- 56,466 · -15.0%
- By 2050
- 50,516 · -24.0%
- By 2075
- 39,296 · -40.9%
- By 2100
- 31,142 · -53.1%
Race, ethnicity, and origin ACS 2023
- Neighborhood character
- Predominantly White (82%)
- Race & ethnicity
- White 82% Hispanic / Latino 6% Two or more races 6% Native American 4% Asian 2% Black 1%
- Hispanic origin (detail)
- Mexican 5%
- Common ancestry
- Portuguese 6% Romanian 4% Slovak 3%
- Foreign-born
- 4% · Canada, China
- Languages at home
- 94% English-only · Spanish 4% Chinese 1% Russian/Polish/Slavic 1%
Political lean MEDSL · Grays Harbor
- 2024 margin
- Lean R (+6.0) · D 45.6% · R 51.6% · Other 2.8%
- 2008→2024 swing
- -20.6pp toward R · 2008: 14.6pp · 2024: -6.0pp
- All cycles
- 2024: R+6.0 2020: R+6.6 2016: R+7.1 2012: D+14.0 2008: D+14.6
Not yet ingested
- Civics
- —
Market trends
- HPI YoY
- ▼ -136.94%
- Current HPI
- 249.3102
- Rent YoY
- —
- Metro
- Aberdeen, WA
- State GDP YoY
- ▲ 4.65%
- F500 in state
- 22
Industry mix (Fortune 500 HQ in WA)
| Industry | F500 HQs | Revenue |
|---|---|---|
| Retail | 2 | $269B |
|
||
| Technology / Retail | 1 | $638B |
|
||
| Technology | 1 | $245B |
|
||
| Telecommunications | 1 | $38B |
|
||
| Food / Beverage | 1 | $36B |
|
||
| Automotive / Trucks | 1 | $34B |
|
||
Price history
+166.7% since first listed4 events — show timeline
- 2026-05-26 Listed $80,000 NWMLS as Distributed by MLS Grid
- 2018-06-05 Sold (MLS) $27,000 NWMLS as Distributed by MLS Grid
- 2018-05-23 Pending — NWMLS as Distributed by MLS Grid
- 2018-05-16 Listed $30,000 NWMLS as Distributed by MLS Grid
Property tax history
+9.9%/yrLatest (2026): $891 · +2.4% YoY. Source: county tax records.
Cash-flow waterfall
monthlySold comps — $/sqft
last 12 mo · ≤1 miLoading sold comps…