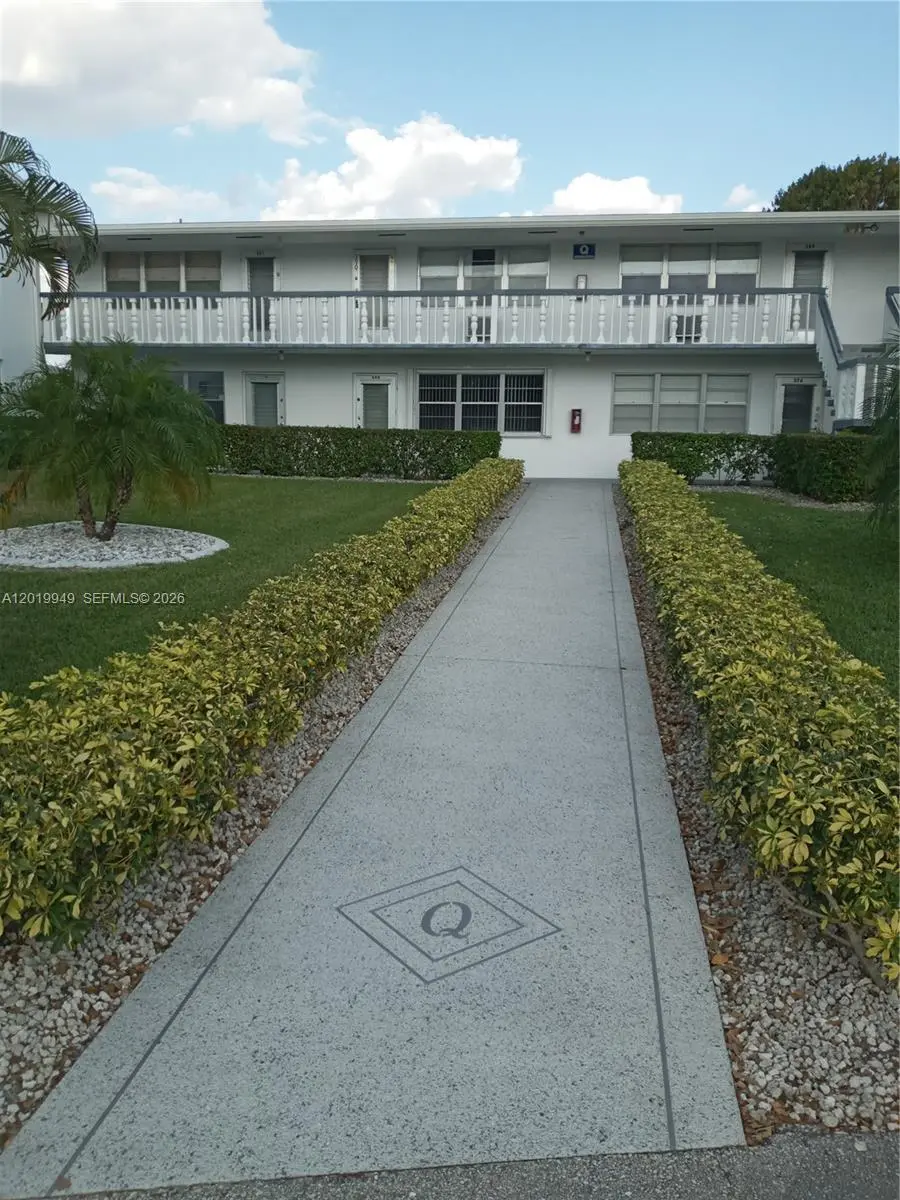
390 Windsor Q #390 · Plantation Mobile Home Park, FL
Flood risk 1/10 · Minimal
- FEMA flood zone
- X (unshaded)
- Chance of flooding over 30 yrs
- 0.0%
- Est. flood insurance / yr
- $507 – $1,088
Fire risk 2/10 · Minimal
- Est. fire insurance / yr
- $947 – $1,759
Heat risk 10/10 · Severe
- Hot days now (above 105°F)
- 7 days/yr
- Hot days in 30 yrs
- 27 days/yr
Wind risk 10/10 · Severe
- Chance of severe wind over 30 yrs
- 99.0%
Air-quality risk 2/10 · Minimal
- Unhealthy air days now
- 1 days/yr
- Unhealthy air days in 30 yrs
- 1 days/yr
Risk factors via First Street. Map © Google.
Why this score? — see what drove the B grade
The composite is a weighted blend of 9 inputs, each scored 0–100. Each bar is that input's sub-score; the figure is the points it added to the 100-point composite (weight × sub-score).
- Cash flow +30.0/30.0
- 1% rule +10.0/10.0
- DSCR +10.0/10.0
- ARV discount +7.5/15.0
- Schools +4.3/10.0
- Livability +3.5/5.0
- Rent growth +2.5/5.0
- Condition / age +2.5/5.0
- Appreciation +0.0/10.0
$69,800
🖨 Deal sheet 📄 Offer letter ✓ Due diligence
Listing remarks
From Okeechobee Blvd, enter the Century Village gate, make 3rd left. Go to end, turn right. Follow around to Windsor Q on Right.
Key facts
- $347 HOA
- Parking
- Built 1972
Property features AI
Finance
- Financial info: Pets are not allowed
- HOA & community: Monthly association fees (multiple stated monthly amounts); Association covers common areas, structure maintenance, parking, recreation facilities and security; Community amenities include clubhouse, fitness center, and transportation service; Senior community
Exterior
- Parking: Assigned parking; Guest parking available; One assigned space
- Security: On-site security guard
- Utilities: Has heating and cooling
- Home design: 2-story building; Property is attached; Entry on second level
- Construction: Block construction; Year built unknown
- Exterior features: Enclosed porch; Porch with screened area; Exterior lighting; Security guard on site
Interior
- Kitchen: Electric range; Microwave; Refrigerator
- Bedrooms: Bedroom located on the main level
- Flooring: Tile
- Bathrooms: 1 full bathroom; 1 half bathroom
- Heating & cooling: Wall furnace heating; Ceiling fans; Wall/window air conditioning units
- Interior features: Bedroom on main level; Second floor entry; Tile flooring
- Laundry & utility: Electric water heater
Neighborhood map
What this means for you Summary
Snapshot
- This is a 1-bed/1.5-bath condo listed at $70k.
Deal economics
- At list price, monthly cash flow is $279 ($3k/yr) — positive.
- The deal already cash-flows at list — no discount required.
- Meets the 1% rule at list price ($1k rent vs $70k).
- Recommended offer: $68k (3.0% below list) — sets the bar for market timing.
Location & tenants
- Location reads 70/100 on livability (#430 in FL) — a middle-class / working-renter tenant base. Strengths: crime A+, cost of living A+, health & safety A+; Watch: schools F, amenities F, commute F.
- Palm Beach (suburban): math 46% / reading 53% proficiency, ranked #34 of 73 in FL (top 47%) — families likely to look elsewhere, expect single-tenant / working-renter base with shorter leases.
- Market conditions: Rents flat; 473 active listings in the ZIP; 40 comparable units currently listed for rent nearby; rentals at typical pace (median 24d on market — plan ~3-4 weeks tenant-placement turnaround); 3,974 units permitted in Palm Beach County in 2024 (1,012 in 5+ unit buildings).
- This rent runs 33% of the median local income ($52k/yr) — at the standard rent-burdened threshold; future hikes will face affordability resistance.
Forward outlook
- Local home prices are declining (-3.0%/yr); year-one equity from $483 of loan paydown is wiped out by about $2k of value loss. Plan a longer hold.
- Palm Beach County population projected at +30% by 2050 — long-run rental-demand tailwind backs the buy-and-hold thesis.
Negotiation context
- It's been on market 34 days — a 3% lower offer ($68k) is reasonable based on typical stale-listing flexibility.
- 5 sale attempts since 7y ago with the ask held roughly flat each time — persistent listings suggest the price (not the market) is what's stuck; bring a comps-based counter.
Risks & watch-outs
- Watch-outs: HOA is 25% of rent.
- Climate carrying-cost: severe wind risk, 99% chance of damaging wind over 30y; extreme-heat days projected 7→27/yr by 2055 (HVAC capex compounding) — expect insurance premiums to compound above CPI over the hold.
Questions for the listing agent
- It's been on market 34 days. Have you received any prior offers? Is the seller open to a 3% concession, seller financing, or rate buy-down credit?
- Built in 1972 — when were the roof, HVAC, electrical panel, plumbing, and water heater last replaced?
- What does the HOA fee cover, when was the last increase, and are there any pending special assessments or reserve-fund shortfalls?
- Any open or pending special assessments — roof, HVAC, plumbing, elevator, façade? What's the per-unit balance and payoff schedule, and is the seller paying it off at close or rolling it to the buyer?
- Is there a deadline driving the sale (1031 exchange, divorce, estate, relocation)? That informs how much negotiation room exists.
- Schools are F-rated, which usually means shorter tenancies and higher turnover. Who's the typical renter profile here, and what's been the actual vacancy rate?
- What's the average days-on-market for RENTAL listings here right now (not sales)? A rising rental-DOM trend means longer vacancies and softer asking-rent achievability than the comps imply.
- What's the recent tenant-quality profile in this submarket — average credit score on applications, eviction rate, late-payment / NSF rate, and stable-employment percentage? A property-management company in the area should have these aggregated.
- How much new apartment / multifamily construction is in the pipeline within 1–3 miles? Heavy new supply (>2% of stock underway) typically softens rents 12–24 months out; light construction supports rent growth.
Investment metrics
- 1% rule
- 2.01% ✓
- Cap rate
- 11.10%
- Cash-on-cash
- 17.15%
- DSCR
- 1.76
- GRM
- 4.1
CMA / ARV
No comps found within radius.
Projected returns pro-forma
-3.0% appreciation · 0.02% rent growth · sell at horizon
- IRR
- 3.7%
- Equity multiple
- 1.13×
- Total profit
- $2,632
- Equity at exit
- $10,407
- IRR
- 8.6%
- Equity multiple
- 1.53×
- Total profit
- $10,359
- Equity at exit
- $6,035
Cash invested: $19,544 (down + closing). Projections, not guarantees.
Landlord ↔ Tenant lean methodology
- Overall (STATE)
- 87 Strongly Landlord-Friendly
- State Florida
- 87 Strongly Landlord-Friendly · R+3
- County
- — inherits STATE
- City
- — inherits STATE
ZIP-level market 33417
- Home prices YoY
- -29.2%
- Rents YoY
- 0.0%
- Active inventory
- 473
- Price-to-rent
- 4.1×
Monthly cashflow live
- Estimated rent
- $1,404 high interval (Pro) →
- Mortgage (P&I)
- −$366
- Tax est. 1.5%
- −$87 /mo · $1,047/yr
- Insurance
- −$29
- HOA
- −$347
- Vacancy / Maint / Mgmt
- −$295
- Net cashflow
- $279
Break-even live
UW: 25.0% down · 7.5% · 30yr · 1.5% tax · 5.0% vac · 8.0% maint · 8.0% mgmt
Financing live
Cash to close
- Down payment
- $17,450
- Closing costs
- $2,094
- Reserves months
- —
- Total cash needed
- —
Loan-product check · same deal, 3 products live
Conventional
25% down · 7.5% · 30yr
- Down + closing
- —
- Monthly P&I
- —
- Monthly cashflow
- —
- DSCR
- —
- Eligible?
- —
Personal DTI + credit; lowest rate.
DSCR
20% down · 8.5% · 30yr
- Down + closing
- —
- Monthly P&I
- —
- Monthly cashflow
- —
- DSCR
- —
- Eligible?
- —
No personal income docs; deal must DSCR.
Hard money
10% down · 12.0% · 12mo
- Down + closing
- —
- Monthly P&I
- —
- Monthly cashflow
- —
- DSCR
- —
- Eligible?
- —
Short-term bridge; refi at stabilization.
Rent comps 40 comps
| Address | Beds | Baths | Sqft | Rent | $/sqft | DOM | Units | Dist |
|---|---|---|---|---|---|---|---|---|
| 364 Camden Dr Unit 364 West Palm Beach, FL | 1.0 | 1.0 | 570 | $1,500 | $2.63 | 24d | 1 | 0.04mi |
| 284 Windsor M Unit M West Palm Beach, FL | 1.0 | 1.0 | 585 | $1,350 | $2.31 | 24d | 1 | 0.06mi |
| 298 Windsor M Unit M West Palm Beach, FL | 1.0 | 1.5 | 702 | $1,250 | $1.78 | 17d | 1 | 0.06mi |
| 298 Windsor M Unit M West Palm Beach, FL | 1.0 | 1.5 | 702 | $1,300 | $1.85 | 24d | 1 | 0.06mi |
| 63 Windsor C Unit C West Palm Beach, FL | 1.0 | 1.5 | 702 | $1,650 | $2.35 | 24d | 1 | 0.07mi |
| 361 Windsor N West Palm Beach, FL | 1.0 | 1.5 | 702 | $1,350 | $1.92 | 24d | 1 | 0.12mi |
| 36 Windsor B West Palm Beach, FL | 1.0 | 1.0 | 585 | $1,200 | $2.05 | 1d | 1 | 0.12mi |
| 36 Windsor B West Palm Beach, FL | 1.0 | 1.0 | 585 | $1,200 | $2.05 | 24d | 1 | 0.12mi |
| 372 Camden P West Palm Beach, FL | 1.0 | 1.0 | 570 | $1,200 | $2.11 | 24d | 1 | 0.14mi |
| 374 Camden P West Palm Beach, FL | 1.0 | 1.0 | 570 | $1,150 | $2.02 | 18d | 1 | 0.14mi |
| 209 Camden I Unit 209 West Palm Beach, FL | 1.0 | 1.5 | 738 | $1,350 | $1.83 | 24d | 1 | 0.15mi |
| 16 Windsor a West Palm Beach, FL | 1.0 | 1.0 | 585 | $1,300 | $2.22 | 5d | 1 | 0.16mi |
| 210 Windsor J Unit J West Palm Beach, FL | 1.0 | 1.0 | 585 | $1,400 | $2.39 | 24d | 1 | 0.16mi |
| 218 Windsor J Unit J West Palm Beach, FL | 1.0 | 1.0 | 585 | $1,275 | $2.18 | 24d | 1 | 0.16mi |
| 157 Camden G West Palm Beach, FL | 1.0 | 1.5 | 646 | $1,350 | $2.09 | 24d | 1 | 0.18mi |
| 226 Windsor J Unit J West Palm Beach, FL | 1.0 | 1.5 | 738 | $1,250 | $1.69 | 24d | 1 | 0.18mi |
| 150 Windsor G West Palm Beach, FL | 1.0 | 1.0 | 585 | $1,500 | $2.56 | 7d | 1 | 0.18mi |
| 179 Berkshire I Unit I West Palm Beach, FL | 1.0 | 1.0 | 585 | $1,225 | $2.09 | 24d | 1 | 0.18mi |
| 172 Camden I West Palm Beach, FL | 1.0 | 1.5 | 646 | $1,400 | $2.17 | 3d | 1 | 0.19mi |
| 220 Berkshire K #220 West Palm Beach, FL | 1.0 | 1.0 | 585 | $1,300 | $2.22 | 20d | 1 | 0.21mi |
| 231 Berkshire K #231 West Palm Beach, FL | 1.0 | 1.0 | 585 | $1,150 | $1.97 | 3d | 1 | 0.22mi |
| 216 Berkshire K Unit K West Palm Beach, FL | 1.0 | 1.0 | 585 | $1,400 | $2.39 | 20d | 1 | 0.23mi |
| 89 Berkshire D #89 West Palm Beach, FL | 1.0 | 1.0 | 585 | $1,150 | $1.97 | 24d | 1 | 0.24mi |
| 89 Berkshire D #89 West Palm Beach, FL | 1.0 | 1.0 | 585 | $1,050 | $1.79 | 7d | 1 | 0.24mi |
| 92 Berkshire Cres Unit 92 West Palm Beach, FL | 1.0 | 1.0 | 615 | $1,350 | $2.20 | 24d | 1 | 0.25mi |
| 3 Berkshire a West Palm Beach, FL | 1.0 | 1.0 | 585 | $1,900 | $3.25 | 24d | 1 | 0.26mi |
| 6386 Emerald Dunes Dr West Palm Beach, FL | 1.0–3.0 | 1.0–2.0 | 1060 | $1,850 | $1.74 | 15d | 2 | 0.34mi |
| 6386 Emerald Dunes Dr West Palm Beach, FL | 1.0–3.0 | 1.0–2.0 | 1060 | $1,850 | $1.74 | 3d | 2 | 0.34mi |
| 325 Andover E West Palm Beach, FL | 1.0 | 1.0 | 532 | $1,450 | $2.73 | 24d | 1 | 0.39mi |
| 235 Northampton L #235 West Palm Beach, FL | 1.0 | 1.0 | 615 | $1,300 | $2.11 | 10d | 1 | 0.40mi |
| 333 Northampton Q Unit 333 West Palm Beach, FL | 1.0 | 1.0 | 570 | $1,300 | $2.28 | 24d | 1 | 0.40mi |
| 326 Andover E West Palm Beach, FL | 1.0 | 1.5 | 684 | $1,490 | $2.18 | 24d | 1 | 0.40mi |
| 243 Northampton M Unit M West Palm Beach, FL | 1.0 | 1.0 | 570 | $1,400 | $2.46 | 7d | 1 | 0.41mi |
| 107 Kent St Unit 107* West Palm Beach, FL | 1.0 | 1.0 | 570 | $1,500 | $2.63 | 24d | 1 | 0.41mi |
| 142 Kent I West Palm Beach, FL | 1.0 | 1.5 | 684 | $1,475 | $2.16 | 24d | 1 | 0.43mi |
| 34 Andover B West Palm Beach, FL | 1.0 | 1.0 | 532 | $1,250 | $2.35 | 7d | 1 | 0.44mi |
| 22 Andover a West Palm Beach, FL | 1.0 | 1.5 | 684 | $1,375 | $2.01 | 24d | 1 | 0.44mi |
| 100 Andover D West Palm Beach, FL | 1.0 | 1.5 | 684 | $1,400 | $2.05 | 24d | 1 | 0.44mi |
| 118 Kent H West Palm Beach, FL | 1.0 | 1.0 | 570 | $1,325 | $2.32 | 24d | 1 | 0.45mi |
| 132 Andover F Unit 132 West Palm Beach, FL | 1.0 | 1.5 | 684 | $1,400 | $2.05 | 24d | 1 | 0.48mi |
HOA detail condo
- Monthly dues
- $347 · $4,164/yr
- Assessments
- None detected in remarks — confirm with the listing agent.
Listing history 32 events
-
2026-06-18days on market $69,800 Active 34 DOM
-
2026-06-17days on market $69,800 Active 33 DOM
-
2026-06-16days on market $69,800 Active 32 DOM
-
2026-06-15days on market $69,800 Active 31 DOM
-
2026-06-13days on market $69,800 Active 29 DOM
-
2026-06-09days on market $69,800 Active 25 DOM
-
2026-06-08days on market $69,800 Active 24 DOM
-
2026-06-07days on market $69,800 Active 23 DOM
-
2026-06-04days on market $69,800 Active 20 DOM
-
2026-06-03days on market $69,800 Active 19 DOM
-
2026-06-02days on market $69,800 Active 18 DOM
-
2026-06-01days on market $69,800 Active 17 DOM
-
2026-05-31days on market $69,800 Active 16 DOM
-
2026-05-15$69,800 Active
-
2026-01-22historical
-
2025-08-13price $79,500
-
2025-01-22$84,500 Active
-
2024-12-20historical
-
2024-07-25price $89,999
-
2024-05-28price $94,999
-
2023-12-21$104,999 Active
-
2023-12-15historical Active Under Contract
-
2023-12-15historical
-
2023-11-15status Pending
-
2023-09-15historical Active Under Contract
-
2023-05-12price $105,000
-
2023-04-17price $110,000
-
2023-03-08$115,000 Active
-
2019-09-23historical
-
2019-08-30price $44,900
-
2019-08-14price $49,900
-
2019-07-31$53,000 Active
ⓘ Source: listings_history table (triggers on properties + properties_extension) + one-shot
backfill from property_details.listing_events for pre-trigger history.
Climate risk First Street
- Flood 1/10 Low FEMA zone X (unshaded) · 0% chance over 30 yrs
- Wildfire 2/10 Low
- Heat 10/10 Extreme 7 d/yr ≥105°F today · 27 d/yr by 30 yrs out
- Wind 10/10 Extreme 99% chance of damaging wind over 30 yrs
- Air quality 2/10 Low 1 unhealthy d/yr today · 1 by 30 yrs out
Nearby sold comps map
Loading sold comps map…
Walkable amenities ~0.75 mi
Loading nearby amenities…
Taxation est. · year 1
- Rental income
- $16,842
- − Mortgage interest
- −$3,910
- − Property taxes
- −$1,047
- − Insurance
- −$349
- − Repairs & maintenance
- −$1,347
- − Management
- −$1,347
- − HOA
- −$4,164
- − Depreciation
- −$2,031
- Taxable income
- $2,647
- Est. tax owed @ 24.0%
- −$635
- After-tax cash flow
- $2,717/yr
For passive investors: Depreciation is non-cash, so a rental often shows a tax loss while cash-flowing — sheltering income. Rental losses are passive: they offset passive income freely, and up to $25,000/yr can offset ordinary (W-2) income if you actively participate and your MAGI is under $100k (phasing out to $0 by $150k); unused losses carry forward. On sale, claimed depreciation is recaptured at up to 25%, and gains may owe capital-gains tax (a 1031 exchange can defer both). Figures are a year-1 estimate at your 24.0% rate — not tax advice; consult a CPA.
Schools (NCES district)
- District
- Palm Beach
- NCES district ID
- 1201500
- Math proficiency
- 46% ▼ -16.00%
- Reading proficiency
- 53% ▼ -4.00%
- Median HH income
- $53,943
- Composite
- 42.72/100
- National rank
- #3160
- State rank
- #34 of 73 in FL
Livability — Plantation Mobile Home Park
- Score
- 70/100
- State rank
- #430
- US rank
- #7700
Category grades
Schools grade is shown separately in the Schools card above.
Census & demographics
- County
- Palm Beach County · 1,438,312 people
- Metro
- Miami-Fort Lauderdale-Pompano Beach, FL
- Population (ZIP)
- 38,079
- Household income
- $51,605
- Rent vs Own
- Severe rent burden
- 2548.0
Population outlook (Palm Beach County) Hauer SSP2
- Today (2025)
- 1,637,487 people
- By 2030
- 1,743,255 · +6.5%
- By 2040
- 1,948,712 · +19.0%
- By 2050
- 2,132,979 · +30.3%
- By 2075
- 2,530,027 · +54.5%
- By 2100
- 2,706,979 · +65.3%
Race, ethnicity, and origin ACS 2023
- Neighborhood character
- Highly diverse neighborhood (Simpson 0.72)
- Race & ethnicity
- White 34% Black 30% Hispanic / Latino 27% Two or more races 16% Asian 3%
- Hispanic origin (detail)
- Mexican 3% Puerto Rican 6% Cuban 5% Dominican 2%
- Common ancestry
- Hispanic 10% Romanian 3% Scotch-Irish 1%
- Foreign-born
- 34% · Canada, Jamaica
- Languages at home
- 58% English-only · Spanish 24% French/Haitian/Cajun 11% Other Indo-European 3%
Political lean MEDSL · Palm Beach
- 2024 margin
- Toss-up / Even · D 50.0% · R 49.2%
- 2008→2024 swing
- -22.1pp toward R · 2008: 22.9pp · 2024: 0.8pp
- All cycles
- 2024: D+0.8 2020: D+12.8 2016: D+15.3 2012: D+17.0 2008: D+22.9
Not yet ingested
- Civics
- —
Market trends
- HPI YoY
- ▼ -138.62%
- Current HPI
- 335.8396
- Rent YoY
- ▬ 0.02%
- Metro
- Miami-Fort Lauderdale-Pompano Beach, FL
- State GDP YoY
- ▲ 3.28%
- F500 in state
- 36
Industry mix (Fortune 500 HQ in FL)
| Industry | F500 HQs | Revenue |
|---|---|---|
| Industrial Technology | 2 | $29B |
|
||
| Insurance | 2 | $17B |
|
||
| Retail | 1 | $60B |
|
||
| Technology Distribution | 1 | $58B |
|
||
| Homebuilding | 1 | $35B |
|
||
| Technology Manufacturing | 1 | $35B |
|
||
Price history
+31.7% since first listed19 events — show timeline
- 2026-05-15 Listed $69,800 MARMLS
- 2026-01-22 Listing Removed — MARMLS
- 2025-08-13 Price Changed $79,500 MARMLS
- 2025-01-22 Listed $84,500 MARMLS
- 2024-12-20 Listing Removed — MARMLS
- 2024-07-25 Price Changed $89,999 MARMLS
- 2024-05-28 Price Changed $94,999 MARMLS
- 2023-12-21 Listed $104,999 MARMLS
- 2023-12-15 Contingent — MARMLS
- 2023-12-15 Listing Removed — MARMLS
- 2023-11-15 Pending — MARMLS
- 2023-09-15 Contingent — MARMLS
- 2023-05-12 Price Changed $105,000 MARMLS
- 2023-04-17 Price Changed $110,000 MARMLS
- 2023-03-08 Listed $115,000 MARMLS
- 2019-09-23 Listing Removed — MARMLS
- 2019-08-30 Price Changed $44,900 MARMLS
- 2019-08-14 Price Changed $49,900 MARMLS
- 2019-07-31 Listed $53,000 MARMLS
Cash-flow waterfall
monthlySold comps — $/sqft
last 12 mo · ≤1 miLoading sold comps…