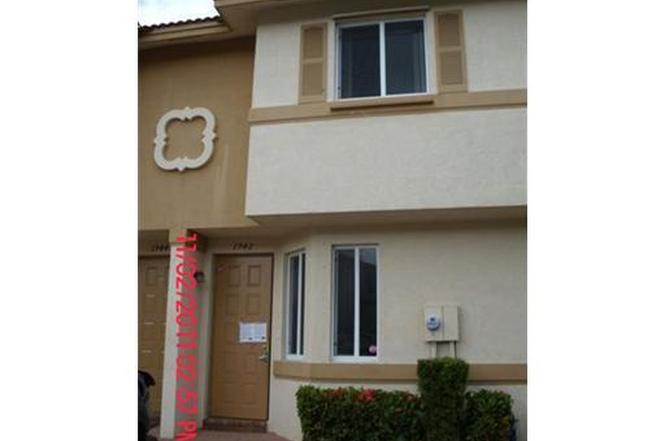
1942 Alamanda Way · Riviera Beach, FL
Flood risk 1/10 · Minimal
- FEMA flood zone
- X (unshaded)
- Chance of flooding over 30 yrs
- 0.0%
- Est. flood insurance / yr
- $507 – $1,088
Fire risk 1/10 · Minimal
- Est. fire insurance / yr
- $947 – $1,759
Heat risk 10/10 · Severe
- Hot days now (above 106°F)
- 7 days/yr
- Hot days in 30 yrs
- 24 days/yr
Wind risk 10/10 · Severe
- Chance of severe wind over 30 yrs
- 99.0%
Air-quality risk 2/10 · Minimal
- Unhealthy air days now
- 0 days/yr
- Unhealthy air days in 30 yrs
- 1 days/yr
Risk factors via First Street. Map © Google.
Why this score? — see what drove the C grade
The composite is a weighted blend of 9 inputs, each scored 0–100. Each bar is that input's sub-score; the figure is the points it added to the 100-point composite (weight × sub-score).
- Cash flow +21.0/30.0
- 1% rule +8.1/10.0
- ARV discount +7.5/15.0
- DSCR +6.7/10.0
- Schools +4.3/10.0
- Livability +3.4/5.0
- Condition / age +2.5/5.0
- Rent growth +2.3/5.0
- Appreciation +0.0/10.0
$235,000
🖨 Deal sheet 📄 Offer letter ✓ Due diligence
Listing remarks MLS
Great opportunity to own this beautiful 2/2 townhome, lots of natural light, gated community with fun amenities! Investor offers considered after 15 days on market. Pls see all attachments. Purchase for only 3% down w/Homepath Renovation!
Key facts
- Fitness center
- Clubhouse
- Swimming pool
Tags
Property features AI
Finance
- Financial info: Pets allowed conditionally; restrictions may apply
- HOA & community: Monthly association fee; Association fee includes common areas and pool(s); Community clubhouse and pool
Exterior
- Security: Security guard
- Home design: 2-story property; Entry on level 1; Property attached
- Construction: Block construction; Resale
- Exterior features: Patio; Association pool
Interior
- Kitchen: Electric range; Microwave; Refrigerator
- Bedrooms: Bedroom on main level
- Flooring: Carpet; Ceramic tile
- Bathrooms: 2 full bathrooms; 1 half bathroom
- Heating & cooling: Central heating; Central air conditioning
- Interior features: Unfurnished; Split bedrooms; Bedroom on main level
Neighborhood map
What this means for you Summary
Snapshot
- This is a 2-bed/2.5-bath townhouse listed at $235k.
Deal economics
- At list price, monthly cash flow is $332 ($4k/yr) — positive.
- The deal already cash-flows at list — no discount required.
- Meets the 1% rule at list price ($3k rent vs $235k).
- Recommended offer: $207k (12.0% below list) — sets the bar for market timing.
Location & tenants
- Location reads 67/100 on livability (#581 in FL) — a middle-class / working-renter tenant base. Strengths: housing A+, health & safety A+, cost of living A-; Watch: employment D, crime F, amenities F.
- Palm Beach (suburban): math 46% / reading 53% proficiency, ranked #34 of 73 in FL (top 47%) — families likely to look elsewhere, expect single-tenant / working-renter base with shorter leases.
- Market conditions: Rents soft (-0.7%/yr); 506 active listings in the ZIP; 8 comparable units currently listed for rent nearby; rentals at typical pace (median 25d on market — plan ~3-4 weeks tenant-placement turnaround); 3,974 units permitted in Palm Beach County in 2024 (1,012 in 5+ unit buildings).
- At $3,089/mo this rent would consume 57% of the median local household income ($65k/yr) (locally 1838% of renters already pay >50% of income on rent) — very limited rent-growth headroom before tenants either downsize or default.
Forward outlook
- Local home prices are declining (-3.0%/yr); year-one equity from $2k of loan paydown is wiped out by about $7k of value loss. Plan a longer hold.
- Palm Beach County population projected at +30% by 2050 — long-run rental-demand tailwind backs the buy-and-hold thesis.
Negotiation context
- It's been on market 151 days — a 12% lower offer ($207k) is reasonable based on typical stale-listing flexibility.
- 4 sale attempts since 16y ago with the ask held roughly flat each time — persistent listings suggest the price (not the market) is what's stuck; bring a comps-based counter.
- Current owner paid $46k; list at $235k implies a 411% gain — meaningful room to come down on a strong offer.
Risks & watch-outs
- Climate carrying-cost: severe wind risk, 99% chance of damaging wind over 30y; extreme-heat days projected 7→24/yr by 2055 (HVAC capex compounding) — expect insurance premiums to compound above CPI over the hold.
Questions for the listing agent
- It's been on market 151 days. Have you received any prior offers? Is the seller open to a 12% concession, seller financing, or rate buy-down credit?
- What does the HOA fee cover, when was the last increase, and are there any pending special assessments or reserve-fund shortfalls?
- Why hasn't it sold? Are there any deal-killer items the seller is aware of (foundation, flood, title, zoning, code violations)?
- Is there a deadline driving the sale (1031 exchange, divorce, estate, relocation)? That informs how much negotiation room exists.
- Crime grade is F in this area — have there been break-ins, vandalism, or insurance claims at this property in the last 3 years? What carrier currently insures it and at what premium?
- What's the average days-on-market for RENTAL listings here right now (not sales)? A rising rental-DOM trend means longer vacancies and softer asking-rent achievability than the comps imply.
- What's the recent tenant-quality profile in this submarket — average credit score on applications, eviction rate, late-payment / NSF rate, and stable-employment percentage? A property-management company in the area should have these aggregated.
- How much new for-sale + rental construction is in the pipeline within 1–3 miles? Heavy new supply typically softens prices + rents 12–24 months out; constrained supply supports both.
Investment metrics
- 1% rule
- 1.31% ✓
- Cap rate
- 7.99%
- Cash-on-cash
- 6.06%
- DSCR
- 1.27
- GRM
- 6.3
CMA / ARV
No comps found within radius.
Projected returns pro-forma
-3.0% appreciation · 0.0% rent growth · sell at horizon
- IRR
- -11.1%
- Equity multiple
- 0.61×
- Total profit
- $-25,636
- Equity at exit
- $35,039
- IRR
- -8.4%
- Equity multiple
- 0.56×
- Total profit
- $-28,673
- Equity at exit
- $20,319
Cash invested: $65,800 (down + closing). Projections, not guarantees.
Landlord ↔ Tenant lean methodology
- Overall (STATE)
- 87 Strongly Landlord-Friendly
- State Florida
- 87 Strongly Landlord-Friendly · R+3
- County
- — inherits STATE
- City
- — inherits STATE
ZIP-level market 33404
- Home prices YoY
- -31.1%
- Rents YoY
- -0.7%
- Active inventory
- 506
- Price-to-rent
- 6.3×
Monthly cashflow live
- Estimated rent
- $3,089 high interval (Pro) →
- Mortgage (P&I)
- −$1,232
- Tax from tax record
- −$326 /mo · $3,911/yr
- Insurance
- −$98
- HOA
- −$452
- Vacancy / Maint / Mgmt
- −$649
- Net cashflow
- $332
Break-even live
UW: 25.0% down · 7.5% · 30yr · 1.5% tax · 5.0% vac · 8.0% maint · 8.0% mgmt
Financing live
Cash to close
- Down payment
- $58,750
- Closing costs
- $7,050
- Reserves months
- —
- Total cash needed
- —
Loan-product check · same deal, 3 products live
Conventional
25% down · 7.5% · 30yr
- Down + closing
- —
- Monthly P&I
- —
- Monthly cashflow
- —
- DSCR
- —
- Eligible?
- —
Personal DTI + credit; lowest rate.
DSCR
20% down · 8.5% · 30yr
- Down + closing
- —
- Monthly P&I
- —
- Monthly cashflow
- —
- DSCR
- —
- Eligible?
- —
No personal income docs; deal must DSCR.
Hard money
10% down · 12.0% · 12mo
- Down + closing
- —
- Monthly P&I
- —
- Monthly cashflow
- —
- DSCR
- —
- Eligible?
- —
Short-term bridge; refi at stabilization.
Rent comps 8 comps
| Address | Beds | Baths | Sqft | Rent | $/sqft | DOM | Units | Dist |
|---|---|---|---|---|---|---|---|---|
| 855 Date Palm Dr West Palm Beach, FL | 3.0 | 3.0 | 1216 | $3,150 | $2.59 | 24d | 1 | 0.87mi |
| 8731 Uranus Ter West Palm Beach, FL | 2.0 | 1.0 | 900 | $3,200 | $3.56 | 24d | 1 | 0.94mi |
| 321 Sandtree Dr Palm Beach Gardens, FL | 3.0 | 2.5 | 1480 | $3,000 | $2.03 | 11d | 1 | 1.01mi |
| 321 Sandtree Dr Palm Beach Gardens, FL | 3.0 | 2.5 | 1480 | $3,000 | $2.03 | 24d | 1 | 1.01mi |
| 901 W 37th St Riviera Beach, FL | 3.0 | 1.0 | 900 | $2,895 | $3.22 | 24d | 1 | 1.01mi |
| 2545 Conroy Dr West Palm Beach, FL | 3.0 | 2.0 | 1066 | $3,295 | $3.09 | 24d | 1 | 1.40mi |
| 520 W 28th St Riviera Beach, FL | 3.0 | 1.0 | 1296 | $6,000 | $4.63 | 3d | 1 | 1.43mi |
| 4289 S Mary Cir Palm Beach Gardens, FL | 2.0 | 2.0 | 1246 | $2,850 | $2.29 | 24d | 1 | 1.47mi |
HOA detail
- Monthly dues
- $452 · $5,424/yr
- Likely covers
- security
Listing history 13 events
-
2026-06-07days on market $235,000 Active 151 DOM
-
2026-06-04days on market $235,000 Active 148 DOM
-
2026-06-03days on market $235,000 Active 147 DOM
-
2026-06-01days on market $235,000 Active 145 DOM
-
2026-05-31days on market $235,000 Active 144 DOM
-
2026-01-05$235,000 Active
-
2012-08-17historical
-
2011-12-16soldstatus $46,000 238-char remark
Show marketing remark (238 chars)
Great opportunity to own this beautiful 2/2 townhome, lots of natural light, gated community with fun amenities! Investor offers considered after 15 days on market. Pls see all attachments. Purchase for only 3% down w/Homepath Renovation!
-
2011-12-12historical 238-char remark
Show marketing remark (238 chars)
Great opportunity to own this beautiful 2/2 townhome, lots of natural light, gated community with fun amenities! Investor offers considered after 15 days on market. Pls see all attachments. Purchase for only 3% down w/Homepath Renovation!
-
2011-11-14$42,500 238-char remark
Show marketing remark (238 chars)
Great opportunity to own this beautiful 2/2 townhome, lots of natural light, gated community with fun amenities! Investor offers considered after 15 days on market. Pls see all attachments. Purchase for only 3% down w/Homepath Renovation!
-
2011-03-22$22,000
-
2010-12-31historical
-
2010-03-02$40,000
ⓘ Source: listings_history table (triggers on properties + properties_extension) + one-shot
backfill from property_details.listing_events for pre-trigger history.
Tax reassessment forecast FL · Resets to sale price
- Current annual tax
- $3,911 · $326/mo
- Projected year-2 tax
- $3,911 · $326/mo
- Expected delta
- $0/yr ($0/mo · 0.0%)
ⓘ Screening estimate from a state-policy table — verify with the county assessor before closing.
Climate risk First Street
- Flood 1/10 Low FEMA zone X (unshaded) · 0% chance over 30 yrs
- Wildfire 1/10 Low
- Heat 10/10 Extreme 7 d/yr ≥106°F today · 24 d/yr by 30 yrs out
- Wind 10/10 Extreme 99% chance of damaging wind over 30 yrs
- Air quality 2/10 Low 0 unhealthy d/yr today · 1 by 30 yrs out
Nearby sold comps map
Loading sold comps map…
Walkable amenities ~0.75 mi
Loading nearby amenities…
Taxation est. · year 1
- Rental income
- $37,069
- − Mortgage interest
- −$13,164
- − Property taxes
- −$3,911
- − Insurance
- −$1,175
- − Repairs & maintenance
- −$2,965
- − Management
- −$2,965
- − HOA
- −$5,424
- − Depreciation
- −$6,836
- Taxable income
- $627
- Est. tax owed @ 24.0%
- −$151
- After-tax cash flow
- $3,835/yr
For passive investors: Depreciation is non-cash, so a rental often shows a tax loss while cash-flowing — sheltering income. Rental losses are passive: they offset passive income freely, and up to $25,000/yr can offset ordinary (W-2) income if you actively participate and your MAGI is under $100k (phasing out to $0 by $150k); unused losses carry forward. On sale, claimed depreciation is recaptured at up to 25%, and gains may owe capital-gains tax (a 1031 exchange can defer both). Figures are a year-1 estimate at your 24.0% rate — not tax advice; consult a CPA.
Schools (NCES district)
- District
- Palm Beach
- NCES district ID
- 1201500
- Math proficiency
- 46% ▼ -16.00%
- Reading proficiency
- 53% ▼ -4.00%
- Median HH income
- $53,943
- Composite
- 42.72/100
- National rank
- #3160
- State rank
- #34 of 73 in FL
Livability — Riviera Beach
- Score
- 67/100
- State rank
- #581
- US rank
- #11060
Category grades
Schools grade is shown separately in the Schools card above.
Census & demographics
- Census place
- Riviera Beach, FL
- County
- Palm Beach County · 1,438,312 people
- City population
- 30,912
- Metro
- Miami-Fort Lauderdale-Pompano Beach, FL
- Population (ZIP)
- 30,912
- Household income
- $65,063
- Rent vs Own
- Severe rent burden
- 1838.0
Population outlook (Palm Beach County) Hauer SSP2
- Today (2025)
- 1,637,487 people
- By 2030
- 1,743,255 · +6.5%
- By 2040
- 1,948,712 · +19.0%
- By 2050
- 2,132,979 · +30.3%
- By 2075
- 2,530,027 · +54.5%
- By 2100
- 2,706,979 · +65.3%
Race, ethnicity, and origin ACS 2023
- Neighborhood character
- Majority Black (64%)
- Race & ethnicity
- Black 64% White 22% Hispanic / Latino 9% Two or more races 8%
- Hispanic origin (detail)
- Mexican 1% Puerto Rican 1%
- Common ancestry
- Hispanic 8% Romanian 1% Italian 1%
- Foreign-born
- 21% · Canada, Jamaica
- Languages at home
- 82% English-only · Spanish 8% French/Haitian/Cajun 7% Other Indo-European 1%
Political lean MEDSL · Palm Beach
- 2024 margin
- Toss-up / Even · D 50.0% · R 49.2%
- 2008→2024 swing
- -22.1pp toward R · 2008: 22.9pp · 2024: 0.8pp
- All cycles
- 2024: D+0.8 2020: D+12.8 2016: D+15.3 2012: D+17.0 2008: D+22.9
Not yet ingested
- Civics
- —
Market trends
- HPI YoY
- ▼ -153.74%
- Current HPI
- 341.1761
- Rent YoY
- ▼ -0.72%
- Metro
- Miami-Fort Lauderdale-Pompano Beach, FL
- State GDP YoY
- ▲ 3.28%
- F500 in state
- 36
Industry mix (Fortune 500 HQ in FL)
| Industry | F500 HQs | Revenue |
|---|---|---|
| Industrial Technology | 2 | $29B |
|
||
| Insurance | 2 | $17B |
|
||
| Retail | 1 | $60B |
|
||
| Technology Distribution | 1 | $58B |
|
||
| Homebuilding | 1 | $35B |
|
||
| Technology Manufacturing | 1 | $35B |
|
||
Price history
+487.5% since first listed8 events — show timeline
- 2026-01-05 Listed $235,000 MARMLS
- 2012-08-17 Listing Removed — Beaches MLS
- 2011-12-16 Sold (MLS) $46,000 Beaches MLS
- 2011-12-12 Listing Removed — Beaches MLS
- 2011-11-14 Listed $42,500 Beaches MLS
- 2011-03-22 Listed $22,000 Beaches MLS
- 2010-12-31 Listing Removed — Stellar MLS as Distributed by MLS Grid
- 2010-03-02 Listed $40,000 Stellar MLS as Distributed by MLS Grid
Property tax history
+6.8%/yrLatest (2025): $3,911 · +4.3% YoY. Source: county tax records.
Cash-flow waterfall
monthlySold comps — $/sqft
last 12 mo · ≤1 miLoading sold comps…