 Multi-family
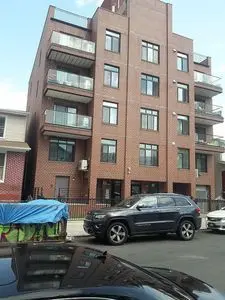
3031 Brighton 5th St · New York, NY
Flood risk 7/10 · Major
- FEMA flood zone
- X (shaded)
- Chance of flooding over 30 yrs
- 0.74%
- Est. flood insurance / yr
- $507 – $1,088
Fire risk 1/10 · Minimal
- Est. fire insurance / yr
- $691 – $1,283
Heat risk 7/10 · Major
- Hot days now (above 97°F)
- 7 days/yr
- Hot days in 30 yrs
- 16 days/yr
Wind risk 6/10 · Moderate
- Chance of severe wind over 30 yrs
- 72.0%
Air-quality risk 4/10 · Minor
- Unhealthy air days now
- 5 days/yr
- Unhealthy air days in 30 yrs
- 7 days/yr
Risk factors via First Street. Map © Google.
Why this score? — see what drove the B grade
The composite is a weighted blend of 9 inputs, each scored 0–100. Each bar is that input's sub-score; the figure is the points it added to the 100-point composite (weight × sub-score).
- Cash flow +30.0/30.0
- 1% rule +10.0/10.0
- DSCR +10.0/10.0
- ARV discount +7.5/15.0
- Schools +5.0/10.0
- Rent growth +3.8/5.0
- Livability +3.8/5.0
- Condition / age +2.5/5.0
- Appreciation +0.0/10.0
$459,000
🖨 Deal sheet 📄 Offer letter ✓ Due diligence
Multi-family units
County records classify this as Multi-Family (5+ Unit). Listing-text estimate: 1 unit. estimate disagrees with records
5+ unit building — per-unit beds/baths from public records are typically unavailable; the breakdown below (if shown) is an estimate from the listing text.
Listing remarks
New condo with more than 10y tax abatement. Near B, Q train station and B68, B1 stop, many food stores, restaurants and cafe& apos; s, boardwalk with Amusement park nearby. Parking available for additional price. Apartment located on second floor without balcony.
Key facts
- Amusement park
- Parking available
- B q train station
Tags
Property features AI
Exterior
- Home design: Built in 2016
- Construction: Living area of 498
- Exterior features: Located in the Brighton Beach subdivision
Neighborhood map
What this means for you Summary
Snapshot
- This is a 1-bed/1.0-bath multifamily listed at $459k.
Deal economics
- At list price, monthly cash flow is $5k ($57k/yr) — positive.
- The deal already cash-flows at list — no discount required.
- Meets the 1% rule at list price ($10k rent vs $459k).
- Recommended offer: $445k (3.0% below list) — sets the bar for market timing.
- Cap rate 18.9% vs local median 2.6% in New York — top-decile yield for the area; either an underpriced asset or a hidden risk that comps aren't pricing in. Stress-test before assuming the spread holds.
Location & tenants
- Location reads 75/100 on livability (#268 in NY, #4,188 nationally) — a middle-class / working-renter tenant base. Strengths: amenities A+, commute A+, health & safety A; Watch: crime F, cost of living F.
- Market conditions: Rents rising fast (+5.0%/yr); 521 active listings in the ZIP; 10,063 units permitted in Kings County in 2024 (9,789 in 5+ unit buildings).
- At $10,123/mo this rent would consume 204% of the median local household income ($60k/yr) (locally 7823% of renters already pay >50% of income on rent) — very limited rent-growth headroom before tenants either downsize or default.
Forward outlook
- Local home prices are declining (-3.0%/yr); year-one equity from $3k of loan paydown is wiped out by about $14k of value loss. Plan a longer hold.
- Kings County population projected at +13% by 2050 — modest demand growth; plan on rents tracking national, not racing it.
- At projected returns (-3.0% appreciation + 5.0% rent growth), your $129k cash investment doubles in ~3 years — after that, you're playing with house money.
Negotiation context
- It's been on market 35 days — a 3% lower offer ($445k) is reasonable based on typical stale-listing flexibility.
- 2 sale attempts since 2y ago with the ask held roughly flat each time — persistent listings suggest the price (not the market) is what's stuck; bring a comps-based counter.
Risks & watch-outs
- Watch-outs: flood insurance adds $66/mo.
- Climate carrying-cost: major flood risk; major wind risk, 72% chance of damaging wind over 30y; extreme-heat days projected 7→16/yr by 2055 (HVAC capex compounding) — expect insurance premiums to compound above CPI over the hold.
Questions for the listing agent
- It's been on market 35 days. Have you received any prior offers? Is the seller open to a 3% concession, seller financing, or rate buy-down credit?
- What's the actual annual flood-insurance premium (NFIP or private), and is the property in a SFHA with mandatory coverage?
- Is there a deadline driving the sale (1031 exchange, divorce, estate, relocation)? That informs how much negotiation room exists.
- Schools are B-rated — typically a magnet for longer-tenancy family renters. What's the average tenant stay here, and is there a school-zone premium baked into asking?
- Crime grade is F in this area — have there been break-ins, vandalism, or insurance claims at this property in the last 3 years? What carrier currently insures it and at what premium?
- What's the average days-on-market for RENTAL listings here right now (not sales)? A rising rental-DOM trend means longer vacancies and softer asking-rent achievability than the comps imply.
- What's the recent tenant-quality profile in this submarket — average credit score on applications, eviction rate, late-payment / NSF rate, and stable-employment percentage? A property-management company in the area should have these aggregated.
- How much new apartment / multifamily construction is in the pipeline within 1–3 miles? Heavy new supply (>2% of stock underway) typically softens rents 12–24 months out; light construction supports rent growth.
Investment metrics
- 1% rule
- 2.21% ✓
- Cap rate
- 18.91%
- Cash-on-cash
- 45.05%
- DSCR
- 3.00
- GRM
- 3.8
CMA / ARV
No comps found within radius.
Projected returns pro-forma
-3.0% appreciation · 5.04% rent growth · sell at horizon
- IRR
- 43.8%
- Equity multiple
- 2.95×
- Total profit
- $250,098
- Equity at exit
- $68,438
- IRR
- 50.7%
- Equity multiple
- 6.44×
- Total profit
- $699,537
- Equity at exit
- $39,686
Cash invested: $128,520 (down + closing). Projections, not guarantees.
Landlord ↔ Tenant lean methodology
- Overall (CITY)
- 0 Strongly Tenant-Friendly
- State New York
- 15 Strongly Tenant-Friendly · D+10
- County
- — inherits STATE
- City New York
- 0 Strongly Tenant-Friendly · D+34
ZIP-level market 11235
- Rents YoY
- 5.0%
- Active inventory
- 521
- Price-to-rent
- 15.1×
Monthly cashflow live
- Estimated rent
- $10,123 medium interval (Pro) →
- Mortgage (P&I)
- −$2,407
- Tax est. 1.5%
- −$574 /mo · $6,885/yr
- Insurance
- −$191
- Flood insurance flood zone
- −$66 /mo · $798/yr
- HOA
- −$0
- Vacancy / Maint / Mgmt
- −$2,126
- Net cashflow
- $4,759
Break-even live
4-unit breakdown (identical units grouped — click to expand)
| Units | Beds | Baths | Est. rent |
|---|---|---|---|
| 4× units | 1 | 1 | $10,124 |
| #1 | 1 | 1 | $2,531 |
| #2 | 1 | 1 | $2,531 |
| #3 | 1 | 1 | $2,531 |
| #4 | 1 | 1 | $2,531 |
| Total (4 units) | $10,123 | ||
UW: 25.0% down · 7.5% · 30yr · 1.5% tax · 5.0% vac · 8.0% maint · 8.0% mgmt
Financing live
Cash to close
- Down payment
- $114,750
- Closing costs
- $13,770
- Reserves months
- —
- Total cash needed
- —
Loan-product check · same deal, 3 products live
Conventional
25% down · 7.5% · 30yr
- Down + closing
- —
- Monthly P&I
- —
- Monthly cashflow
- —
- DSCR
- —
- Eligible?
- —
Personal DTI + credit; lowest rate.
DSCR
20% down · 8.5% · 30yr
- Down + closing
- —
- Monthly P&I
- —
- Monthly cashflow
- —
- DSCR
- —
- Eligible?
- —
No personal income docs; deal must DSCR.
Hard money
10% down · 12.0% · 12mo
- Down + closing
- —
- Monthly P&I
- —
- Monthly cashflow
- —
- DSCR
- —
- Eligible?
- —
Short-term bridge; refi at stabilization.
Listing history 13 events
-
2026-06-18days on market $459,000 Active 35 DOM
-
2026-06-17days on market $459,000 Active 34 DOM
-
2026-06-15days on market $459,000 Active 32 DOM
-
2026-06-13days on market $459,000 Active 30 DOM
-
2026-06-10days on market $459,000 Active 26 DOM
-
2026-06-08days on market $459,000 Active 25 DOM
-
2026-06-03days on market $459,000 Active 20 DOM
-
2026-06-01days on market $459,000 Active 18 DOM
-
2026-05-31days on market $459,000 Active 17 DOM
-
2026-05-14$459,000 Active
-
2024-07-15historical $2,750
-
2024-05-09$2,750
-
2014-05-15soldstatus $1,200,000
ⓘ Source: listings_history table (triggers on properties + properties_extension) + one-shot
backfill from property_details.listing_events for pre-trigger history.
Climate risk First Street
- Flood 7/10 Severe FEMA zone X (shaded) · 74% chance over 30 yrs
- Wildfire 1/10 Low
- Heat 7/10 Severe 7 d/yr ≥97°F today · 16 d/yr by 30 yrs out
- Wind 6/10 Major 72% chance of damaging wind over 30 yrs
- Air quality 4/10 Moderate 5 unhealthy d/yr today · 7 by 30 yrs out
Nearby sold comps map
Loading sold comps map…
Walkable amenities ~0.75 mi
Loading nearby amenities…
Taxation est. · year 1
- Rental income
- $121,476
- − Mortgage interest
- −$25,711
- − Property taxes
- −$6,885
- − Insurance
- −$3,092
- − Repairs & maintenance
- −$9,718
- − Management
- −$9,718
- − Depreciation
- −$13,353
- Taxable income
- $52,998
- Est. tax owed @ 24.0%
- −$12,720
- After-tax cash flow
- $44,384/yr
For passive investors: Depreciation is non-cash, so a rental often shows a tax loss while cash-flowing — sheltering income. Rental losses are passive: they offset passive income freely, and up to $25,000/yr can offset ordinary (W-2) income if you actively participate and your MAGI is under $100k (phasing out to $0 by $150k); unused losses carry forward. On sale, claimed depreciation is recaptured at up to 25%, and gains may owe capital-gains tax (a 1031 exchange can defer both). Figures are a year-1 estimate at your 24.0% rate — not tax advice; consult a CPA.
Schools (NCES district)
No district data.
Livability — New York
- Score
- 75/100
- State rank
- #268
- US rank
- #4188
Category grades
Schools grade is shown separately in the Schools card above.
Census & demographics
- Census place
- New York, NY
- County
- Kings County · 2,614,986 people
- City population
- 7,731,280
- Metro
- New York-Newark-Jersey City, NY-NJ-PA
- Population (ZIP)
- 78,558
- Household income
- $59,661
- Rent vs Own
- Severe rent burden
- 7823.0
Population outlook (Kings County) Hauer SSP2
- Today (2025)
- 2,847,441 people
- By 2030
- 2,937,006 · +3.1%
- By 2040
- 3,095,491 · +8.7%
- By 2050
- 3,228,968 · +13.4%
- By 2075
- 3,321,723 · +16.7%
- By 2100
- 3,111,387 · +9.3%
Race, ethnicity, and origin ACS 2023
- Neighborhood character
- Predominantly White (67%)
- Race & ethnicity
- White 67% Asian 15% Two or more races 9% Hispanic / Latino 9% Black 3%
- Hispanic origin (detail)
- Mexican 3% Puerto Rican 3%
- Common ancestry
- Scotch-Irish 15% Subsaharan African 12% Romanian 2%
- Foreign-born
- 63% · China, Canada, Vietnam
- Languages at home
- 24% English-only · Russian/Polish/Slavic 48% Chinese 7% Spanish 7%
Political lean MEDSL · Kings
- 2024 margin
- Solid D (+44.0) · D 72.0% · R 28.0%
- 2008→2024 swing
- -15.5pp toward R · 2008: 59.4pp · 2024: 44.0pp
- All cycles
- 2024: D+44.0 2020: D+54.8 2016: D+61.8 2012: D+63.9 2008: D+59.4
Not yet ingested
- Civics
- —
Market trends
- HPI YoY
- ▼ -181.73%
- Current HPI
- 303.6714
- Rent YoY
- ▲ 5.04%
- Metro
- New York-Newark-Jersey City, NY-NJ-PA
- State GDP YoY
- ▲ 2.60%
- F500 in state
- 92
Industry mix (Fortune 500 HQ in NY)
| Industry | F500 HQs | Revenue |
|---|---|---|
| Financial Services | 10 | $950B |
|
||
| Consumer Goods | 9 | $162B |
|
||
| Insurance | 4 | $225B |
|
||
| Telecommunications | 2 | $144B |
|
||
| Pharmaceuticals | 2 | $112B |
|
||
| Media / Entertainment | 2 | $69B |
|
||
Price history
-61.8% since first listed4 events — show timeline
- 2026-05-14 Listed $459,000 FSBO.com
- 2024-07-15 Rental Removed $2,750 ONEKEY
- 2024-05-09 Listed for Rent $2,750 ONEKEY
- 2014-05-15 Sold (Public Records) $1,200,000 Public Records
Property tax history
+29.2%/yrLatest (2022): $128,724 · +7.9% YoY. Source: county tax records.
Cash-flow waterfall
monthlySold comps — $/sqft
last 12 mo · ≤1 miLoading sold comps…