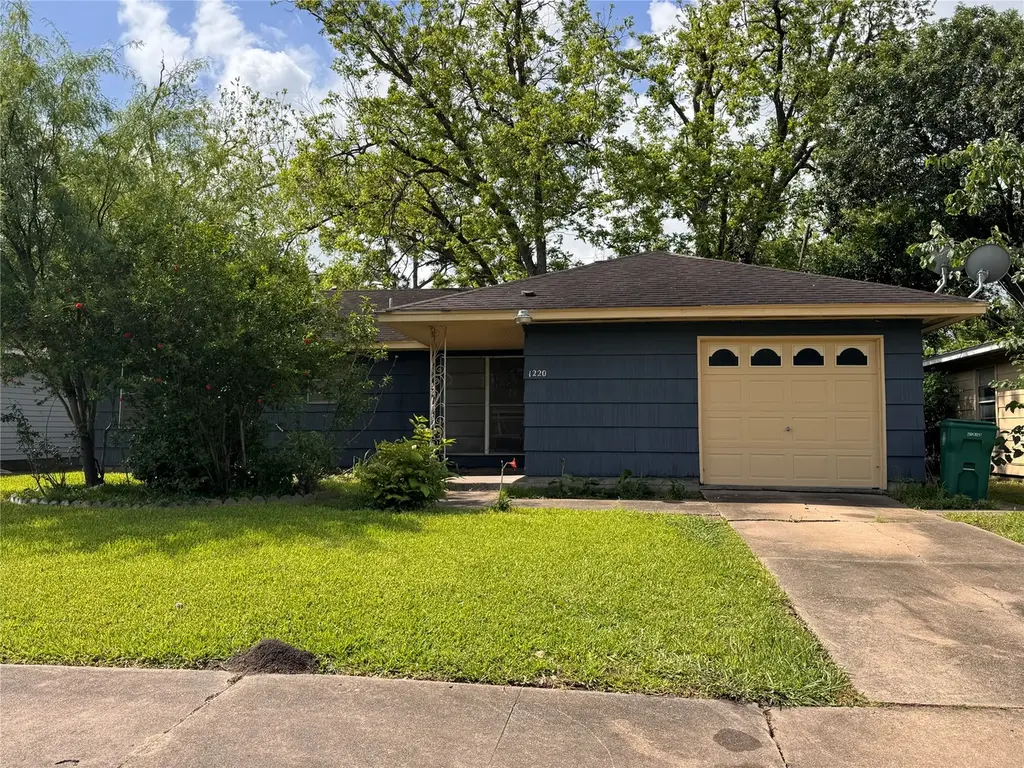
1220 Fresa Rd · Pasadena, TX
Flood risk 1/10 · Minimal
- FEMA flood zone
- X (unshaded)
- Chance of flooding over 30 yrs
- 0.0%
- Est. flood insurance / yr
- $507 – $1,088
Fire risk 1/10 · Minimal
- Est. fire insurance / yr
- $1,222 – $2,270
Heat risk 10/10 · Severe
- Hot days now (above 109°F)
- 7 days/yr
- Hot days in 30 yrs
- 24 days/yr
Wind risk 9/10 · Severe
- Chance of severe wind over 30 yrs
- 99.0%
Air-quality risk 2/10 · Minimal
- Unhealthy air days now
- 2 days/yr
- Unhealthy air days in 30 yrs
- 2 days/yr
Risk factors via First Street. Map © Google.
Why this score? — see what drove the C- grade
The composite is a weighted blend of 9 inputs, each scored 0–100. Each bar is that input's sub-score; the figure is the points it added to the 100-point composite (weight × sub-score).
- ARV discount +15.0/15.0
- Cash flow +14.5/30.0
- 1% rule +5.3/10.0
- DSCR +4.4/10.0
- Livability +3.3/5.0
- Schools +2.6/10.0
- Rent growth +2.5/5.0
- Condition / age +2.5/5.0
- Appreciation +0.0/10.0
$149,990
🖨 Deal sheet 📄 Offer letter ✓ Due diligence
Listing remarks
Welcome to 1220 Fresa Rd, a home full of potential and ready for your personal touch! This charming property offers a fantastic opportunity for buyers looking to create a space that truly feels like home. Major updates have already been taken care of, including a new HVAC system and all-new air ducts replaced in 2025, giving you peace of mind on one of the biggest expenses. With a little vision and some TLC, this home can be transformed into something truly special. Whether you're a first-time buyer wanting to build equity or someone ready to customize every detail to your style, this is your chance to make it your own. Conveniently located in Pasadena with easy access to shopping, dining,
Key facts
- All-new air ducts
- New hvac system
- 6,599 sq ft lot
Tags
Property features AI
Finance
- Other: Living area approximately 1,308; Lot about 0.15 acres (6,600 sq ft)
- Financial info: Lease not considered
- HOA & community: HOA information not provided
Exterior
- Parking: Attached garage; 1-car garage
- Security: No specific security features listed
- Utilities: Public water; Public sewer
- Home design: Residential property; Built in 1957; Slab foundation
- Construction: Wood siding construction
- Exterior features: Subdivision lot; Composition roof
Interior
- Kitchen: Kitchen details not specified
- Bedrooms: Bedrooms not specified
- Flooring: Flooring details not specified
- Bathrooms: 1 full bathroom
- Heating & cooling: Central heating (gas); Central electric air conditioning
- Interior features: 3 total rooms; Seller disclosure available
- Laundry & utility: Laundry details not specified
Neighborhood map
What this means for you Summary
Snapshot
- This is a 3-bed/1.0-bath single-family listed at $150k.
Deal economics
- At list price, monthly cash flow is $32 ($381/yr) — positive.
- The deal already cash-flows at list — no discount required.
- Meets the 1% rule at list price ($2k rent vs $150k).
- Recommended offer: $148k (1.5% below list) — sets the bar for market timing.
- Cap rate 6.5% vs local median 3.4% in Pasadena — top-decile yield for the area; either an underpriced asset or a hidden risk that comps aren't pricing in. Stress-test before assuming the spread holds.
Location & tenants
- Location reads 66/100 on livability (#600 in TX) — a middle-class / working-renter tenant base. Strengths: cost of living A+, housing A+; Watch: employment D+, crime F, amenities F.
- Pasadena ISD (suburban): math 29% / reading 32% proficiency, ranked #612 of 826 in TX (top 74%) — families likely to look elsewhere, expect single-tenant / working-renter base with shorter leases; 71% free/reduced lunch — lower-income household profile, screen leases tightly.
- Zoned schools: Marshall Kendrick Middle (math 24% / reading 26%, grade F, #1,258 of 1,662 statewide, top 77%, 682 students, 89% FRL); Sam Rayburn H S (math 52% / reading 36%, grade F, #697 of 1,632 statewide, top 43%, 2,645 students, 86% FRL) — zoned schools average 88% FRL vs 71% district-wide (16 pts higher); higher-poverty schools than district average — tighter screening recommended.
- Market conditions: 99 active listings in the ZIP; 35 comparable units currently listed for rent nearby; rentals at typical pace (median 16d on market — plan ~3-4 weeks tenant-placement turnaround); 40% of comp listings sitting > 30 days — soft ceiling on asking rent; 29,883 units permitted in Harris County in 2024 (8,621 in 5+ unit buildings).
Forward outlook
- Local home prices are declining (-3.0%/yr); year-one equity from $1k of loan paydown is wiped out by about $4k of value loss. Plan a longer hold.
- Harris County population projected at +47% by 2050 — long-run rental-demand tailwind backs the buy-and-hold thesis.
Negotiation context
- It's been on market 17 days — a 2% lower offer ($148k) is reasonable based on typical stale-listing flexibility.
Risks & watch-outs
- Watch-outs: property tax is 2.7% of price; built in 1957 — expect roof / HVAC / electrical / plumbing capex.
- Climate carrying-cost: severe wind risk, 99% chance of damaging wind over 30y; extreme-heat days projected 7→24/yr by 2055 (HVAC capex compounding) — expect insurance premiums to compound above CPI over the hold.
Questions for the listing agent
- Built in 1957 — when were the roof, HVAC, electrical panel, plumbing, and water heater last replaced?
- Property tax is high relative to price — has the assessment been appealed recently, and will the sale trigger a re-assessment?
- Is there a deadline driving the sale (1031 exchange, divorce, estate, relocation)? That informs how much negotiation room exists.
- Schools are D-rated, which usually means shorter tenancies and higher turnover. Who's the typical renter profile here, and what's been the actual vacancy rate?
- Crime grade is F in this area — have there been break-ins, vandalism, or insurance claims at this property in the last 3 years? What carrier currently insures it and at what premium?
- What's the average days-on-market for RENTAL listings here right now (not sales)? A rising rental-DOM trend means longer vacancies and softer asking-rent achievability than the comps imply.
- What's the recent tenant-quality profile in this submarket — average credit score on applications, eviction rate, late-payment / NSF rate, and stable-employment percentage? A property-management company in the area should have these aggregated.
- How much new for-sale + rental construction is in the pipeline within 1–3 miles? Heavy new supply typically softens prices + rents 12–24 months out; constrained supply supports both.
Investment metrics
- 1% rule
- 1.03% ✓
- Cap rate
- 6.55%
- Cash-on-cash
- 0.91%
- DSCR
- 1.04
- GRM
- 8.1
CMA / ARV
- ARV (median comp)
- $203,372
- List price
- $149,990
- Delta
- -26.25%
- Verdict
- UNDERPRICED
- Comps
- 20 within 1.0 mi
Show comp detail 12 sales within ~0.75 mi
| Address | Dist | Beds/Ba | Sqft | Sold | Price | $/sf | Match |
|---|---|---|---|---|---|---|---|
| 1220 Fresa Rd | 0.00mi | 3/1.0 | 1,308 (0%) | 1mo | $149,990 | $115 | 100 |
| 1311 Gary Ave | 0.22mi | 3/1.0 | 1,247 (-5%) | 4mo | $190,000 | $152 | 79 |
| 2403 Blueberry Ln | 0.37mi | 3/2.0 | 1,332 (+2%) | 5mo | $230,000 | $173 | 71 |
| 2409 Raspberry Ln | 0.31mi | 3/2.0 | 1,384 (+6%) | 4mo | $239,000 | $173 | 68 |
| 2303 Blueberry Ln | 0.38mi | 3/1.5 | 1,405 (+7%) | 5mo | $189,000 | $135 | 64 |
| 2214 View St | 0.70mi | 3/1.0 | 1,328 (+2%) | 3mo | $220,000 | $166 | 62 |
| 2115 Dewberry Ln | 0.51mi | 3/1.0 | 1,211 (-7%) | 2mo | $159,990 | $132 | 62 |
| 612 Alta Vista Dr | 0.49mi | 3/1.5 | 1,392 (+6%) | 4mo | $235,000 | $169 | 61 |
| 2902 Mulberry Ln | 0.46mi | 3/2.0 | 1,398 (+7%) | 4mo | $265,000 | $190 | 60 |
| 2120 Chestnut Ln | 0.74mi | 3/2.0 | 1,409 (+8%) | 1mo | $239,995 | $170 | 48 |
| 2108 Basket St | 0.64mi | 3/2.0 | 1,476 (+13%) | 2mo | $235,000 | $159 | 43 |
| 1912 Monroe Dr | 0.68mi | 3/1.0 | 1,476 (+13%) | 5mo | $199,950 | $135 | 42 |
Match score weights: distance 35% · size 25% · config 20% · recency 20%. Top-matched comps best support the ARV.
Projected returns pro-forma
-3.0% appreciation · 3.0% rent growth · sell at horizon
- IRR
- -14.8%
- Equity multiple
- 0.47×
- Total profit
- $-22,165
- Equity at exit
- $22,364
- IRR
- -6.0%
- Equity multiple
- 0.61×
- Total profit
- $-16,217
- Equity at exit
- $12,968
Cash invested: $41,997 (down + closing). Projections, not guarantees.
Landlord ↔ Tenant lean methodology
- Overall (STATE)
- 87 Strongly Landlord-Friendly
- State Texas
- 87 Strongly Landlord-Friendly · R+5
- County
- — inherits STATE
- City
- — inherits STATE
ZIP-level market 77502
- Home prices YoY
- -14.2%
- Active inventory
- 99
- Price-to-rent
- 8.1×
Monthly cashflow live
- Estimated rent
- $1,549 high interval (Pro) →
- Mortgage (P&I)
- −$787
- Tax from tax record
- −$343 /mo · $4,112/yr
- Insurance
- −$62
- HOA
- −$0
- Vacancy / Maint / Mgmt
- −$325
- Net cashflow
- $32
Break-even live
UW: 25.0% down · 7.5% · 30yr · 1.5% tax · 5.0% vac · 8.0% maint · 8.0% mgmt
Financing live
Cash to close
- Down payment
- $37,498
- Closing costs
- $4,500
- Reserves months
- —
- Total cash needed
- —
Loan-product check · same deal, 3 products live
Conventional
25% down · 7.5% · 30yr
- Down + closing
- —
- Monthly P&I
- —
- Monthly cashflow
- —
- DSCR
- —
- Eligible?
- —
Personal DTI + credit; lowest rate.
DSCR
20% down · 8.5% · 30yr
- Down + closing
- —
- Monthly P&I
- —
- Monthly cashflow
- —
- DSCR
- —
- Eligible?
- —
No personal income docs; deal must DSCR.
Hard money
10% down · 12.0% · 12mo
- Down + closing
- —
- Monthly P&I
- —
- Monthly cashflow
- —
- DSCR
- —
- Eligible?
- —
Short-term bridge; refi at stabilization.
Rent comps 35 comps
| Address | Beds | Baths | Sqft | Rent | $/sqft | DOM | Units | Dist |
|---|---|---|---|---|---|---|---|---|
| 1307 Camden Rd Pasadena, TX | 3.0 | 1.5 | 1170 | $1,585 | $1.35 | 5d | 1 | 0.06mi |
| 1110 Parkside Dr Pasadena, TX | 2.0 | 2.0 | 1120 | $1,167 | $1.04 | 44d | 1 | 0.27mi |
| 2730 Lafferty Rd Pasadena, TX | 1.0–3.0 | 1.0–2.0 | 966 | $1,505 | $1.56 | 44d | 19 | 0.34mi |
| 2730 Lafferty Rd Pasadena, TX | 3.0 | 2.0 | 1377 | $1,505 | $1.09 | 18d | 1 | 0.34mi |
| 2730 Lafferty Rd Pasadena, TX | 1.0–3.0 | 1.0–2.0 | 966 | $1,505 | $1.56 | 15d | 10 | 0.34mi |
| 1006 Valerie Ave Pasadena, TX | 3.0 | 1.5 | 983 | $1,450 | $1.48 | 44d | 1 | 0.46mi |
| 3002 Strawberry Rd Pasadena, TX | 2.0 | 1.0 | 910 | $982 | $1.08 | 13d | 10 | 0.52mi |
| 3101 Spencer Hwy Unit 421 Pasadena, TX | 2.0 | 2.0 | 1050 | $1,205 | $1.15 | 5d | 1 | 0.56mi |
| 3101 Spencer Hwy Unit 2165 Pasadena, TX | 2.0 | 2.0 | 1050 | $1,197 | $1.14 | 3d | 1 | 0.61mi |
| 3101 Spencer Hwy Unit 3158 Pasadena, TX | 2.0 | 2.0 | 1050 | $1,229 | $1.17 | 10d | 1 | 0.61mi |
| 3200 Federal Rd Pasadena, TX | 1.0–3.0 | 1.0–2.0 | 900 | $1,399 | $1.55 | 2d | 7 | 0.73mi |
| 1118 Madison Ave Pasadena, TX | 3.0 | 2.0 | 1653 | $1,700 | $1.03 | 44d | 1 | 0.88mi |
| 2320 Cherry Brook Ln Apt 510 Pasadena, TX | 3.0 | 2.0 | 1209 | $1,167 | $0.97 | 3d | 1 | 0.95mi |
| 403 Garner Rd Pasadena, TX | 2.0 | 1.5 | 910 | $1,130 | $1.24 | 44d | 2 | 0.99mi |
| 1000 Curtis Ave Pasadena, TX | 1.0–2.0 | 1.0–2.0 | 744 | $1,274 | $1.71 | 5d | 14 | 1.00mi |
| 2001 Burke Rd Pasadena, TX | 1.0–3.0 | 1.0–1.5 | 989 | $1,479 | $1.50 | 2d | 6 | 1.03mi |
| 2306 Cherry Brook Ln Pasadena, TX | 2.0 | 1.0 | 882 | $1,076 | $1.22 | 44d | 1 | 1.07mi |
| 112 Allendale Rd Pasadena, TX | 4.0 | 2.0 | 1275 | $1,215 | $0.95 | 22d | 1 | 1.10mi |
| 112 Allendale Rd Pasadena, TX | 4.0 | 2.0 | 1275 | $1,215 | $0.95 | 44d | 1 | 1.10mi |
| 112 Allendale Rd Pasadena, TX | 3.0 | 2.0 | 1175 | $1,085 | $0.92 | 24d | 1 | 1.10mi |
| 1413 George St Pasadena, TX | 3.0 | 1.0 | 998 | $1,695 | $1.70 | 5d | 1 | 1.11mi |
| 211 Knox St Pasadena, TX | 3.0 | 2.0 | 1106 | $1,266 | $1.14 | 44d | 1 | 1.18mi |
| 227 Knox St Pasadena, TX | 3.0 | 2.0 | 1111 | $1,310 | $1.18 | 44d | 1 | 1.18mi |
| 201 Vista Rd Pasadena, TX | 1.0–2.0 | 1.0–1.5 | 787 | $1,050 | $1.33 | 3d | 1 | 1.20mi |
| 2513 Leslie St Pasadena, TX | 3.0 | 2.0 | 1849 | $1,895 | $1.02 | 3d | 1 | 1.32mi |
| 101 S Allen-Genoa Rd Unit 197 South Houston, TX | 3.0 | 1.0 | 910 | $1,300 | $1.43 | 44d | 1 | 1.38mi |
| 3602 Burke Rd Unit 3659 Pasadena, TX | 2.0 | 2.0 | 1090 | $1,192 | $1.09 | 3d | 1 | 1.39mi |
| 3602 Burke Rd Pasadena, TX | 1.0–2.0 | 1.0 | 881 | $1,375 | $1.56 | 5d | 1 | 1.39mi |
| 801 S Allen-Genoa Rd Unit 834 South Houston, TX | 3.0 | 2.0 | 1265 | $1,370 | $1.08 | 3d | 1 | 1.42mi |
| 801 S Allen-Genoa Rd Unit 104 South Houston, TX | 2.0 | 2.0 | 911 | $1,285 | $1.41 | 44d | 1 | 1.42mi |
| 4100 Vista Rd Pasadena, TX | 1.0–3.0 | 1.0–2.0 | 868 | $1,670 | $1.92 | 2d | 15 | 1.42mi |
| 4100 Vista Rd Pasadena, TX | 1.0–3.0 | 1.0–2.0 | 868 | $1,611 | $1.86 | 1d | 9 | 1.42mi |
| 3907 Ecuador Dr Pasadena, TX | 2.0 | 1.0 | 1090 | $1,100 | $1.01 | 44d | 1 | 1.44mi |
| 3635 Shaver St Pasadena, TX | 1.0–3.0 | 1.0–2.0 | 975 | $1,499 | $1.54 | 44d | 36 | 1.48mi |
| 3508 Tulip St Pasadena, TX | 3.0 | 2.0 | 1100 | $1,650 | $1.50 | 44d | 1 | 1.48mi |
Listing history 6 events
-
2026-05-19status Pending 836-char remark
-
2026-05-14status Pending 836-char remark
-
2026-05-01price $149,990 836-char remark
-
2026-05-01$150,000 Active 836-char remark
-
1999-03-26soldstatus
-
1998-08-11soldstatus
ⓘ Source: listings_history table (triggers on properties + properties_extension) + one-shot
backfill from property_details.listing_events for pre-trigger history.
Tax reassessment forecast TX · Resets to sale price
- Current annual tax
- $4,112 · $343/mo
- Projected year-2 tax
- $4,112 · $343/mo
- Expected delta
- $0/yr ($0/mo · 0.0%)
ⓘ Screening estimate from a state-policy table — verify with the county assessor before closing.
Climate risk First Street
- Flood 1/10 Low FEMA zone X (unshaded) · 0% chance over 30 yrs
- Wildfire 1/10 Low
- Heat 10/10 Extreme 7 d/yr ≥109°F today · 24 d/yr by 30 yrs out
- Wind 9/10 Extreme 99% chance of damaging wind over 30 yrs
- Air quality 2/10 Low 2 unhealthy d/yr today · 2 by 30 yrs out
Nearby sold comps map
Loading sold comps map…
Walkable amenities ~0.75 mi
Loading nearby amenities…
Taxation est. · year 1
- Rental income
- $18,584
- − Mortgage interest
- −$8,402
- − Property taxes
- −$4,112
- − Insurance
- −$750
- − Repairs & maintenance
- −$1,487
- − Management
- −$1,487
- − Depreciation
- −$4,363
- Taxable loss
- −$2,016
- Est. tax savings @ 24.0%
- +$484
- After-tax cash flow
- $865/yr
For passive investors: Depreciation is non-cash, so a rental often shows a tax loss while cash-flowing — sheltering income. Rental losses are passive: they offset passive income freely, and up to $25,000/yr can offset ordinary (W-2) income if you actively participate and your MAGI is under $100k (phasing out to $0 by $150k); unused losses carry forward. On sale, claimed depreciation is recaptured at up to 25%, and gains may owe capital-gains tax (a 1031 exchange can defer both). Figures are a year-1 estimate at your 24.0% rate — not tax advice; consult a CPA.
Schools (NCES district)
- District
- Pasadena ISD
- NCES district ID
- 4834320
- Math proficiency
- 29% ▼ -17.00%
- Reading proficiency
- 32% ▼ -9.00%
- Median HH income
- $45,163
- Composite
- 26.15/100
- National rank
- #7275
- State rank
- #612 of 826 in TX
Livability — Pasadena
- Score
- 66/100
- State rank
- #600
- US rank
- #11438
Category grades
Schools grade is shown separately in the Schools card above.
Census & demographics
- Census place
- Pasadena, TX
- County
- Harris County · 4,702,590 people
- City population
- 109,190
- Metro
- Houston-The Woodlands-Sugar Land, TX
- Population (ZIP)
- 36,371
- Household income
- $62,500
- Rent vs Own
- Severe rent burden
- 1285.0
Population outlook (Harris County) Hauer SSP2
- Today (2025)
- 5,571,493 people
- By 2030
- 6,089,821 · +9.3%
- By 2040
- 7,142,806 · +28.2%
- By 2050
- 8,185,864 · +46.9%
- By 2075
- 10,574,329 · +89.8%
- By 2100
- 12,109,958 · +117.4%
Race, ethnicity, and origin ACS 2023
- Neighborhood character
- Predominantly Hispanic (83%)
- Race & ethnicity
- Hispanic / Latino 83% Two or more races 37% White 12% Black 4%
- Hispanic origin (detail)
- Mexican 75% Puerto Rican 1% Cuban 2%
- Common ancestry
- Italian 1%
- Foreign-born
- 30% · Canada
- Languages at home
- 40% English-only · Spanish 60%
Political lean MEDSL · Harris
- 2024 margin
- Lean D (+5.5) · D 52.0% · R 46.4% · Other 1.6%
- 2008→2024 swing
- +3.9pp toward D · 2008: 1.6pp · 2024: 5.5pp
- All cycles
- 2024: D+5.5 2020: D+13.3 2016: D+12.4 2012: D+0.1 2008: D+1.6
Not yet ingested
- Civics
- —
Market trends
- HPI YoY
- ▼ -46.12%
- Current HPI
- 278.9293
- Rent YoY
- —
- Metro
- Houston-The Woodlands-Sugar Land, TX
- State GDP YoY
- ▲ 3.95%
- F500 in state
- 110
Industry mix (Fortune 500 HQ in TX)
| Industry | F500 HQs | Revenue |
|---|---|---|
| Energy | 16 | $1,198B |
|
||
| Technology | 5 | $198B |
|
||
| Engineering / Construction | 4 | $72B |
|
||
| Energy Services | 3 | $60B |
|
||
| Utilities | 3 | $41B |
|
||
| Healthcare | 2 | $330B |
|
||
Price history
-0.0% since first listed8 events — show timeline
- 2026-06-09 Sold (Public Records) — Public Records
- 2026-06-01 Sold (MLS) — HARMLS
- 2026-05-19 Pending — HARMLS
- 2026-05-14 Pending — HARMLS
- 2026-05-01 Price Changed $149,990 HARMLS
- 2026-05-01 Listed $150,000 HARMLS
- 1999-03-26 Sold (Public Records) — Public Records
- 1998-08-11 Sold (Public Records) — Public Records
Property tax history
+3.9%/yrLatest (2025): $4,112 · +16.0% YoY. Source: county tax records.
Cash-flow waterfall
monthlySold comps — $/sqft
last 12 mo · ≤1 miLoading sold comps…