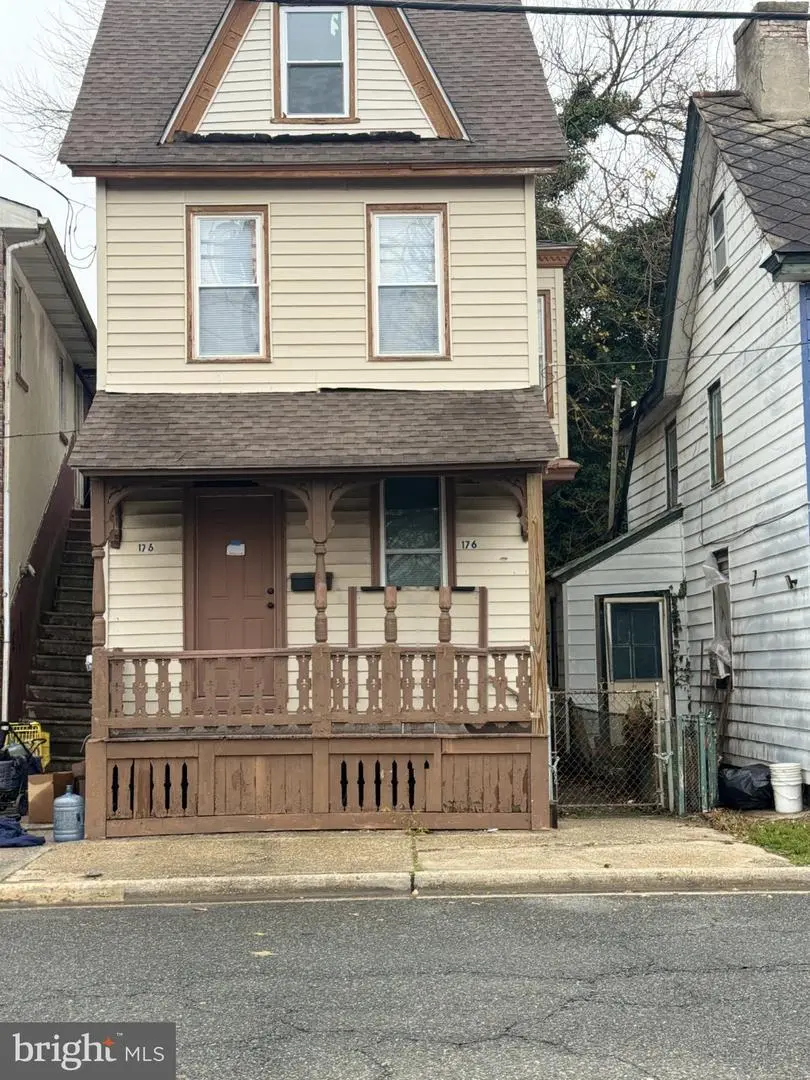
176 Griffith St · Salem, NJ
Flood risk No data
- FEMA flood zone
- —
- Chance of flooding over 30 yrs
- —
- Est. flood insurance / yr
- —
Fire risk No data
- Est. fire insurance / yr
- —
Heat risk No data
- Hot days now (above threshold)
- —
- Hot days in 30 yrs
- —
Wind risk No data
- Chance of severe wind over 30 yrs
- —
Air-quality risk No data
- Unhealthy air days now
- —
- Unhealthy air days in 30 yrs
- —
Risk factors via First Street. Map © Google.
Why this score? — see what drove the B grade
The composite is a weighted blend of 9 inputs, each scored 0–100. Each bar is that input's sub-score; the figure is the points it added to the 100-point composite (weight × sub-score).
- Cash flow +27.9/30.0
- ARV discount +15.0/15.0
- DSCR +9.9/10.0
- 1% rule +8.0/10.0
- Appreciation +4.8/10.0
- Livability +3.1/5.0
- Rent growth +2.5/5.0
- Condition / age +2.5/5.0
- Schools +1.2/10.0
$133,900
🖨 Deal sheet 📄 Offer letter ✓ Due diligence
Listing remarks MLS
Priced To Sell! 1-1/2 Bath , 3 Bedroom, 2 Story Victorian. Vinyl Siding, Newer Roof, Most Windows Replace. Great Starter Home Or Investment Property. Walk Up Attic, Full Basement. "As Is" Condition. Buyer Responsible For All Repairs And Certs.
Key facts
- Attic for storage
- Compact lot
- 1,307 sq ft lot
Tags
Property features AI
Finance
- Financial info: Fee simple ownership; Property assessed as of 2025 (tax year) — tax assessment noted
Exterior
- Parking: On-street parking
- Utilities: Public water; Public sewer; 100 amp electric service
- Home design: Detached property; Estimated year built (effective remodel 2022)
- Construction: Brick and vinyl siding with mixed/combination materials; Brick/mortar foundation; Architectural shingle roof; Energy-efficient windows
- Exterior features: Not in a federal flood zone; Two or more access exits; Above-grade other structures
Interior
- Kitchen: No kitchen appliance details listed
- Bedrooms: Three bedrooms on the upper level
- Flooring: Carpet; Ceramic tile
- Bathrooms: Two full bathrooms
- Heating & cooling: 90% efficient forced air heating (oil); Electric cooling; Electric hot water
- Interior features: Attic; Dining area; Estimated living area
- Laundry & utility: Stacked washer and dryer; Main-floor laundry
Neighborhood map
What this means for you Summary
Snapshot
- This is a 3-bed/2.0-bath single-family listed at $134k.
Deal economics
- At list price, monthly cash flow is $413 ($5k/yr) — positive.
- The deal already cash-flows at list — no discount required.
- Meets the 1% rule at list price ($2k rent vs $134k).
- Recommended offer: $132k (1.5% below list) — sets the bar for market timing.
Location & tenants
- Location reads 61/100 on livability (#462 in NJ) — a middle-class / working-renter tenant base. Strengths: cost of living A+, health & safety A+, crime B; Watch: schools D, amenities F, commute F.
- Salem City School District (town): math 6% / reading 24% proficiency, ranked #464 of 472 in NJ (top 98%) — low school quality limits family demand, transient renter base, plan for 1-2y turnover; 85% free/reduced lunch — lower-income household profile, screen leases tightly.
- Market conditions: 100 active listings in the ZIP; 10 comparable units currently listed for rent nearby; rentals leasing fast (median 2d on market — plan ~1-2 weeks tenant-placement turnaround); 95 units permitted in Salem County in 2024 (0 in 5+ unit buildings).
- This rent runs 38% of the median local income ($55k/yr) — at the standard rent-burdened threshold; future hikes will face affordability resistance.
Forward outlook
- In year one you build about $417 of equity ($926 loan paydown + $-509 appreciation (-0.4% local appreciation)).
- Salem County population projected at -23% by 2050 — secular population decline; favor cash flow + early exit over multi-decade hold.
- At projected returns (-0.4% appreciation + 3.0% rent growth), your $37k cash investment doubles in ~6 years — after that, you're playing with house money.
Negotiation context
- It's been on market 17 days — a 2% lower offer ($132k) is reasonable based on typical stale-listing flexibility.
- 4 sale attempts since 22y ago; this cycle's ask has dropped $16k (11%) from the opening price — seller is motivated, your offer sets the floor, not the list.
- Current owner paid $22k; list at $134k implies a 509% gain — meaningful room to come down on a strong offer.
Risks & watch-outs
- Watch-outs: built in 1935 — expect roof / HVAC / electrical / plumbing capex.
Questions for the listing agent
- Built in 1935 — when were the roof, HVAC, electrical panel, plumbing, and water heater last replaced?
- Is there a deadline driving the sale (1031 exchange, divorce, estate, relocation)? That informs how much negotiation room exists.
- Schools are D-rated, which usually means shorter tenancies and higher turnover. Who's the typical renter profile here, and what's been the actual vacancy rate?
- What's the average days-on-market for RENTAL listings here right now (not sales)? A rising rental-DOM trend means longer vacancies and softer asking-rent achievability than the comps imply.
- What's the recent tenant-quality profile in this submarket — average credit score on applications, eviction rate, late-payment / NSF rate, and stable-employment percentage? A property-management company in the area should have these aggregated.
- How much new for-sale + rental construction is in the pipeline within 1–3 miles? Heavy new supply typically softens prices + rents 12–24 months out; constrained supply supports both.
Investment metrics
- 1% rule
- 1.30% ✓
- Cap rate
- 9.99%
- Cash-on-cash
- 13.21%
- DSCR
- 1.59
- GRM
- 6.4
CMA / ARV
- ARV (on-the-fly)
- $184,320
- Comps found
- 12
Show comp detail 12 sales within ~0.75 mi
| Address | Dist | Beds/Ba | Sqft | Sold | Price | $/sf | Match |
|---|---|---|---|---|---|---|---|
| 304 New Market St | 0.44mi | 3/1.0 | 1,310 (+2%) | 4mo | $186,000 | $142 | 68 |
| 115 Chestnut St | 0.49mi | 3/3.5 | 1,282 (+0%) | 8mo | $185,000 | $144 | 65 |
| 51 S Third St | 0.47mi | 3/1.5 | 1,348 (+5%) | 9mo | $210,000 | $156 | 60 |
| 28 Chestnut St | 0.29mi | 3/1.0 | 1,152 (-10%) | 9mo | $118,000 | $102 | 58 |
| 208 9th St | 0.46mi | 3/1.0 | 1,149 (-10%) | 1mo | $224,000 | $195 | 57 |
| 318 Fenwick Ave | 0.62mi | 3/1.0 | 1,344 (+5%) | 3mo | $191,250 | $142 | 56 |
| 200 Smith St | 0.53mi | 3/1.5 | 1,212 (-5%) | 10mo | $140,000 | $116 | 56 |
| 363 Grant St | 0.62mi | 3/2.5 | 1,424 (+11%) | 0mo | $250,000 | $176 | 50 |
| 184 Chestnut St | 0.73mi | 3/1.0 | 1,305 (+2%) | 13mo | $161,000 | $123 | 48 |
| 170 Johnson St | 0.58mi | 3/1.0 | 1,417 (+11%) | 9mo | $180,000 | $127 | 44 |
| 179 Victory Ave | 0.72mi | 4/1.5 (+1) | 1,449 (+13%) | 0mo | $238,000 | $164 | 37 |
| 352 Allen Ave | 0.69mi | 3/1.5 | 1,460 (+14%) | 6mo | $225,000 | $154 | 37 |
Match score weights: distance 35% · size 25% · config 20% · recency 20%. Top-matched comps best support the ARV.
Projected returns pro-forma
-0.38% appreciation · 3.0% rent growth · sell at horizon
- IRR
- 11.4%
- Equity multiple
- 1.53×
- Total profit
- $20,052
- Equity at exit
- $36,354
- IRR
- 16.7%
- Equity multiple
- 2.77×
- Total profit
- $66,454
- Equity at exit
- $41,731
Cash invested: $37,492 (down + closing). Projections, not guarantees.
Landlord ↔ Tenant lean methodology
- Overall (STATE)
- 21 Tenant-Leaning
- State New Jersey
- 21 Tenant-Leaning · D+6
- County
- — inherits STATE
- City
- — inherits STATE
ZIP-level market 08079
- Home prices YoY
- -0.1%
- Active inventory
- 100
- Price-to-rent
- 6.4×
Monthly cashflow live
- Estimated rent
- $1,744 high interval (Pro) →
- Mortgage (P&I)
- −$702
- Tax from tax record
- −$207 /mo · $2,485/yr
- Insurance
- −$56
- HOA
- −$0
- Vacancy / Maint / Mgmt
- −$366
- Net cashflow
- $413
Break-even live
UW: 25.0% down · 7.5% · 30yr · 1.5% tax · 5.0% vac · 8.0% maint · 8.0% mgmt
Financing live
Cash to close
- Down payment
- $33,475
- Closing costs
- $4,017
- Reserves months
- —
- Total cash needed
- —
Loan-product check · same deal, 3 products live
Conventional
25% down · 7.5% · 30yr
- Down + closing
- —
- Monthly P&I
- —
- Monthly cashflow
- —
- DSCR
- —
- Eligible?
- —
Personal DTI + credit; lowest rate.
DSCR
20% down · 8.5% · 30yr
- Down + closing
- —
- Monthly P&I
- —
- Monthly cashflow
- —
- DSCR
- —
- Eligible?
- —
No personal income docs; deal must DSCR.
Hard money
10% down · 12.0% · 12mo
- Down + closing
- —
- Monthly P&I
- —
- Monthly cashflow
- —
- DSCR
- —
- Eligible?
- —
Short-term bridge; refi at stabilization.
Rent comps 10 comps
| Address | Beds | Baths | Sqft | Rent | $/sqft | DOM | Units | Dist |
|---|---|---|---|---|---|---|---|---|
| 242 Grant St Unit 1ST FLOOR Salem, NJ | 2.0 | 1.0 | 925 | $1,675 | $1.81 | 1d | 1 | 0.30mi |
| 270-272 Grant St Salem, NJ | 4.0 | 1.0 | 1644 | $2,100 | $1.28 | 5d | 1 | 0.37mi |
| 23 7th St Unit B Salem, NJ | 3.0 | 1.0 | 1000 | $1,450 | $1.45 | 3d | 1 | 0.37mi |
| 26 Walnut St Unit A Salem, NJ | 2.0 | 1.0 | 1000 | $1,225 | $1.23 | 1d | 1 | 0.39mi |
| 37 Eighth St Salem, NJ | 3.0 | 1.0 | 1092 | $1,850 | $1.69 | 1d | 1 | 0.41mi |
| 1 9th St Salem, NJ | 2.0 | 1.0 | 900 | $1,450 | $1.61 | 1d | 1 | 0.43mi |
| 218 Sinnickson St Salem, NJ | 2.0 | 1.0 | 1008 | $1,500 | $1.49 | 1d | 1 | 0.51mi |
| 332 E Broadway Salem, NJ | 3.0 | 2.0 | 1844 | $1,980 | $1.07 | 44d | 1 | 0.64mi |
| 380 E Broadway Salem, NJ | 2.0 | 1.0 | 1300 | $1,350 | $1.04 | 1d | 1 | 0.81mi |
| 124 Yorke St Unit 37 Salem, NJ | 2.0 | 1.0 | 1220 | $1,350 | $1.11 | 2d | 1 | 1.21mi |
Listing history 26 events
-
2026-06-18days on market $133,900 Active 17 DOM
-
2026-06-17days on market $133,900 Active 16 DOM
-
2026-06-16days on market $133,900 Active 15 DOM
-
2026-06-15days on market $133,900 Active 14 DOM
-
2026-06-13days on market $133,900 Active 12 DOM
-
2026-06-13days on market $133,900 Active 11 DOM
-
2026-06-09days on market $133,900 Active 8 DOM
-
2026-06-08days on market $133,900 Active 7 DOM
-
2026-06-07days on market $133,900 Active 6 DOM
-
2026-06-04days on market $133,900 Active 3 DOM
-
2026-06-03days on market $133,900 Active 2 DOM
-
2026-06-02pricedays on market $133,900 Active 1 DOM
-
2026-04-10price $139,900
-
2026-01-18price $144,900
-
2026-01-14historical
-
2025-11-22$149,900 Active
-
2012-06-25soldstatus $22,000
-
2011-08-30historical
-
2011-02-11$39,000
-
2005-03-31soldstatus $53,000
-
2005-03-30soldstatus $53,000 253-char remark
Show marketing remark (253 chars)
Priced To Sell! 1-1/2 Bath , 3 Bedroom, 2 Story Victorian. Vinyl Siding, Newer Roof, Most Windows Replace. Great Starter Home Or Investment Property. Walk Up Attic, Full Basement. "As Is" Condition. Buyer Responsible For All Repairs And Certs.
-
2005-02-07historical 253-char remark
Show marketing remark (253 chars)
Priced To Sell! 1-1/2 Bath , 3 Bedroom, 2 Story Victorian. Vinyl Siding, Newer Roof, Most Windows Replace. Great Starter Home Or Investment Property. Walk Up Attic, Full Basement. "As Is" Condition. Buyer Responsible For All Repairs And Certs.
-
2004-12-15historical
-
2004-06-03$53,000 253-char remark
Show marketing remark (253 chars)
Priced To Sell! 1-1/2 Bath , 3 Bedroom, 2 Story Victorian. Vinyl Siding, Newer Roof, Most Windows Replace. Great Starter Home Or Investment Property. Walk Up Attic, Full Basement. "As Is" Condition. Buyer Responsible For All Repairs And Certs.
-
2004-06-03$59,900
Show marketing remark (253 chars)
Priced To Sell! 1-1/2 Bath , 3 Bedroom, 2 Story Victorian. Vinyl Siding, Newer Roof, Most Windows Replace. Great Starter Home Or Investment Property. Walk Up Attic, Full Basement. "As Is" Condition. Buyer Responsible For All Repairs And Certs.
-
1986-04-25soldstatus $13,500
ⓘ Source: listings_history table (triggers on properties + properties_extension) + one-shot
backfill from property_details.listing_events for pre-trigger history.
Tax reassessment forecast NJ · Partial reset (capped growth)
- Current annual tax
- $2,485 · $207/mo
- Projected year-2 tax
- $2,909 · $242/mo
- Expected delta
- +$425/yr (+$35/mo · 17.1%)
ⓘ Screening estimate from a state-policy table — verify with the county assessor before closing.
Nearby sold comps map
Loading sold comps map…
Walkable amenities ~0.75 mi
Loading nearby amenities…
Taxation est. · year 1
- Rental income
- $20,930
- − Mortgage interest
- −$7,500
- − Property taxes
- −$2,485
- − Insurance
- −$670
- − Repairs & maintenance
- −$1,674
- − Management
- −$1,674
- − Depreciation
- −$3,895
- Taxable income
- $3,031
- Est. tax owed @ 24.0%
- −$727
- After-tax cash flow
- $4,227/yr
For passive investors: Depreciation is non-cash, so a rental often shows a tax loss while cash-flowing — sheltering income. Rental losses are passive: they offset passive income freely, and up to $25,000/yr can offset ordinary (W-2) income if you actively participate and your MAGI is under $100k (phasing out to $0 by $150k); unused losses carry forward. On sale, claimed depreciation is recaptured at up to 25%, and gains may owe capital-gains tax (a 1031 exchange can defer both). Figures are a year-1 estimate at your 24.0% rate — not tax advice; consult a CPA.
Schools (NCES district)
- District
- Salem City School District
- NCES district ID
- 3414550
- Math proficiency
- 6% ▼ -1.00%
- Reading proficiency
- 24% ▲ 2.00%
- Median HH income
- $27,118
- Composite
- 11.51/100
- National rank
- #9702
- State rank
- #464 of 472 in NJ
Livability — Salem
- Score
- 61/100
- State rank
- #462
- US rank
- #17533
Category grades
Schools grade is shown separately in the Schools card above.
Census & demographics
- Census place
- Salem, NJ
- County
- Salem County · 24,175 people
- City population
- 10,762
- Metro
- Philadelphia-Camden-Wilmington, PA-NJ-DE-MD
- Population (ZIP)
- 10,762
- Household income
- $54,641
- Rent vs Own
- Severe rent burden
- 663.0
Population outlook (Salem County) Hauer SSP2
- Today (2025)
- 59,905 people
- By 2030
- 57,351 · -4.3%
- By 2040
- 51,837 · -13.5%
- By 2050
- 46,356 · -22.6%
- By 2075
- 36,452 · -39.2%
- By 2100
- 28,907 · -51.7%
Race, ethnicity, and origin ACS 2023
- Neighborhood character
- Diverse neighborhood (Simpson 0.55)
- Race & ethnicity
- White 59% Black 31% Hispanic / Latino 6% Two or more races 5% Asian 1%
- Hispanic origin (detail)
- Puerto Rican 5%
- Common ancestry
- Romanian 3% Lithuanian 2% Italian 1%
- Foreign-born
- 2% · Canada
- Languages at home
- 94% English-only · Spanish 4% Tagalog/Filipino 1%
Political lean MEDSL · Salem
- 2024 margin
- R (+19.2) · D 39.6% · R 58.8% · Other 1.6%
- 2008→2024 swing
- -23.1pp toward R · 2008: 3.9pp · 2024: -19.2pp
- All cycles
- 2024: R+19.2 2020: R+12.8 2016: R+15.4 2012: D+0.8 2008: D+3.9
Not yet ingested
- Civics
- —
Market trends
- HPI YoY
- ▼ -0.38%
- Current HPI
- 258.0047
- Rent YoY
- —
- Metro
- Philadelphia-Camden-Wilmington, PA-NJ-DE-MD
- State GDP YoY
- ▲ 2.05%
- F500 in state
- 34
Industry mix (Fortune 500 HQ in NJ)
| Industry | F500 HQs | Revenue |
|---|---|---|
| Consumer Goods | 3 | $31B |
|
||
| Pharmaceuticals | 2 | $153B |
|
||
| Technology | 2 | $21B |
|
||
| Insurance | 2 | $20B |
|
||
| Healthcare | 2 | $19B |
|
||
| Financial Services | 1 | $70B |
|
||
Price history
+936.3% since first listed14 events — show timeline
- 2026-04-10 Price Changed $139,900 BRIGHT MLS
- 2026-01-18 Price Changed $144,900 BRIGHT MLS
- 2026-01-14 Listing Removed — BRIGHT MLS
- 2025-11-22 Listed $149,900 BRIGHT MLS
- 2012-06-25 Sold (Public Records) $22,000 Public Records
- 2011-08-30 Listing Removed — BRIGHT MLS
- 2011-02-11 Listed $39,000 BRIGHT MLS
- 2005-03-31 Sold (Public Records) $53,000 Public Records
- 2005-03-30 Sold (MLS) $53,000 BRIGHT MLS
- 2005-02-07 Listing Removed — BRIGHT MLS
- 2004-12-15 Listing Removed — BRIGHT MLS
- 2004-06-03 Listed $59,900 BRIGHT MLS
- 2004-06-03 Listed $53,000 BRIGHT MLS
- 1986-04-25 Sold (Public Records) $13,500 Public Records
Property tax history
-0.6%/yrLatest (2025): $2,485 · +4.9% YoY. Source: county tax records.
Cash-flow waterfall
monthlySold comps — $/sqft
last 12 mo · ≤1 miLoading sold comps…