239 Beach City Rd #2307 · Hilton Head Island, SC
Flood risk No data
- FEMA flood zone
- —
- Chance of flooding over 30 yrs
- —
- Est. flood insurance / yr
- —
Fire risk No data
- Est. fire insurance / yr
- —
Heat risk No data
- Hot days now (above threshold)
- —
- Hot days in 30 yrs
- —
Wind risk No data
- Chance of severe wind over 30 yrs
- —
Air-quality risk No data
- Unhealthy air days now
- —
- Unhealthy air days in 30 yrs
- —
Risk factors via First Street. Map © Google.
Why this score? — see what drove the F grade
The composite is a weighted blend of 9 inputs, each scored 0–100. Each bar is that input's sub-score; the figure is the points it added to the 100-point composite (weight × sub-score).
- ARV discount +11.7/15.0
- Cash flow +5.4/30.0
- Schools +4.1/10.0
- Livability +3.2/5.0
- 1% rule +2.9/10.0
- Rent growth +2.5/5.0
- Condition / age +2.5/5.0
- DSCR +0.0/10.0
- Appreciation +0.0/10.0
$324,900
🖨 Deal sheet (PDF) 📄 Offer letter ✓ Due diligence
Listing remarks
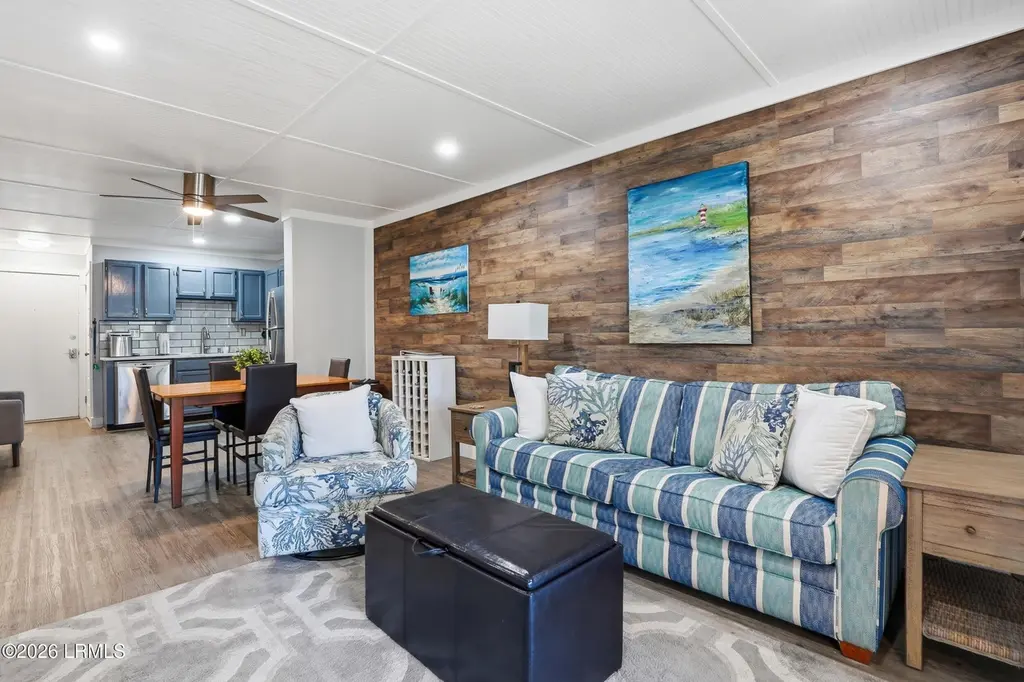
Experience elevated island living in this bright 2-bedroom, 2-bathroom third-floor villa. Enjoy peaceful pool views and a refreshing coastal breeze just 100 yards from the sound front and its private beach. This gated community offers a unique nature-preserve feel paired with resort-style amenities, including on-site tennis and pickleball courts, three swimming pools--including an indoor heated option--a fitness center, and a community pier perfect for sunset dolphin watching. Whether you are seeking a private vacation retreat or a savvy investment, this condo puts you steps away from Hilton Head's extensive bike trails and scenic parks. Don't miss your chance to own a slice of paradise whe
Key facts
- Marble countertops
- Custom wet bar
- Private balcony
Tags
Property features AI
Finance
- HOA & community: HOA covers association management, common areas, cable TV, insurance, internet, structure maintenance, pest control, pool(s), sewer, trash, water, and grounds maintenance; Community amenities include beach rights and access, basketball court, fitness center, barbecue and picnic areas, playground, pool, guard, and tennis courts
Exterior
- Parking: Unassigned parking
- Security: Security gate; Security guard
- Utilities: Public water
- Home design: Condominium (unit); Includes entrance foyer
- Construction: Enclosed porch and screened exterior elements
- Exterior features: Enclosed porch; Balcony; Patio; Porch; Screened areas; Community pool with solar heating; Has a view
Interior
- Kitchen: Dishwasher; Disposal; Microwave; Refrigerator
- Bedrooms: Includes foyer, kitchen and living room (listed room types)
- Flooring: Luxury vinyl; Luxury vinyl plank
- Bathrooms: 2 full bathrooms
- Heating & cooling: Central heating; Central air conditioning
- Interior features: Furnished; Fire extinguisher; Smooth ceilings; Cable TV access; Entrance foyer
- Laundry & utility: Washer; Dryer
Neighborhood map
What this means for you Summary
Snapshot
- This is a 2-bed/2.0-bath condo listed at $325k.
Deal economics
- At list price, monthly cash flow is $-703 ($-8k/yr) — negative.
- To cash-flow at today's rent, offer at most $306k (5.9% below list).
- To meet the 1% rule (rent ≥ 1% of price), the offer needs to be $258k (20.6% below list).
- Recommended offer: $258k (20.6% below list) — sets the bar for 1% rule.
- Cap rate 3.7% vs local median 2.9% in Hilton Head Island — meaningfully above typical; check what's discounted (condition, days-on-market, listing class) to confirm the premium yield is real.
Location & tenants
- Location reads 64/100 on livability (#157 in SC) — a middle-class / working-renter tenant base. Strengths: employment A+, crime A-; Watch: amenities F, commute F, cost of living F.
- Beaufort 01 (town): math 42% / reading 51% proficiency, ranked #17 of 80 in SC (top 21%) — families likely to look elsewhere, expect single-tenant / working-renter base with shorter leases.
- Zoned schools: Hilton Head Island Elementary (math 50% / reading 49%, grade D, #168 of 597 statewide, top 31%, 709 students, 56% FRL); Hilton Head Island Middle (math 33% / reading 42%, grade F, #90 of 229 statewide, top 42%, 856 students, 52% FRL); Hilton Head Island High (math 70% / reading 82%, grade A-, #34 of 196 statewide, top 17%, 1,345 students, 40% FRL) — zoned schools at 49% FRL track the district average.
- Market conditions: Rents soft (-0.2%/yr); 400 active listings in the ZIP; 4 comparable units currently listed for rent nearby; rentals at typical pace (median 24d on market — plan ~3-4 weeks tenant-placement turnaround); solid renter incomes; 1,824 units permitted in Beaufort County in 2024 (618 in 5+ unit buildings).
- This rent runs 32% of the median local income ($98k/yr) — at the standard rent-burdened threshold; future hikes will face affordability resistance.
Forward outlook
- Local home prices are declining (-3.0%/yr); year-one equity from $2k of loan paydown is wiped out by about $10k of value loss. Plan a longer hold.
- Beaufort County population projected at +30% by 2050 — long-run rental-demand tailwind backs the buy-and-hold thesis.
Negotiation context
- Only 13 days on market — expect competitive offers; lowballing is unlikely to land.
- 12 sale attempts since 12y ago with the ask held roughly flat each time — persistent listings suggest the price (not the market) is what's stuck; bring a comps-based counter.
- Current owner paid $234k; 39% above their basis — modest negotiation headroom, anchor on the comps not their cost.
Risks & watch-outs
- Watch-outs: HOA is 23% of rent.
Questions for the listing agent
- What do current leases actually rent for vs. the listed asking? Can we see a recent rent roll and the last 12 months of T-12 income?
- What does the HOA fee cover, when was the last increase, and are there any pending special assessments or reserve-fund shortfalls?
- Any open or pending special assessments — roof, HVAC, plumbing, elevator, façade? What's the per-unit balance and payoff schedule, and is the seller paying it off at close or rolling it to the buyer?
- Is there a deadline driving the sale (1031 exchange, divorce, estate, relocation)? That informs how much negotiation room exists.
- Schools are B-rated — typically a magnet for longer-tenancy family renters. What's the average tenant stay here, and is there a school-zone premium baked into asking?
- The area grade is low — what's the realistic commute time and amenity access for the typical tenant pool here? Any planned neighborhood developments (good or bad) we should know about?
- What's the average days-on-market for RENTAL listings here right now (not sales)? A rising rental-DOM trend means longer vacancies and softer asking-rent achievability than the comps imply.
- What's the recent tenant-quality profile in this submarket — average credit score on applications, eviction rate, late-payment / NSF rate, and stable-employment percentage? A property-management company in the area should have these aggregated.
- How much new apartment / multifamily construction is in the pipeline within 1–3 miles? Heavy new supply (>2% of stock underway) typically softens rents 12–24 months out; light construction supports rent growth.
Investment metrics
- 1% rule
- 0.79% ✗
- Cap rate
- 3.70%
- Cash-on-cash
- -9.28%
- DSCR
- 0.59
- GRM
- 10.5
CMA / ARV
- ARV (median comp)
- $358,452
- List price
- $324,900
- Delta
- -6.85%
- Verdict
- FAIR
- Comps
- 20 within 1.0 mi
Projected returns pro-forma
-3.0% appreciation · 0.0% rent growth · sell at horizon
- IRR
- -37.1%
- Equity multiple
- -0.15×
- Total profit
- $-104,661
- Equity at exit
- $48,444
- IRR
- -83.6%
- Equity multiple
- -0.94×
- Total profit
- $-176,636
- Equity at exit
- $28,091
Cash invested: $90,972 (down + closing). Projections, not guarantees.
Landlord ↔ Tenant lean methodology
- Overall (STATE)
- 90 Strongly Landlord-Friendly
- State South Carolina
- 90 Strongly Landlord-Friendly · R+6
- County
- — inherits STATE
- City
- — inherits STATE
ZIP-level market 29926
- Home prices YoY
- -26.7%
- Rents YoY
- -0.2%
- Active inventory
- 400
- Price-to-rent
- 10.5×
Monthly cashflow live
- Estimated rent
- $2,579 medium interval (Pro) →
- Mortgage (P&I)
- −$1,704
- Tax from tax record
- −$307 /mo · $3,680/yr
- Insurance
- −$135
- HOA est. from 14 same-building comps
- −$595
- Lot rent
- −$0
- Vacancy / Maint / Mgmt
- −$542
- Net cashflow
- $-703
Break-even live
Sensitivity live
| Price | -10% $-519 | -5% $-611 | +0% $-703 | +5% $-795 | +10% $-887 |
|---|---|---|---|---|---|
| Rent | -10% $-907 | -5% $-805 | +0% $-703 | +5% $-602 | +10% $-500 |
| Rate | -1.0pp $-540 | -0.5pp $-621 | base $-703 | +0.5pp $-788 | +1.0pp $-873 |
UW: 25.0% down · 7.5% · 30yr · 1.5% tax · 5.0% vac · 8.0% maint · 8.0% mgmt
Financing live
Cash to close
- Down payment
- $81,225
- Closing costs
- $9,747
- Reserves months
- —
- Total cash needed
- —
Loan-product check · same deal, 3 products live
Conventional
25% down · 7.5% · 30yr
- Down + closing
- —
- Monthly P&I
- —
- Monthly cashflow
- —
- DSCR
- —
- Eligible?
- —
Personal DTI + credit; lowest rate.
DSCR
20% down · 8.5% · 30yr
- Down + closing
- —
- Monthly P&I
- —
- Monthly cashflow
- —
- DSCR
- —
- Eligible?
- —
No personal income docs; deal must DSCR.
Hard money
10% down · 12.0% · 12mo
- Down + closing
- —
- Monthly P&I
- —
- Monthly cashflow
- —
- DSCR
- —
- Eligible?
- —
Short-term bridge; refi at stabilization.
Rent comps 4 comps
| Address | Beds | Baths | Sqft | Rent | $/sqft | DOM | Units | Dist |
|---|---|---|---|---|---|---|---|---|
| 239 Beach City Rd #1120 Hilton Head Island, SC | 2.0 | 2.0 | 917 | $1,995 | $2.18 | 46d | 1 | 0.03mi |
| 239 Beach City Rd Unit 1316239P Hilton Head Island, SC | 2.0 | 2.0 | 839 | $3,073 | $3.66 | 23d | 1 | 0.07mi |
| 155 Dillon Rd Hilton Head Island, SC | 2.0 | 2.0–2.5 | 1120 | $2,050 | $1.83 | 16d | 1 | 0.72mi |
| 112 Union Cemetery Rd Hilton Head Island, SC | 2.0 | 2.0 | 1025 | $2,125 | $2.07 | 16d | 1 | 1.41mi |
HOA detail condo
- Monthly dues
- $0 · $0/yr
- Likely covers
- poolgymsecurity
- Assessments
- None detected in remarks — confirm with the listing agent.
Listing history 45 events
-
2026-06-21days on market $324,900 Active 13 DOM
-
2026-06-18days on market $324,900 Active 10 DOM
-
2026-06-17days on market $324,900 Active 9 DOM
-
2026-06-16days on market $324,900 Active 8 DOM
-
2026-06-15days on market $324,900 Active 7 DOM
-
2026-06-14days on market $324,900 Active 5 DOM
-
2026-06-13days on market $324,900 Active 4 DOM
-
2026-06-10days on market $324,900 Active 2 DOM
-
2026-06-09pricedays on market $324,900 Active 1 DOM
-
2026-06-03days on market $331,900 Active 74 DOM
-
2026-06-02days on market $331,900 Active 73 DOM
-
2026-06-01days on market $331,900 Active 72 DOM
-
2026-05-31days on market $331,900 Active 71 DOM
-
2026-05-02price $333,900 763-char remark
-
2026-04-23$335,900 Active
-
2026-04-13price $335,900
-
2026-04-13price $335,900 763-char remark
-
2026-04-13price $322,900 763-char remark
-
2026-03-21$324,900 Active 763-char remark
-
2026-03-21$337,900 Active
-
2025-08-13$328,900 Active
-
2025-08-13$328,900 Active
-
2023-02-23soldstatus $234,500
-
2023-02-18historical
-
2023-02-16soldstatus $234,500 Closed
-
2023-02-16soldstatus $234,500 Closed
-
2023-02-02status Pending
-
2023-02-02status Pending
-
2022-12-27price $249,900
-
2022-12-27price $249,900
-
2022-12-21price $259,900
-
2022-12-21price $259,900
-
2022-11-25price $269,900
-
2022-11-07$279,900 Active
-
2022-11-07status Active
-
2022-11-02$279,900
-
2019-01-21$147,000
-
2018-10-01soldstatus $130,000
-
2018-09-19soldstatus $130,000
-
2018-08-19$132,900
-
2014-10-23soldstatus $56,500
-
2014-10-20soldstatus $56,500
-
2014-04-22$57,900
-
2000-05-12soldstatus $48,000
-
1984-08-01soldstatus $80,600
ⓘ Source: listings_history table (triggers on properties + properties_extension) + one-shot
backfill from property_details.listing_events for pre-trigger history.
Tax reassessment forecast SC · Resets to sale price
- Current annual tax
- $3,680 · $307/mo
- Projected year-2 tax
- $3,680 · $307/mo
- Expected delta
- $0/yr ($0/mo · 0.0%)
ⓘ Screening estimate from a state-policy table — verify with the county assessor before closing.
Nearby sold comps map
Loading sold comps map…
Walkable amenities ~0.75 mi
Loading nearby amenities…
Taxation est. · year 1
- Rental income
- $30,949
- − Mortgage interest
- −$18,199
- − Property taxes
- −$3,680
- − Insurance
- −$1,624
- − Repairs & maintenance
- −$2,476
- − Management
- −$2,476
- − HOA
- −$7,140
- − Depreciation
- −$9,452
- Taxable loss
- −$14,098
- Est. tax savings @ 24.0%
- +$3,384
- After-tax cash flow
- $-5,057/yr
For passive investors: Depreciation is non-cash, so a rental often shows a tax loss while cash-flowing — sheltering income. Rental losses are passive: they offset passive income freely, and up to $25,000/yr can offset ordinary (W-2) income if you actively participate and your MAGI is under $100k (phasing out to $0 by $150k); unused losses carry forward. On sale, claimed depreciation is recaptured at up to 25%, and gains may owe capital-gains tax (a 1031 exchange can defer both). Figures are a year-1 estimate at your 24.0% rate — not tax advice; consult a CPA.
Schools (NCES district)
- District
- Beaufort 01
- NCES district ID
- 4501110
- Math proficiency
- 42% ▼ -8.00%
- Reading proficiency
- 51% ▲ 2.00%
- Median HH income
- $57,430
- Composite
- 40.56/100
- National rank
- #3699
- State rank
- #17 of 80 in SC
Livability — Hilton Head Island
- Score
- 64/100
- State rank
- #157
- US rank
- #14648
Category grades
Schools grade is shown separately in the Schools card above.
Census & demographics
- Census place
- Hilton Head Island, SC
- County
- Beaufort County · 163,770 people
- City population
- 40,243
- Metro
- Hilton Head Island-Bluffton, SC
- Population (ZIP)
- 24,458
- Household income
- $97,948
- Rent vs Own
- Severe rent burden
- 562.0
Population outlook (Beaufort County) Hauer SSP2
- Today (2025)
- 211,915 people
- By 2030
- 227,272 · +7.2%
- By 2040
- 253,861 · +19.8%
- By 2050
- 275,126 · +29.8%
- By 2075
- 311,022 · +46.8%
- By 2100
- 321,286 · +51.6%
Race, ethnicity, and origin ACS 2023
- Neighborhood character
- Predominantly White (70%)
- Race & ethnicity
- White 70% Hispanic / Latino 19% Two or more races 9% Black 8%
- Hispanic origin (detail)
- Mexican 13%
- Common ancestry
- Romanian 3% Slovak 3% Lithuanian 2%
- Foreign-born
- 14% · Canada, Jamaica
- Languages at home
- 82% English-only · Spanish 16% French/Haitian/Cajun 1% Other Indo-European 1%
Political lean MEDSL · Beaufort
- 2024 margin
- R (+14.5) · D 42.1% · R 56.6% · Other 1.2%
- 2008→2024 swing
- -3.7pp toward R · 2008: -10.8pp · 2024: -14.5pp
- All cycles
- 2024: R+14.5 2020: R+10.0 2016: R+14.3 2012: R+17.5 2008: R+10.8
Not yet ingested
- Civics
- —
Market trends
- HPI YoY
- ▼ -98.89%
- Current HPI
- 271.4783
- Rent YoY
- ▼ -0.16%
- Metro
- Hilton Head Island-Bluffton, SC
- State GDP YoY
- ▲ 4.51%
- F500 in state
- 2
Industry mix (Fortune 500 HQ in SC)
| Industry | F500 HQs | Revenue |
|---|---|---|
| Packaging | 1 | $7B |
|
||
Price history
+303.1% since first listed34 events — show timeline
- 2026-06-08 Listed $324,900 RSMLS
- 2026-05-27 Price Changed $331,900 LRMLS
- 2026-05-02 Price Changed $333,900 LRMLS
- 2026-04-23 Listed $335,900 RSMLS
- 2026-04-13 Price Changed $335,900 RSMLS
- 2026-04-13 Price Changed $335,900 LRMLS
- 2026-04-13 Price Changed $322,900 LRMLS
- 2026-03-21 Listed $324,900 LRMLS
- 2026-03-21 Listed $337,900 RSMLS
- 2025-08-13 Listed $328,900 LRMLS
- 2025-08-13 Listed $328,900 RSMLS
- 2023-02-23 Sold (Public Records) $234,500 Public Records
- 2023-02-18 Delisted — LRMLS
- 2023-02-16 Sold (MLS) $234,500 RSMLS
- 2023-02-16 Sold (MLS) $234,500 LRMLS
- 2023-02-02 Pending — LRMLS
- 2023-02-02 Pending — RSMLS
- 2022-12-27 Price Changed $249,900 LRMLS
- 2022-12-27 Price Changed $249,900 RSMLS
- 2022-12-21 Price Changed $259,900 LRMLS
- 2022-12-21 Price Changed $259,900 RSMLS
- 2022-11-25 Price Changed $269,900 RSMLS
- 2022-11-07 Listed $279,900 LRMLS
- 2022-11-07 Relisted — RSMLS
- 2022-11-02 Listed $279,900 RSMLS
- 2019-01-21 Listed $147,000 RSMLS
- 2018-10-01 Sold (Public Records) $130,000 Public Records
- 2018-09-19 Sold (MLS) $130,000 RSMLS
- 2018-08-19 Listed $132,900 RSMLS
- 2014-10-23 Sold (Public Records) $56,500 Public Records
- 2014-10-20 Sold (MLS) $56,500 RSMLS
- 2014-04-22 Listed $57,900 RSMLS
- 2000-05-12 Sold (Public Records) $48,000 Public Records
- 1984-08-01 Sold (Public Records) $80,600 Public Records
Property tax history
+13.0%/yrLatest (2025): $3,680 · +1.4% YoY. Source: county tax records.
Cash-flow waterfall
monthlySold comps — $/sqft
last 12 mo · ≤1 miLoading sold comps…