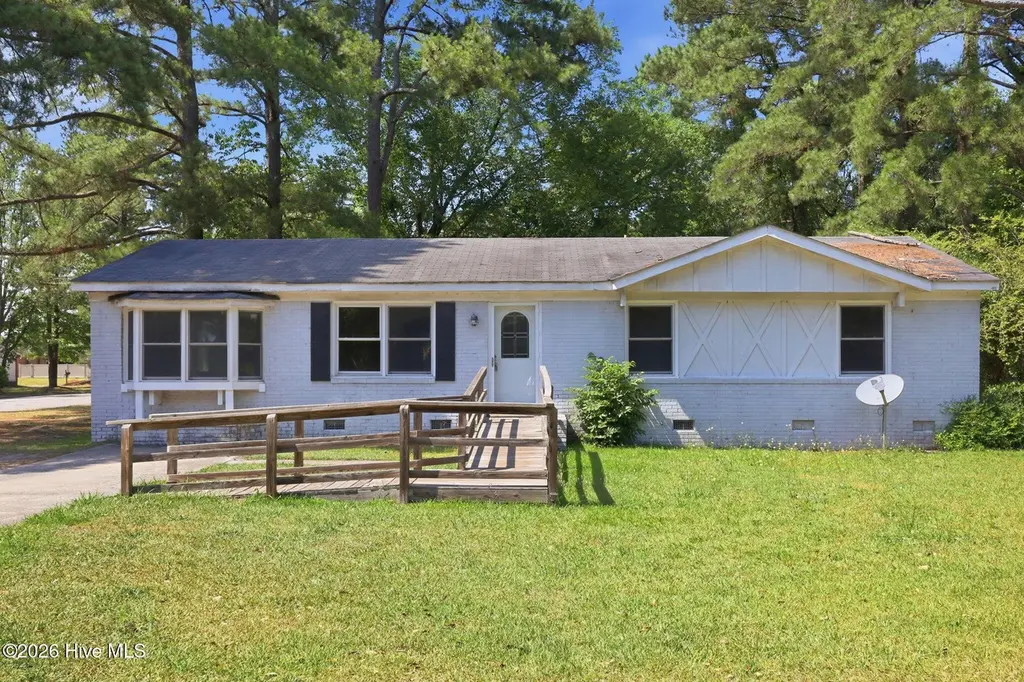
101 Fairwood Ln · Greenville, NC
Flood risk 3/10 · Minor
- FEMA flood zone
- X (unshaded)
- Chance of flooding over 30 yrs
- 0.2%
- Est. flood insurance / yr
- $507 – $1,088
Fire risk 3/10 · Minor
- Est. fire insurance / yr
- $906 – $1,684
Heat risk 7/10 · Major
- Hot days now (above 106°F)
- 7 days/yr
- Hot days in 30 yrs
- 16 days/yr
Wind risk 8/10 · Major
- Chance of severe wind over 30 yrs
- 80.0%
Air-quality risk 3/10 · Minor
- Unhealthy air days now
- 3 days/yr
- Unhealthy air days in 30 yrs
- 3 days/yr
Risk factors via First Street. Map © Google.
Why this score? — see what drove the C+ grade
The composite is a weighted blend of 9 inputs, each scored 0–100. Each bar is that input's sub-score; the figure is the points it added to the 100-point composite (weight × sub-score).
- Cash flow +21.7/30.0
- ARV discount +15.0/15.0
- DSCR +6.9/10.0
- 1% rule +5.4/10.0
- Rent growth +3.9/5.0
- Livability +3.9/5.0
- Schools +3.6/10.0
- Condition / age +2.5/5.0
- Appreciation +0.0/10.0
$149,000
🖨 Deal sheet 📄 Offer letter ✓ Due diligence
Listing remarks MLS
3 bedroom and 2 bath brick house with a study/office on a corner lot. Large master bedroom with walk-in closet, hardwood floors, kitchen with a back splash and stains steel appliances, roof replaced recently, large bathrooms and a lot more. new Heat/AC and energy efficient windows. Hurry or you might miss this one. Sold AS IS no exceptions! With a full price offer, seller is willing to provide $500 home warranty and $3,000 towards buyer expenses!!
Key facts
- Mature surroundings
- Convenient location
- Generous yard space
Tags
Property features AI
Exterior
- Parking: Concrete parking
- Utilities: Public water; Sewer connected; Water connected
- Home design: Single family residence; One story; Entry level: 1
- Construction: Brick and wood siding; Shingle roof; See remarks for additional construction details
- Exterior features: Deck; Corner lot; Has a view; Barn(s) on property; Paved road frontage
Interior
- Kitchen: Dishwasher
- Bedrooms: 6 total rooms (includes bedrooms and other rooms)
- Flooring: Carpet; Vinyl; Wood
- Bathrooms: 2 full bathrooms
- Heating & cooling: Central air conditioning; Electric heating; Forced air; Natural gas
- Interior features: Walk-in closet(s); Ceiling fan(s); Pantry; Crawl space basement
- Laundry & utility: Laundry closet
Neighborhood map
What this means for you Summary
Snapshot
- This is a 3-bed/2.0-bath single-family listed at $149k.
Deal economics
- At list price, monthly cash flow is $230 ($3k/yr) — positive.
- The deal already cash-flows at list — no discount required.
- Meets the 1% rule at list price ($2k rent vs $149k).
- Cap rate 8.1% vs local median 3.8% in Greenville — top-decile yield for the area; either an underpriced asset or a hidden risk that comps aren't pricing in. Stress-test before assuming the spread holds.
Location & tenants
- Location reads 77/100 on livability (#30 in NC, #2,977 nationally) — a middle-class / working-renter tenant base. Strengths: commute A+, cost of living A+, health & safety A+; Watch: crime F, employment F.
- Pitt County Schools (rural): math 41% / reading 44% proficiency, ranked #100 of 178 in NC (top 56%) — families likely to look elsewhere, expect single-tenant / working-renter base with shorter leases.
- Zoned schools: Ridgewood Elementary (math 50% / reading 57%, grade C, #335 of 1,410 statewide, top 24%, 722 students, 47% FRL); A G Cox Middle (math 37% / reading 49%, grade D-, #191 of 475 statewide, top 41%, 865 students, 52% FRL); South Central (math 42% / reading 51%, grade D-, #344 of 535 statewide, top 64%, 1,675 students, 55% FRL) — zoned schools at 51% FRL track the district average.
- Market conditions: Rents rising fast (+5.4%/yr); 350 active listings in the ZIP; 17 comparable units currently listed for rent nearby; rentals at typical pace (median 21d on market — plan ~3-4 weeks tenant-placement turnaround); 1,300 units permitted in Pitt County in 2024 (204 in 5+ unit buildings).
- This rent runs 38% of the median local income ($49k/yr) — at the standard rent-burdened threshold; future hikes will face affordability resistance.
Forward outlook
- Local home prices are declining (-3.0%/yr); year-one equity from $1k of loan paydown is wiped out by about $4k of value loss. Plan a longer hold.
- Pitt County population projected at +22% by 2050 — long-run rental-demand tailwind backs the buy-and-hold thesis.
- At projected returns (-3.0% appreciation + 5.4% rent growth), your $42k cash investment doubles in ~10 years — after that, you're playing with house money.
Negotiation context
- Only 10 days on market — expect competitive offers; lowballing is unlikely to land.
- 6 sale attempts since 16y ago with the ask held roughly flat each time — persistent listings suggest the price (not the market) is what's stuck; bring a comps-based counter.
- Current owner paid $75k; list at $149k implies a 99% gain — meaningful room to come down on a strong offer.
Risks & watch-outs
- Climate carrying-cost: severe wind risk, 80% chance of damaging wind over 30y; extreme-heat days projected 7→16/yr by 2055 (HVAC capex compounding) — expect insurance premiums to compound above CPI over the hold.
Questions for the listing agent
- Built in 1972 — when were the roof, HVAC, electrical panel, plumbing, and water heater last replaced?
- Is there a deadline driving the sale (1031 exchange, divorce, estate, relocation)? That informs how much negotiation room exists.
- Crime grade is F in this area — have there been break-ins, vandalism, or insurance claims at this property in the last 3 years? What carrier currently insures it and at what premium?
- What's the average days-on-market for RENTAL listings here right now (not sales)? A rising rental-DOM trend means longer vacancies and softer asking-rent achievability than the comps imply.
- What's the recent tenant-quality profile in this submarket — average credit score on applications, eviction rate, late-payment / NSF rate, and stable-employment percentage? A property-management company in the area should have these aggregated.
- How much new for-sale + rental construction is in the pipeline within 1–3 miles? Heavy new supply typically softens prices + rents 12–24 months out; constrained supply supports both.
Investment metrics
- 1% rule
- 1.04% ✓
- Cap rate
- 8.14%
- Cash-on-cash
- 6.60%
- DSCR
- 1.29
- GRM
- 8.0
CMA / ARV
- ARV (on-the-fly)
- $261,250
- Comps found
- 10
Show comp detail 10 sales within ~0.75 mi
| Address | Dist | Beds/Ba | Sqft | Sold | Price | $/sf | Match |
|---|---|---|---|---|---|---|---|
| 109 Oakdale Rd | 0.10mi | 3/2.0 | 1,319 (-4%) | 14mo | $200,000 | $152 | 77 |
| 103 Fairwood Ln | 0.02mi | 3/1.5 | 1,311 (-5%) | 24mo | $189,900 | $145 | 70 |
| 1500 Wheaton Ct | 0.58mi | 3/2.0 | 1,410 (+2%) | 6mo | $275,000 | $195 | 63 |
| 1609 Thayer Dr | 0.74mi | 3/2.0 | 1,352 (-2%) | 3mo | $258,000 | $191 | 60 |
| 112 Holliday Ct | 0.04mi | 4/1.5 (+1) | 1,265 (-8%) | 21mo | $179,900 | $142 | 60 |
| 1504 Thayer Dr | 0.64mi | 3/2.0 | 1,375 (0%) | 14mo | $272,000 | $198 | 58 |
| 3504 Sunstone Way Unit D2 | 0.50mi | 3/2.5 | 1,461 (+6%) | 10mo | $234,490 | $160 | 56 |
| 1805 Stone Wood Dr | 0.39mi | 3/2.0 | 1,432 (+4%) | 23mo | $272,000 | $190 | 56 |
| 1512 Thayer Dr | 0.65mi | 3/2.0 | 1,405 (+2%) | 14mo | $275,000 | $196 | 54 |
| 2957 Beunavista Court Ct | 0.54mi | 3/2.0 | 1,463 (+6%) | 17mo | $262,000 | $179 | 50 |
Match score weights: distance 35% · size 25% · config 20% · recency 20%. Top-matched comps best support the ARV.
Projected returns pro-forma
-3.0% appreciation · 5.44% rent growth · sell at horizon
- IRR
- -3.5%
- Equity multiple
- 0.87×
- Total profit
- $-5,625
- Equity at exit
- $22,216
- IRR
- 8.7%
- Equity multiple
- 1.74×
- Total profit
- $30,747
- Equity at exit
- $12,883
Cash invested: $41,720 (down + closing). Projections, not guarantees.
Landlord ↔ Tenant lean methodology
- Overall (STATE)
- 85 Strongly Landlord-Friendly
- State North Carolina
- 85 Strongly Landlord-Friendly · R+3
- County
- — inherits STATE
- City
- — inherits STATE
ZIP-level market 27834
- Rents YoY
- 5.4%
- Active inventory
- 350
- Price-to-rent
- 8.0×
Monthly cashflow live
- Estimated rent
- $1,550 high interval (Pro) →
- Mortgage (P&I)
- −$781
- Tax from tax record
- −$151 /mo · $1,814/yr
- Insurance
- −$62
- HOA
- −$0
- Vacancy / Maint / Mgmt
- −$325
- Net cashflow
- $230
Break-even live
UW: 25.0% down · 7.5% · 30yr · 1.5% tax · 5.0% vac · 8.0% maint · 8.0% mgmt
Financing live
Cash to close
- Down payment
- $37,250
- Closing costs
- $4,470
- Reserves months
- —
- Total cash needed
- —
Loan-product check · same deal, 3 products live
Conventional
25% down · 7.5% · 30yr
- Down + closing
- —
- Monthly P&I
- —
- Monthly cashflow
- —
- DSCR
- —
- Eligible?
- —
Personal DTI + credit; lowest rate.
DSCR
20% down · 8.5% · 30yr
- Down + closing
- —
- Monthly P&I
- —
- Monthly cashflow
- —
- DSCR
- —
- Eligible?
- —
No personal income docs; deal must DSCR.
Hard money
10% down · 12.0% · 12mo
- Down + closing
- —
- Monthly P&I
- —
- Monthly cashflow
- —
- DSCR
- —
- Eligible?
- —
Short-term bridge; refi at stabilization.
Rent comps 17 comps
| Address | Beds | Baths | Sqft | Rent | $/sqft | DOM | Units | Dist |
|---|---|---|---|---|---|---|---|---|
| 203 Shiloh Dr Unit E Greenville, NC | 2.0 | 1.5 | 1000 | $1,130 | $1.13 | 21d | 1 | 0.46mi |
| 1548 Manning Forest Dr Unit M7 Greenville, NC | 2.0 | 1.5 | 1094 | $1,300 | $1.19 | 13d | 1 | 0.51mi |
| 1951 Cambria Dr Unit B Greenville, NC | 3.0 | 3.0 | 1552 | $1,800 | $1.16 | 21d | 1 | 0.86mi |
| 2221 Brookville Dr Unit B Greenville, NC | 3.0 | 2.0 | 1508 | $1,700 | $1.13 | 21d | 1 | 1.00mi |
| 3955 Sterling Pointe Dr Winterville, NC | 2.0 | 1.5 | 1041 | $995 | $0.96 | 21d | 1 | 1.15mi |
| 3917 Sterling Pointe Dr Winterville, NC | 2.0 | 1.5 | 1042 | $1,200 | $1.15 | 21d | 1 | 1.15mi |
| 3979 Sterling Pointe Dr Unit MMM3 Winterville, NC | 2.0 | 2.5 | 1453 | $1,050 | $0.72 | 21d | 1 | 1.16mi |
| 2500 Brookville Dr Greenville, NC | 3.0 | 2.0 | 1423 | $1,800 | $1.26 | 13d | 1 | 1.18mi |
| 2152 Flagstone Ct Greenville, NC | 2.0 | 1.5 | 1044 | $1,150 | $1.10 | 21d | 1 | 1.19mi |
| 4129 Laurel Ridge Dr Greenville, NC | 2.0 | 4.0 | 1050 | $2,500 | $2.38 | 21d | 1 | 1.20mi |
| 4129 Laurel Ridge Dr Unit F Greenville, NC | 2.0 | 3.5 | 1050 | $2,500 | $2.38 | 21d | 1 | 1.20mi |
| 4511 Laurel Ridge Dr Unit B Greenville, NC | 3.0 | 2.5 | 1619 | $1,950 | $1.20 | 21d | 1 | 1.20mi |
| 207 Belvedere Dr Greenville, NC | 3.0 | 2.0 | 1695 | $2,300 | $1.36 | 21d | 1 | 1.22mi |
| 2140 Flagstone Ct Unit J6 Greenville, NC | 2.0 | 1.5 | 1043 | $1,200 | $1.15 | 21d | 1 | 1.25mi |
| 1005 Allen Ridge Dr Greenville, NC | 2.0–3.0 | 2.0 | 1134 | $1,999 | $1.76 | 13d | 13 | 1.32mi |
| 205 South Pointe Dr Unit B Winterville, NC | 3.0 | 2.5 | 1584 | $1,900 | $1.20 | 21d | 1 | 1.38mi |
| 828 Sarah Rebecca Dr Greenville, NC | 3.0 | 2.5 | 1636 | $2,000 | $1.22 | 21d | 1 | 1.48mi |
Listing history 8 events
-
2026-06-19days on market $149,000 Active 10 DOM
-
2026-06-18days on market $149,000 Active 9 DOM
-
2026-06-17days on market $149,000 Active 8 DOM
-
2026-06-16days on market $149,000 Active 7 DOM
-
2026-06-15days on market $149,000 Active 6 DOM
-
2026-06-13days on market $149,000 Active 3 DOM
-
2026-06-10remarks 590-char remark
-
2026-06-10$149,000 Active 1 DOM
ⓘ Source: listings_history table (triggers on properties + properties_extension) + one-shot
backfill from property_details.listing_events for pre-trigger history.
Tax reassessment forecast NC · Resets to sale price
- Current annual tax
- $1,814 · $151/mo
- Projected year-2 tax
- $1,814 · $151/mo
- Expected delta
- $0/yr ($0/mo · 0.0%)
ⓘ Screening estimate from a state-policy table — verify with the county assessor before closing.
Climate risk First Street
- Flood 3/10 Moderate FEMA zone X (unshaded) · 20% chance over 30 yrs
- Wildfire 3/10 Moderate
- Heat 7/10 Severe 7 d/yr ≥106°F today · 16 d/yr by 30 yrs out
- Wind 8/10 Severe 80% chance of damaging wind over 30 yrs
- Air quality 3/10 Moderate 3 unhealthy d/yr today · 3 by 30 yrs out
Nearby sold comps map
Loading sold comps map…
Walkable amenities ~0.75 mi
Loading nearby amenities…
Taxation est. · year 1
- Rental income
- $18,595
- − Mortgage interest
- −$8,346
- − Property taxes
- −$1,814
- − Insurance
- −$745
- − Repairs & maintenance
- −$1,488
- − Management
- −$1,488
- − Depreciation
- −$4,335
- Taxable income
- $380
- Est. tax owed @ 24.0%
- −$91
- After-tax cash flow
- $2,664/yr
For passive investors: Depreciation is non-cash, so a rental often shows a tax loss while cash-flowing — sheltering income. Rental losses are passive: they offset passive income freely, and up to $25,000/yr can offset ordinary (W-2) income if you actively participate and your MAGI is under $100k (phasing out to $0 by $150k); unused losses carry forward. On sale, claimed depreciation is recaptured at up to 25%, and gains may owe capital-gains tax (a 1031 exchange can defer both). Figures are a year-1 estimate at your 24.0% rate — not tax advice; consult a CPA.
Schools (NCES district)
- District
- Pitt County Schools
- NCES district ID
- 3700012
- Math proficiency
- 41% ▬ 0.00%
- Reading proficiency
- 44% ▲ 2.00%
- Median HH income
- $40,631
- Composite
- 35.67/100
- National rank
- #4877
- State rank
- #100 of 178 in NC
Livability — Greenville
- Score
- 77/100
- State rank
- #30
- US rank
- #2977
Category grades
Schools grade is shown separately in the Schools card above.
Census & demographics
- Census place
- Greenville, NC
- County
- Pitt County · 142,592 people
- City population
- 115,121
- Metro
- Greenville, NC
- Population (ZIP)
- 56,347
- Household income
- $48,935
- Rent vs Own
- Severe rent burden
- 3319.0
Population outlook (Pitt County) Hauer SSP2
- Today (2025)
- 194,585 people
- By 2030
- 203,756 · +4.7%
- By 2040
- 220,807 · +13.5%
- By 2050
- 236,614 · +21.6%
- By 2075
- 275,940 · +41.8%
- By 2100
- 300,058 · +54.2%
Race, ethnicity, and origin ACS 2023
- Neighborhood character
- Diverse neighborhood (Simpson 0.59)
- Race & ethnicity
- Black 54% White 33% Hispanic / Latino 8% Two or more races 3% Asian 2%
- Hispanic origin (detail)
- Mexican 7%
- Common ancestry
- Lithuanian 1% Slovak 1% Romanian 1%
- Foreign-born
- 7% · Canada, China
- Languages at home
- 91% English-only · Spanish 6% Other Asian/Pacific 1%
Political lean MEDSL · Pitt
- 2024 margin
- Lean D (+6.0) · D 52.5% · R 46.5% · Other 1.1%
- 2008→2024 swing
- -2.8pp toward R · 2008: 8.8pp · 2024: 6.0pp
- All cycles
- 2024: D+6.0 2020: D+9.4 2016: D+7.4 2012: D+6.7 2008: D+8.8
Not yet ingested
- Civics
- —
Market trends
- HPI YoY
- ▼ -187.99%
- Current HPI
- 190.6869
- Rent YoY
- ▲ 5.44%
- Metro
- Greenville, NC
- State GDP YoY
- ▲ 3.28%
- F500 in state
- 26
Industry mix (Fortune 500 HQ in NC)
| Industry | F500 HQs | Revenue |
|---|---|---|
| Financial Services | 2 | $213B |
|
||
| Retail | 2 | $95B |
|
||
| Industrial Conglomerate | 1 | $38B |
|
||
| Metals / Steel | 1 | $35B |
|
||
| Utilities | 1 | $30B |
|
||
| Industrial Machinery | 1 | $19B |
|
||
Price history
+90.3% since first listed13 events — show timeline
- 2026-06-09 Listed $149,000 Hive MLS
- 2018-07-09 Sold (Public Records) $75,000 Public Records
- 2018-07-09 Sold (MLS) $75,000 Hive MLS
- 2017-10-27 Listed $83,900 Hive MLS
- 2016-05-01 Listing Removed — Hive MLS
- 2015-11-27 Listed $92,900 Hive MLS
- 2015-07-17 Listing Removed — Hive MLS
- 2014-11-10 Listed $98,000 Hive MLS
- 2012-04-01 Listing Removed — Hive MLS
- 2011-05-15 Listed $108,900 Hive MLS
- 2011-02-28 Listing Removed — Hive MLS
- 2010-08-12 Listed $99,000 Hive MLS
- 2000-08-01 Sold (Public Records) $78,300 Public Records
Property tax history
+5.5%/yrLatest (2025): $1,814 · +0.7% YoY. Source: county tax records.
Cash-flow waterfall
monthlySold comps — $/sqft
last 12 mo · ≤1 miLoading sold comps…