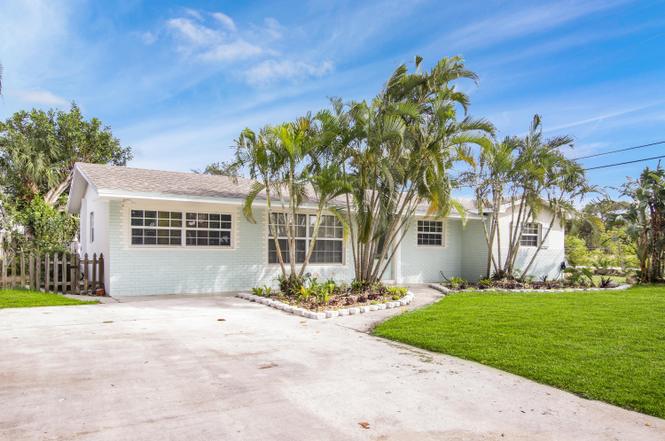
19185 SE Homewood Ave · Tequesta, FL
Flood risk 1/10 · Minimal
- FEMA flood zone
- X (unshaded)
- Chance of flooding over 30 yrs
- 0.0%
- Est. flood insurance / yr
- $507 – $1,088
Fire risk 4/10 · Minor
- Est. fire insurance / yr
- $947 – $1,759
Heat risk 10/10 · Severe
- Hot days now (above 106°F)
- 7 days/yr
- Hot days in 30 yrs
- 25 days/yr
Wind risk 10/10 · Severe
- Chance of severe wind over 30 yrs
- 99.0%
Air-quality risk 2/10 · Minimal
- Unhealthy air days now
- 1 days/yr
- Unhealthy air days in 30 yrs
- 1 days/yr
Risk factors via First Street. Map © Google.
Why this score? — see what drove the D+ grade
The composite is a weighted blend of 9 inputs, each scored 0–100. Each bar is that input's sub-score; the figure is the points it added to the 100-point composite (weight × sub-score).
- Cash flow +12.9/30.0
- ARV discount +12.6/15.0
- Schools +4.5/10.0
- DSCR +3.8/10.0
- Rent growth +3.5/5.0
- 1% rule +3.4/10.0
- Livability +3.1/5.0
- Condition / age +2.5/5.0
- Appreciation +0.0/10.0
$619,000
🖨 Deal sheet 📄 Offer letter ✓ Due diligence
Listing remarks
Welcome to this charming 4-bedroom, 2-bathroom home that perfectly blends comfort and spaciousness. Upon entering, you're greeted by a bright and airy great room that seamlessly connects to the open kitchen and an expansive Florida room, filling the space with natural light and a warm, inviting ambiance. Both the Florida room and the master suite feature sliding glass doors that open to a large patio—an ideal setting for soaking up the sun or hosting memorable outdoor gatherings. Located less than a mile from the intracoastal waterway, this home is a haven for water enthusiasts, offering easy access to prime snorkeling spots and endless aquatic adventures. Nature lovers will appreciat
Key facts
- Florida room
- Large patio
- Great room
Tags
Property features AI
Finance
- Other: Resale property; Living area reported from public records
Exterior
- Parking: Driveway parking; RV access/parking; Total 3 parking spaces
- Utilities: Public water; Public sewer; Three-phase electric; Cable connected
- Home design: Single-family residence; One story
- Construction: Brick, stucco, and CBS construction; Shingle roof
- Exterior features: Open patio; Patio; Shed/outbuilding for storage; Fenced backyard; Fruit trees; Room for a pool; Not waterfront
Interior
- Kitchen: Dishwasher; Electric range; Microwave; Refrigerator
- Bedrooms: 4 bedrooms on the main level
- Flooring: Ceramic tile; Tile; Wood
- Bathrooms: 2 full bathrooms (both on the main level)
- Heating & cooling: Central heating; Central air; Ceiling fans
- Interior features: Split bedroom layout; Entry level living area
- Laundry & utility: Indoor laundry
Neighborhood map
What this means for you Summary
Snapshot
- This is a 4-bed/2.0-bath single-family listed at $619k.
Deal economics
- At list price, monthly cash flow is $-50 ($-602/yr) — negative.
- To cash-flow at today's rent, offer at most $610k (1.4% below list).
- To meet the 1% rule (rent ≥ 1% of price), the offer needs to be $519k (16.2% below list).
- Recommended offer: $519k (16.2% below list) — sets the bar for 1% rule.
- Cap rate 6.2% vs local median 2.5% in Tequesta — top-decile yield for the area; either an underpriced asset or a hidden risk that comps aren't pricing in. Stress-test before assuming the spread holds.
Location & tenants
- Location reads 62/100 on livability (#764 in FL) — a middle-class / working-renter tenant base. Strengths: crime A+, employment A+, housing A; Watch: amenities F, commute F, cost of living F.
- Martin (suburban): math 52% / reading 53% proficiency, ranked #24 of 73 in FL (top 33%) — acceptable for families but not a draw, mixed tenant base, ~2y average lease.
- Zoned schools: Hobe Sound Elementary School (math 51% / reading 48%, grade D, #1,088 of 2,144 statewide, top 53%, 459 students, 68% FRL); Murray Middle School (math 45% / reading 43%, grade D, #327 of 571 statewide, top 57%, 616 students, 69% FRL); South Fork High School (math 36% / reading 48%, grade F, #275 of 667 statewide, top 42%, 1,810 students, 51% FRL) — zoned schools average 63% FRL vs 41% district-wide (22 pts higher); higher-poverty schools than district average — tighter screening recommended.
- Market conditions: Rents rising (+3.9%/yr); 206 active listings in the ZIP; 40 comparable units currently listed for rent nearby; rentals at typical pace (median 24d on market — plan ~3-4 weeks tenant-placement turnaround); solid renter incomes; 737 units permitted in Martin County in 2024 (167 in 5+ unit buildings).
- At $5,188/mo this rent would consume 59% of the median local household income ($106k/yr) (locally 404% of renters already pay >50% of income on rent) — very limited rent-growth headroom before tenants either downsize or default.
Forward outlook
- Local home prices are declining (-3.0%/yr); year-one equity from $4k of loan paydown is wiped out by about $19k of value loss. Plan a longer hold.
- Martin County population projected at +19% by 2050 — long-run rental-demand tailwind backs the buy-and-hold thesis.
Negotiation context
- Only 1 days on market — expect competitive offers; lowballing is unlikely to land.
- 18 sale attempts since 11y ago with the ask held roughly flat each time — persistent listings suggest the price (not the market) is what's stuck; bring a comps-based counter.
Risks & watch-outs
- Climate carrying-cost: severe wind risk, 99% chance of damaging wind over 30y; extreme-heat days projected 7→25/yr by 2055 (HVAC capex compounding) — expect insurance premiums to compound above CPI over the hold.
Questions for the listing agent
- What do current leases actually rent for vs. the listed asking? Can we see a recent rent roll and the last 12 months of T-12 income?
- Built in 1960 — when were the roof, HVAC, electrical panel, plumbing, and water heater last replaced?
- Is there a deadline driving the sale (1031 exchange, divorce, estate, relocation)? That informs how much negotiation room exists.
- Schools are F-rated, which usually means shorter tenancies and higher turnover. Who's the typical renter profile here, and what's been the actual vacancy rate?
- The area grade is low — what's the realistic commute time and amenity access for the typical tenant pool here? Any planned neighborhood developments (good or bad) we should know about?
- What's the average days-on-market for RENTAL listings here right now (not sales)? A rising rental-DOM trend means longer vacancies and softer asking-rent achievability than the comps imply.
- What's the recent tenant-quality profile in this submarket — average credit score on applications, eviction rate, late-payment / NSF rate, and stable-employment percentage? A property-management company in the area should have these aggregated.
- How much new for-sale + rental construction is in the pipeline within 1–3 miles? Heavy new supply typically softens prices + rents 12–24 months out; constrained supply supports both.
Investment metrics
- 1% rule
- 0.84% ✗
- Cap rate
- 6.20%
- Cash-on-cash
- -0.35%
- DSCR
- 0.98
- GRM
- 9.9
CMA / ARV
- ARV (on-the-fly)
- $698,542
- Comps found
- 8
Show comp detail 8 sales within ~0.75 mi
| Address | Dist | Beds/Ba | Sqft | Sold | Price | $/sf | Match |
|---|---|---|---|---|---|---|---|
| 11813 SE Williams Ter | 0.29mi | 4/2.0 | 1,816 (+4%) | 6mo | $535,000 | $295 | 74 |
| 19165 SE Homewood Ave | 0.03mi | 3/2.0 (-1) | 1,553 (-11%) | 4mo | $620,000 | $399 | 72 |
| 18965 SE Southgate Dr | 0.24mi | 4/3.0 | 1,900 (+9%) | 6mo | $799,000 | $421 | 65 |
| 19052 SE Hillcrest Dr | 0.15mi | 3/2.0 (-1) | 1,510 (-13%) | 2mo | $668,500 | $443 | 64 |
| 18942 SE Hillcrest Dr | 0.22mi | 3/2.0 (-1) | 1,572 (-10%) | 6mo | $705,000 | $448 | 63 |
| 11017 SE Harken Ter | 0.65mi | 3/2.0 (-1) | 1,765 (+1%) | 6mo | $700,000 | $397 | 58 |
| 19145 SE Mayo Dr | 0.24mi | 3/2.0 (-1) | 1,496 (-14%) | 6mo | $600,000 | $401 | 55 |
| 10890 SE Linden St | 0.43mi | 3/2.0 (-1) | 1,510 (-13%) | 8mo | $570,000 | $377 | 46 |
Match score weights: distance 35% · size 25% · config 20% · recency 20%. Top-matched comps best support the ARV.
Projected returns pro-forma
-3.0% appreciation · 3.88% rent growth · sell at horizon
- IRR
- -15.9%
- Equity multiple
- 0.43×
- Total profit
- $-98,869
- Equity at exit
- $92,295
- IRR
- -6.1%
- Equity multiple
- 0.59×
- Total profit
- $-70,856
- Equity at exit
- $53,520
Cash invested: $173,320 (down + closing). Projections, not guarantees.
Landlord ↔ Tenant lean methodology
- Overall (STATE)
- 87 Strongly Landlord-Friendly
- State Florida
- 87 Strongly Landlord-Friendly · R+3
- County
- — inherits STATE
- City
- — inherits STATE
ZIP-level market 33469
- Home prices YoY
- -30.4%
- Rents YoY
- 3.9%
- Active inventory
- 206
- Price-to-rent
- 9.9×
Monthly cashflow live
- Estimated rent
- $5,188 high interval (Pro) →
- Mortgage (P&I)
- −$3,246
- Tax from tax record
- −$645 /mo · $7,739/yr
- Insurance
- −$258
- HOA
- −$0
- Vacancy / Maint / Mgmt
- −$1,090
- Net cashflow
- $-50
Break-even live
UW: 25.0% down · 7.5% · 30yr · 1.5% tax · 5.0% vac · 8.0% maint · 8.0% mgmt
Financing live
Cash to close
- Down payment
- $154,750
- Closing costs
- $18,570
- Reserves months
- —
- Total cash needed
- —
Loan-product check · same deal, 3 products live
Conventional
25% down · 7.5% · 30yr
- Down + closing
- —
- Monthly P&I
- —
- Monthly cashflow
- —
- DSCR
- —
- Eligible?
- —
Personal DTI + credit; lowest rate.
DSCR
20% down · 8.5% · 30yr
- Down + closing
- —
- Monthly P&I
- —
- Monthly cashflow
- —
- DSCR
- —
- Eligible?
- —
No personal income docs; deal must DSCR.
Hard money
10% down · 12.0% · 12mo
- Down + closing
- —
- Monthly P&I
- —
- Monthly cashflow
- —
- DSCR
- —
- Eligible?
- —
Short-term bridge; refi at stabilization.
Rent comps 40 comps
| Address | Beds | Baths | Sqft | Rent | $/sqft | DOM | Units | Dist |
|---|---|---|---|---|---|---|---|---|
| 19185 SE Homewood Ave Jupiter, FL | 4.0 | 2.0 | 1742 | $3,850 | $2.21 | 23d | 1 | 0.01mi |
| 19165 SE Homewood Ave Jupiter, FL | 3.0 | 2.0 | 1553 | $7,500 | $4.83 | 23d | 1 | 0.02mi |
| 4153 Wingo St Jupiter, FL | 4.0 | 2.0 | 1561 | $4,750 | $3.04 | 24d | 1 | 0.37mi |
| 52 Birch Pl Jupiter, FL | 3.0 | 2.0 | 1766 | $6,500 | $3.68 | 3d | 1 | 0.38mi |
| 85 Hickory Hill Rd Jupiter, FL | 3.0 | 2.0 | 1892 | $6,350 | $3.36 | 24d | 1 | 0.45mi |
| 65 PineHill Trl E Tequesta, FL | 3.0 | 2.0 | 2017 | $4,295 | $2.13 | 7d | 1 | 0.52mi |
| 52 Pinehill Trl E Jupiter, FL | 4.0 | 2.0 | 1903 | $9,500 | $4.99 | 24d | 1 | 0.58mi |
| 16 Leeward Cir Jupiter, FL | 3.0 | 3.0 | 1871 | $11,500 | $6.15 | 24d | 1 | 0.63mi |
| 3770 County Line Rd Tequesta, FL | 3.0–4.0 | 2.5–3.0 | 1947 | $5,500 | $2.82 | 24d | 2 | 0.72mi |
| 3770 County Line Rd Tequesta, FL | 3.0–4.0 | 2.5–3.0 | 1965 | $5,500 | $2.80 | 2d | 2 | 0.72mi |
| 3770 County Line Rd Unit A1 Jupiter, FL | 4.0 | 3.0 | 2198 | $5,500 | $2.50 | 15d | 1 | 0.72mi |
| 143 Country Club Dr Jupiter, FL | 3.0 | 2.0 | 2000 | $5,850 | $2.92 | 24d | 1 | 0.73mi |
| 284 Village Blvd Tequesta, FL | 1.0–3.0 | 1.0–2.0 | 1087 | $3,200 | $2.94 | 10d | 2 | 0.79mi |
| 284 Village Blvd Tequesta, FL | 1.0–3.0 | 1.0–2.0 | 1087 | $3,200 | $2.94 | 24d | 3 | 0.79mi |
| 284 Village Blvd Tequesta, FL | 2.0–3.0 | 2.0 | 1182 | $3,200 | $2.71 | 11d | 2 | 0.79mi |
| 284 Village Blvd #9112 Tequesta, FL | 3.0 | 2.0 | 1374 | $3,200 | $2.33 | 5d | 1 | 0.80mi |
| 523 Dover Rd Unit NA Jupiter, FL | 3.0 | 2.0 | 1981 | $4,495 | $2.27 | 24d | 1 | 0.82mi |
| 391 W Riverside Dr Jupiter, FL | 4.0 | 4.0 | 1770 | $14,000 | $7.91 | 5d | 1 | 0.84mi |
| 236 Village Blvd Tequesta, FL | 3.0 | 2.0 | 1152 | $2,700 | $2.34 | 2d | 1 | 0.88mi |
| 266 Village Blvd Tequesta, FL | 2.0–3.0 | 2.0 | 1287 | $3,000 | $2.33 | 24d | 2 | 0.88mi |
| 266 Village Blvd #6102 Tequesta, FL | 3.0 | 2.0 | 1374 | $3,000 | $2.18 | 2d | 1 | 0.89mi |
| 6 Concourse Dr Unit A Jupiter, FL | 3.0 | 2.0 | 1600 | $3,500 | $2.19 | 23d | 1 | 0.91mi |
| 466 Tequesta Dr Jupiter, FL | 3.0 | 2.0 | 1383 | $3,500 | $2.53 | 24d | 1 | 0.91mi |
| 152 Village Blvd Unit H Tequesta, FL | 3.0 | 2.0 | 1417 | $3,150 | $2.22 | 3d | 1 | 0.94mi |
| 158 Village Blvd Unit D Tequesta, FL | 3.0 | 2.5 | 1776 | $3,000 | $1.69 | 24d | 1 | 1.00mi |
| 1 Bunker Pl Jupiter, FL | 3.0 | 2.0 | 2035 | $7,750 | $3.81 | 5d | 1 | 1.02mi |
| 76 Fairview W Jupiter, FL | 3.0 | 2.5 | 1776 | $7,500 | $4.22 | 24d | 1 | 1.03mi |
| 19800 Sandpointe Bay Dr Tequesta, FL | 3.0 | 2.5 | 2075 | $9,500 | $4.58 | 24d | 2 | 1.03mi |
| 19800 Sandpointe Bay Dr Tequesta, FL | 2.0–3.0 | 2.5 | 1857 | $11,000 | $5.92 | 22d | 3 | 1.03mi |
| 104 Lighthouse Cir Unit H-2 Tequesta, FL | 3.0 | 2.0 | 1356 | $2,600 | $1.92 | 24d | 1 | 1.07mi |
| 106 Lighthouse Cir Unit G Jupiter, FL | 3.0 | 2.5 | 1684 | $2,500 | $1.48 | 24d | 1 | 1.10mi |
| 3 Oakland Ct Jupiter, FL | 3.0 | 2.5 | 1298 | $4,800 | $3.70 | 24d | 1 | 1.11mi |
| 356 Mars Ave Jupiter, FL | 3.0 | 3.0 | 1602 | $5,500 | $3.43 | 24d | 1 | 1.12mi |
| 112 Lighthouse Cir Unit G Jupiter, FL | 3.0 | 2.5 | 1776 | $3,500 | $1.97 | 24d | 1 | 1.12mi |
| 58 Tall Oaks Cir Jupiter, FL | 3.0 | 2.5 | 1298 | $3,900 | $3.00 | 24d | 1 | 1.13mi |
| 1511 Seabrook Rd Jupiter, FL | 3.0 | 2.0 | 1820 | $4,200 | $2.31 | 5d | 1 | 1.27mi |
| 1511 Seabrook Rd Jupiter, FL | 3.0 | 2.0 | 1820 | $4,200 | $2.31 | 15d | 1 | 1.27mi |
| 9 W Riverside Dr Jupiter, FL | 4.0 | 2.0 | 1649 | $10,900 | $6.61 | 24d | 1 | 1.36mi |
| 22 Van Rd Jupiter, FL | 4.0 | 3.0 | 1260 | $6,000 | $4.76 | 24d | 1 | 1.44mi |
| 72 Waterway Rd Jupiter, FL | 3.0 | 2.0 | 2018 | $15,000 | $7.43 | 24d | 1 | 1.47mi |
Listing history 2 events
-
2026-06-17remarks 693-char remark
-
2026-06-17$619,000 Active 1 DOM
ⓘ Source: listings_history table (triggers on properties + properties_extension) + one-shot
backfill from property_details.listing_events for pre-trigger history.
Tax reassessment forecast FL · Resets to sale price
- Current annual tax
- $7,739 · $645/mo
- Projected year-2 tax
- $7,739 · $645/mo
- Expected delta
- $0/yr ($0/mo · 0.0%)
ⓘ Screening estimate from a state-policy table — verify with the county assessor before closing.
Climate risk First Street
- Flood 1/10 Low FEMA zone X (unshaded) · 0% chance over 30 yrs
- Wildfire 4/10 Moderate
- Heat 10/10 Extreme 7 d/yr ≥106°F today · 25 d/yr by 30 yrs out
- Wind 10/10 Extreme 99% chance of damaging wind over 30 yrs
- Air quality 2/10 Low 1 unhealthy d/yr today · 1 by 30 yrs out
Nearby sold comps map
Loading sold comps map…
Walkable amenities ~0.75 mi
Loading nearby amenities…
Taxation est. · year 1
- Rental income
- $62,259
- − Mortgage interest
- −$34,674
- − Property taxes
- −$7,739
- − Insurance
- −$3,095
- − Repairs & maintenance
- −$4,981
- − Management
- −$4,981
- − Depreciation
- −$18,007
- Taxable loss
- −$11,217
- Est. tax savings @ 24.0%
- +$2,692
- After-tax cash flow
- $2,090/yr
For passive investors: Depreciation is non-cash, so a rental often shows a tax loss while cash-flowing — sheltering income. Rental losses are passive: they offset passive income freely, and up to $25,000/yr can offset ordinary (W-2) income if you actively participate and your MAGI is under $100k (phasing out to $0 by $150k); unused losses carry forward. On sale, claimed depreciation is recaptured at up to 25%, and gains may owe capital-gains tax (a 1031 exchange can defer both). Figures are a year-1 estimate at your 24.0% rate — not tax advice; consult a CPA.
Schools (NCES district)
- District
- Martin
- NCES district ID
- 1201290
- Math proficiency
- 52% ▼ -14.00%
- Reading proficiency
- 53% ▼ -4.00%
- Median HH income
- $52,482
- Composite
- 45.1/100
- National rank
- #2690
- State rank
- #24 of 73 in FL
Livability — Tequesta
- Score
- 62/100
- State rank
- #764
- US rank
- #16907
Category grades
Schools grade is shown separately in the Schools card above.
Census & demographics
- County
- Martin County · 165,223 people
- City population
- 14,686
- Metro
- Port St. Lucie, FL
- Population (ZIP)
- 14,686
- Household income
- $106,265
- Rent vs Own
- Severe rent burden
- 404.0
Population outlook (Martin County) Hauer SSP2
- Today (2025)
- 172,383 people
- By 2030
- 180,192 · +4.5%
- By 2040
- 194,114 · +12.6%
- By 2050
- 204,992 · +18.9%
- By 2075
- 229,641 · +33.2%
- By 2100
- 232,146 · +34.7%
Race, ethnicity, and origin ACS 2023
- Neighborhood character
- Predominantly White (87%)
- Race & ethnicity
- White 87% Hispanic / Latino 9% Two or more races 7% Asian 1%
- Hispanic origin (detail)
- Puerto Rican 2% Cuban 3%
- Common ancestry
- Lithuanian 6% Slovak 4% Romanian 3%
- Foreign-born
- 7% · Canada, China
- Languages at home
- 90% English-only · Spanish 5% Other Indo-European 3% Russian/Polish/Slavic 1%
Political lean MEDSL · Martin
- 2024 margin
- Solid R (+31.1) · D 34.1% · R 65.2%
- 2008→2024 swing
- -17.5pp toward R · 2008: -13.6pp · 2024: -31.1pp
- All cycles
- 2024: R+31.1 2020: R+24.6 2016: R+26.9 2012: R+22.9 2008: R+13.6
Not yet ingested
- Civics
- —
Market trends
- HPI YoY
- ▼ -183.36%
- Current HPI
- 419.948
- Rent YoY
- ▲ 3.88%
- Metro
- Port St. Lucie, FL
- State GDP YoY
- ▲ 3.28%
- F500 in state
- 36
Industry mix (Fortune 500 HQ in FL)
| Industry | F500 HQs | Revenue |
|---|---|---|
| Industrial Technology | 2 | $29B |
|
||
| Insurance | 2 | $17B |
|
||
| Retail | 1 | $60B |
|
||
| Technology Distribution | 1 | $58B |
|
||
| Homebuilding | 1 | $35B |
|
||
| Technology Manufacturing | 1 | $35B |
|
||
Price history
+797.1% since first listed52 events — show timeline
- 2026-06-16 Listed $619,000 Beaches MLS
- 2026-03-26 Listed for Rent $3,850 RMLSFL
- 2025-05-02 Rental Removed $4,000 APPFOLIO
- 2025-04-30 Listing Removed — Beaches MLS
- 2025-04-29 Listed for Rent $4,000 APPFOLIO
- 2025-04-28 Rental Removed $4,000 RMLSFL
- 2025-03-28 Listed for Rent $4,000 RMLSFL
- 2025-03-27 Listed $619,500 Beaches MLS
- 2024-11-13 Listing Removed — Beaches MLS
- 2024-11-13 Rental Removed $3,700 RMLSFL
- 2024-09-03 Price Changed $3,700 RMLSFL
- 2024-08-09 Listed for Rent $4,000 RMLSFL
- 2024-08-09 Relisted — Beaches MLS
- 2024-05-28 Rental Removed $4,000 RMLSFL
- 2024-05-28 Listing Removed — Beaches MLS
- 2024-04-26 Listed for Rent $4,000 RMLSFL
- 2024-04-26 Listing Removed — Beaches MLS
- 2024-04-26 Listed $629,500 Beaches MLS
- 2024-02-27 Rental Removed $4,000 GFLMLS
- 2023-11-18 Listed for Rent $4,000 GFLMLS
- 2023-10-26 Listed $629,500 Beaches MLS
- 2022-09-19 Sold (Public Records) $552,000 Public Records
- 2022-09-16 Sold (MLS) $552,000 Beaches MLS
- 2022-09-08 Pending — Beaches MLS
- 2022-09-05 Price Changed $575,000 Beaches MLS
- 2022-09-04 Relisted — Beaches MLS
- 2022-08-15 Contingent — Beaches MLS
- 2022-08-08 Price Changed $585,000 Beaches MLS
- 2022-07-12 Price Changed $598,000 Beaches MLS
- 2022-07-12 Relisted — Beaches MLS
- 2022-06-25 Pending — Beaches MLS
- 2022-06-17 Price Changed $600,000 Beaches MLS
- 2022-06-01 Price Changed $640,000 Beaches MLS
- 2022-05-13 Listed $650,000 Beaches MLS
- 2016-01-21 Sold (Public Records) $299,000 Public Records
- 2016-01-19 Sold (MLS) $299,000 Beaches MLS
- 2015-12-03 Pending — Beaches MLS
- 2015-11-30 Listed $299,000 Beaches MLS
- 2015-10-30 Pending — Beaches MLS
- 2015-10-29 Listing Removed — Beaches MLS
- 2015-10-23 Price Changed $319,900 Beaches MLS
- 2015-10-09 Price Changed $339,500 Beaches MLS
- 2015-10-02 Listed $352,000 Beaches MLS
- 2015-07-22 Sold (MLS) $178,000 Beaches MLS
- 2015-06-16 Contingent — Beaches MLS
- 2015-06-02 Price Changed $185,500 Beaches MLS
- 2015-05-11 Relisted — Beaches MLS
- 2015-03-31 Contingent — Beaches MLS
- 2015-03-16 Price Changed $189,500 Beaches MLS
- 2015-02-13 Listed $199,500 Beaches MLS
- 2005-12-06 Sold (Public Records) $100,000 Public Records
- 1987-06-30 Sold (Public Records) $69,000 Public Records
Property tax history
+11.7%/yrLatest (2025): $7,739 · +1.4% YoY. Source: county tax records.
Cash-flow waterfall
monthlySold comps — $/sqft
last 12 mo · ≤1 miLoading sold comps…