 🏗️ New Construction
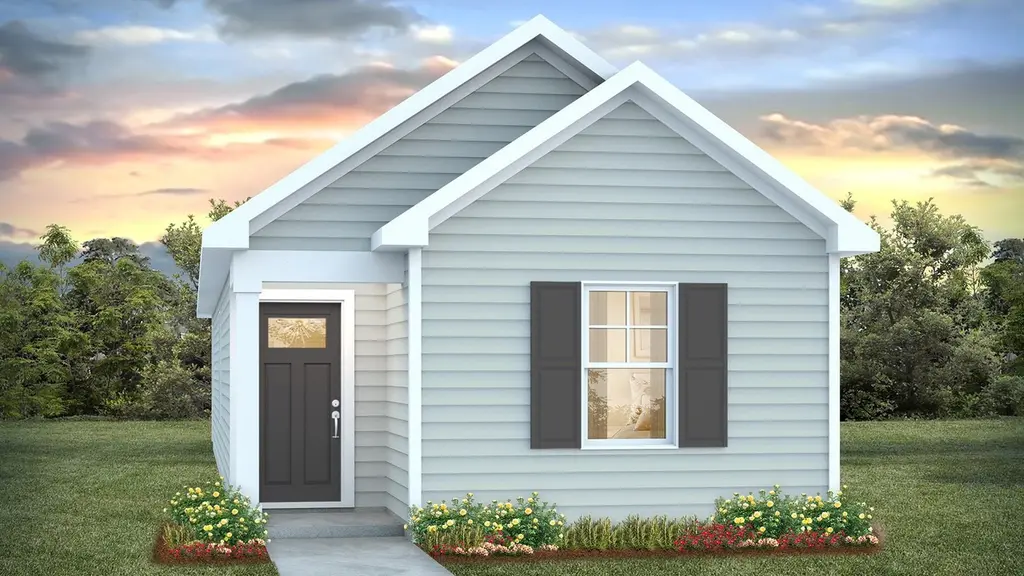
FAIRHAVEN Plan · Holden Beach, NC
Flood risk No data
- FEMA flood zone
- —
- Chance of flooding over 30 yrs
- —
- Est. flood insurance / yr
- —
Fire risk No data
- Est. fire insurance / yr
- —
Heat risk No data
- Hot days now (above threshold)
- —
- Hot days in 30 yrs
- —
Wind risk No data
- Chance of severe wind over 30 yrs
- —
Air-quality risk No data
- Unhealthy air days now
- —
- Unhealthy air days in 30 yrs
- —
Risk factors via First Street. Map © Google.
Why this score? — see what drove the B grade
The composite is a weighted blend of 9 inputs, each scored 0–100. Each bar is that input's sub-score; the figure is the points it added to the 100-point composite (weight × sub-score).
- Cash flow +30.0/30.0
- DSCR +10.0/10.0
- 1% rule +9.8/10.0
- ARV discount +7.5/15.0
- Condition / age +4.0/5.0
- Schools +3.9/10.0
- Livability +3.2/5.0
- Rent growth +2.5/5.0
- Appreciation +0.0/10.0
$201,490
🖨 Deal sheet (PDF) 📄 Offer letter ✓ Due diligence
Listing remarks
Discover the Fairhaven, a 3-bedroom, 2-bath new construction home with 1,130 square feet of functional living space. This single-story layout showcases an open living and dining area, efficient kitchen, private primary suite, and covered patio designed for low-maintenance living. * The photos you see here are for illustration purposes only, interior and exterior features, options, colors and selections will differ.
Key facts
- New construction
- Efficient kitchen
- Covered patio
Tags
Property features AI
Finance
- Other: Status: Active; Inventory type: Plan
- Financial info: List price $201,490
Exterior
- Home design: Single-family plan home in Supply, NC; Address shown as FAIRHAVEN Plan, Supply NC 28462
- Exterior features: Living area approximately 1,130
Interior
- Bedrooms: 3 bedrooms
- Bathrooms: 2 bathrooms (full)
- Interior features: Plan: FAIRHAVEN (new construction plan)
Neighborhood map
What this means for you Summary
Snapshot
- This is a 3-bed/2.0-bath single-family listed at $201k. Condition is rated good.
Deal economics
- At list price, monthly cash flow is $657 ($8k/yr) — positive.
- The deal already cash-flows at list — no discount required.
- Meets the 1% rule at list price ($2k rent vs $201k).
- Recommended offer: $195k (3.0% below list) — sets the bar for market timing.
- Cap rate 12.1% vs local median 3.1% in Holden Beach — top-decile yield for the area; either an underpriced asset or a hidden risk that comps aren't pricing in. Stress-test before assuming the spread holds.
Location & tenants
- Location reads 65/100 on livability (#334 in NC) — a middle-class / working-renter tenant base. Strengths: employment A+, crime A, housing A; Watch: schools C-, cost of living D, health & safety D.
- Brunswick County Schools (rural): math 45% / reading 47% proficiency, ranked #82 of 178 in NC (top 46%) — families likely to look elsewhere, expect single-tenant / working-renter base with shorter leases.
- Market conditions: 506 active listings in the ZIP; 6,112 units permitted in Brunswick County in 2024 (990 in 5+ unit buildings).
- This rent runs 40% of the median local income ($60k/yr) — at the standard rent-burdened threshold; future hikes will face affordability resistance.
Forward outlook
- Local home prices are declining (-3.0%/yr); year-one equity from $946 of loan paydown is wiped out by about $4k of value loss. Plan a longer hold.
- Brunswick County population projected at +36% by 2050 — long-run rental-demand tailwind backs the buy-and-hold thesis.
- At projected returns (-3.0% appreciation + 3.0% rent growth), your $38k cash investment doubles in ~6 years — after that, you're playing with house money.
Negotiation context
- It's been on market 51 days — a 3% lower offer ($195k) is reasonable based on typical stale-listing flexibility.
Questions for the listing agent
- It's been on market 51 days. Have you received any prior offers? Is the seller open to a 3% concession, seller financing, or rate buy-down credit?
- Is there a deadline driving the sale (1031 exchange, divorce, estate, relocation)? That informs how much negotiation room exists.
- What's the average days-on-market for RENTAL listings here right now (not sales)? A rising rental-DOM trend means longer vacancies and softer asking-rent achievability than the comps imply.
- What's the recent tenant-quality profile in this submarket — average credit score on applications, eviction rate, late-payment / NSF rate, and stable-employment percentage? A property-management company in the area should have these aggregated.
- How much new for-sale + rental construction is in the pipeline within 1–3 miles? Heavy new supply typically softens prices + rents 12–24 months out; constrained supply supports both.
Investment metrics
- 1% rule
- 1.48% ✓
- Cap rate
- 12.06%
- Cash-on-cash
- 20.59%
- DSCR
- 1.92
- GRM
- 5.6
CMA / ARV
- ARV (on-the-fly)
- $136,730
- Comps found
- 1
Show comp detail 1 sale within ~0.75 mi
| Address | Dist | Beds/Ba | Sqft | Sold | Price | $/sf | Match |
|---|---|---|---|---|---|---|---|
| 1811 Pintail Ave SW | 0.61mi | 3/2.0 | 1,128 (-0%) | 10mo | $137,000 | $121 | 63 |
Match score weights: distance 35% · size 25% · config 20% · recency 20%. Top-matched comps best support the ARV.
Projected returns pro-forma
-3.0% appreciation · 3.0% rent growth · sell at horizon
- IRR
- 12.9%
- Equity multiple
- 1.51×
- Total profit
- $19,716
- Equity at exit
- $20,387
- IRR
- 21.8%
- Equity multiple
- 2.86×
- Total profit
- $71,171
- Equity at exit
- $11,822
Cash invested: $38,284 (down + closing). Projections, not guarantees.
Landlord ↔ Tenant lean methodology
- Overall (STATE)
- 85 Strongly Landlord-Friendly
- State North Carolina
- 85 Strongly Landlord-Friendly · R+3
- County
- — inherits STATE
- City
- — inherits STATE
ZIP-level market 28462
- Active inventory
- 506
- Price-to-rent
- 8.3×
Monthly cashflow live
- Estimated rent
- $2,028 medium interval (Pro) →
- Mortgage (P&I)
- −$717
- Tax est. 1.5%
- −$171 /mo · $2,051/yr
- Insurance
- −$57
- HOA
- −$0
- Vacancy / Maint / Mgmt
- −$426
- Net cashflow
- $657
Break-even live
Sensitivity live
| Price | -10% $751 | -5% $704 | +0% $657 | +5% $610 | +10% $562 |
|---|---|---|---|---|---|
| Rent | -10% $497 | -5% $577 | +0% $657 | +5% $737 | +10% $817 |
| Rate | -1.0pp $726 | -0.5pp $692 | base $657 | +0.5pp $622 | +1.0pp $585 |
UW: 25.0% down · 7.5% · 30yr · 1.5% tax · 5.0% vac · 8.0% maint · 8.0% mgmt
Financing live
Cash to close
- Down payment
- $34,182
- Closing costs
- $4,102
- Reserves months
- —
- Total cash needed
- —
Loan-product check · same deal, 3 products live
Conventional
25% down · 7.5% · 30yr
- Down + closing
- —
- Monthly P&I
- —
- Monthly cashflow
- —
- DSCR
- —
- Eligible?
- —
Personal DTI + credit; lowest rate.
DSCR
20% down · 8.5% · 30yr
- Down + closing
- —
- Monthly P&I
- —
- Monthly cashflow
- —
- DSCR
- —
- Eligible?
- —
No personal income docs; deal must DSCR.
Hard money
10% down · 12.0% · 12mo
- Down + closing
- —
- Monthly P&I
- —
- Monthly cashflow
- —
- DSCR
- —
- Eligible?
- —
Short-term bridge; refi at stabilization.
Listing history 16 events
-
2026-06-18days on market $201,490 Active 51 DOM
-
2026-06-17days on market $201,490 Active 50 DOM
-
2026-06-16days on market $201,490 Active 49 DOM
-
2026-06-15days on market $201,490 Active 48 DOM
-
2026-06-14days on market $201,490 Active 46 DOM
-
2026-06-13days on market $201,490 Active 45 DOM
-
2026-06-10days on market $201,490 Active 43 DOM
-
2026-06-09days on market $201,490 Active 42 DOM
-
2026-06-08days on market $201,490 Active 41 DOM
-
2026-06-07days on market $201,490 Active 40 DOM
-
2026-06-05days on market $201,490 Active 37 DOM
-
2026-06-03days on market $201,490 Active 36 DOM
-
2026-06-02days on market $201,490 Active 35 DOM
-
2026-06-01days on market $201,490 Active 34 DOM
-
2026-05-31days on market $201,490 Active 33 DOM
-
2026-05-30days on market $201,490 Active 32 DOM
ⓘ Source: listings_history table (triggers on properties + properties_extension) + one-shot
backfill from property_details.listing_events for pre-trigger history.
Nearby sold comps map
Loading sold comps map…
Walkable amenities ~0.75 mi
Loading nearby amenities…
Taxation est. · year 1
- Rental income
- $24,332
- − Mortgage interest
- −$7,659
- − Property taxes
- −$2,051
- − Insurance
- −$684
- − Repairs & maintenance
- −$1,947
- − Management
- −$1,947
- − Depreciation
- −$3,978
- Taxable income
- $6,068
- Est. tax owed @ 24.0%
- −$1,456
- After-tax cash flow
- $6,427/yr
For passive investors: Depreciation is non-cash, so a rental often shows a tax loss while cash-flowing — sheltering income. Rental losses are passive: they offset passive income freely, and up to $25,000/yr can offset ordinary (W-2) income if you actively participate and your MAGI is under $100k (phasing out to $0 by $150k); unused losses carry forward. On sale, claimed depreciation is recaptured at up to 25%, and gains may owe capital-gains tax (a 1031 exchange can defer both). Figures are a year-1 estimate at your 24.0% rate — not tax advice; consult a CPA.
Condition & rehab AI · 6 photos
This Fairhaven model is in excellent condition with no visible repairs needed. It offers a good ROI with minor updates to enhance curb appeal and interior aesthetics.
Value-add opportunities
- Both Painting exterior siding — Enhances curb appeal and value
- Both Landscaping improvements — Enhances curb appeal and value
- Both Interior touch-ups — Enhances interior appearance and value
Renovation cost estimate screening
Value-add ROI direction
- Both Painting exterior siding — Enhances curb appeal and value ↑
- Both Landscaping improvements — Enhances curb appeal and value ↑
- Both Interior touch-ups — Enhances interior appearance and value ↑
ⓘ Cost ranges are severity-bucket heuristics (US national rule-of-thumb). Get contractor quotes + a written scope before underwriting a rehab budget.
Schools (NCES district)
- District
- Brunswick County Schools
- NCES district ID
- 3700420
- Math proficiency
- 45% ▲ 4.00%
- Reading proficiency
- 47% ▲ 4.00%
- Median HH income
- $47,494
- Composite
- 39.23/100
- National rank
- #4011
- State rank
- #82 of 178 in NC
Livability — Holden Beach
- Score
- 65/100
- State rank
- #334
- US rank
- #13586
Category grades
Schools grade is shown separately in the Schools card above.
Census & demographics
- County
- Brunswick County · 131,536 people
- Metro
- Myrtle Beach-Conway-North Myrtle Beach, SC-NC
- Population (ZIP)
- 12,340
- Household income
- $60,349
- Rent vs Own
- Severe rent burden
- 269.0
Population outlook (Brunswick County) Hauer SSP2
- Today (2025)
- 152,111 people
- By 2030
- 165,705 · +8.9%
- By 2040
- 188,494 · +23.9%
- By 2050
- 206,228 · +35.6%
- By 2075
- 237,876 · +56.4%
- By 2100
- 251,451 · +65.3%
Race, ethnicity, and origin ACS 2023
- Neighborhood character
- Predominantly White (87%)
- Race & ethnicity
- White 87% Black 7% Two or more races 5% Hispanic / Latino 2%
- Common ancestry
- Slovak 4% Lithuanian 4% Serbian 2%
- Foreign-born
- 1% · Canada
- Languages at home
- 99% English-only · Spanish 1%
Political lean MEDSL · Brunswick
- 2024 margin
- Strong R (+24.9) · D 37.2% · R 62.0%
- 2008→2024 swing
- -6.9pp toward R · 2008: -17.9pp · 2024: -24.9pp
- All cycles
- 2024: R+24.9 2020: R+25.0 2016: R+28.7 2012: R+22.2 2008: R+17.9
Not yet ingested
- Civics
- —
Market trends
- HPI YoY
- ▼ -259.44%
- Current HPI
- 144.2462
- Rent YoY
- —
- Metro
- Myrtle Beach-Conway-North Myrtle Beach, SC-NC
- State GDP YoY
- ▲ 3.28%
- F500 in state
- 26
Industry mix (Fortune 500 HQ in NC)
| Industry | F500 HQs | Revenue |
|---|---|---|
| Financial Services | 2 | $213B |
|
||
| Retail | 2 | $95B |
|
||
| Industrial Conglomerate | 1 | $38B |
|
||
| Metals / Steel | 1 | $35B |
|
||
| Utilities | 1 | $30B |
|
||
| Industrial Machinery | 1 | $19B |
|
||
Cash-flow waterfall
monthlySold comps — $/sqft
last 12 mo · ≤1 miLoading sold comps…