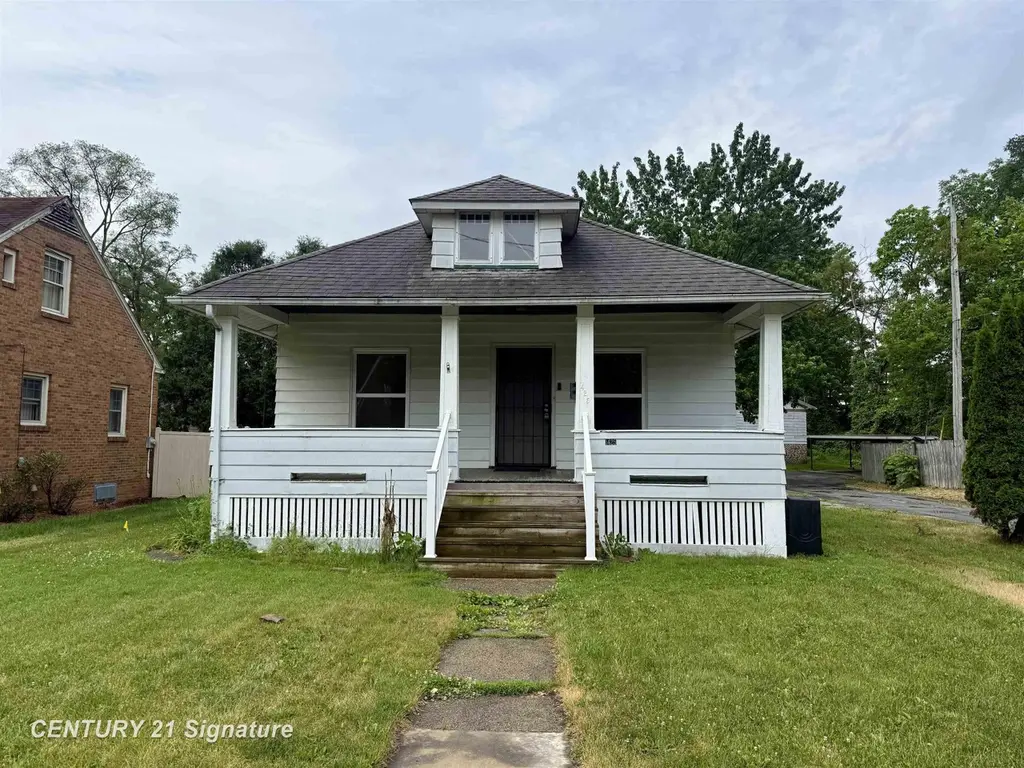
1425 Stephens St · Saginaw, MI
Flood risk 3/10 · Minor
- FEMA flood zone
- X (unshaded)
- Chance of flooding over 30 yrs
- 0.2%
- Est. flood insurance / yr
- $473 – $860
Fire risk 1/10 · Minimal
- Est. fire insurance / yr
- $784 – $1,456
Heat risk 2/10 · Minimal
- Hot days now (above 99°F)
- 7 days/yr
- Hot days in 30 yrs
- 14 days/yr
Wind risk 1/10 · Minimal
- Chance of severe wind over 30 yrs
- —
Air-quality risk 2/10 · Minimal
- Unhealthy air days now
- 1 days/yr
- Unhealthy air days in 30 yrs
- 2 days/yr
Risk factors via First Street. Map © Google.
Why this score? — see what drove the B+ grade
The composite is a weighted blend of 9 inputs, each scored 0–100. Each bar is that input's sub-score; the figure is the points it added to the 100-point composite (weight × sub-score).
- Cash flow +30.0/30.0
- ARV discount +15.0/15.0
- 1% rule +10.0/10.0
- DSCR +10.0/10.0
- Rent growth +3.5/5.0
- Livability +3.2/5.0
- Condition / age +2.5/5.0
- Schools +2.0/10.0
- Appreciation +0.0/10.0
$59,900
🖨 Deal sheet (PDF) 📄 Offer letter ✓ Due diligence
Listing remarks MLS
2 bedroom bungalow ready for new owners in Saginaw! This property is just under 1000 square feet with 2 bedrooms, and a Jack and Jill full bathroom, large kitchen open to the dining room with gorgeous wood flooring, and a spacious kitchen. Below is a full basement with plenty of space for storage. Relax and enjoy the summer from the front porch. Call for your private showing today!
Key facts
- Front porch
- Large kitchen
- Full basement
Tags
Property features AI
Finance
- Other: Listing broker: Century 21 Signature Realty
- HOA & community: Homeowners association present
Exterior
- Utilities: Public water; Public sewer
- Home design: Single-family residence; One story; Residential zoning; Subdivision: SAGINAW; Cross streets: S Bates & Woodbridge
- Construction: Vinyl siding; Block foundation; Built with above-grade finished living area of 902 (square feet)
- Exterior features: Fenced yard; Paved, publicly maintained road
Interior
- Kitchen: Oven; Range
- Bedrooms: Total of 5 rooms (bedrooms included)
- Bathrooms: 1 full bathroom
- Heating & cooling: Forced air heating (natural gas); No central cooling
- Interior features: Gas water heater; Full, unfinished block basement
- Laundry & utility: Washer; Dryer
Neighborhood map
What this means for you Summary
Snapshot
- This is a 2-bed/1.0-bath single-family listed at $60k.
Deal economics
- At list price, monthly cash flow is $279 ($3k/yr) — positive.
- The deal already cash-flows at list — no discount required.
- Meets the 1% rule at list price ($903 rent vs $60k).
- Cap rate 11.9% vs local median 8.3% in Saginaw — top-decile yield for the area; either an underpriced asset or a hidden risk that comps aren't pricing in. Stress-test before assuming the spread holds.
Location & tenants
- Location reads 63/100 on livability (#521 in MI) — a middle-class / working-renter tenant base. Strengths: cost of living A+, housing A+, health & safety A+; Watch: schools F, crime F, amenities F.
- Saginaw School District (urban): math 20% / reading 29% proficiency, ranked #444 of 540 in MI (top 82%) — low school quality limits family demand, transient renter base, plan for 1-2y turnover; 76% free/reduced lunch — lower-income household profile, screen leases tightly.
- Market conditions: Rents rising (+4.0%/yr); 250 active listings in the ZIP; 2 comparable units currently listed for rent nearby; 154 units permitted in Saginaw County in 2024 (0 in 5+ unit buildings).
Forward outlook
- Local home prices are declining (-3.0%/yr); year-one equity from $414 of loan paydown is wiped out by about $2k of value loss. Plan a longer hold.
- Saginaw County population projected at -25% by 2050 — secular population decline; favor cash flow + early exit over multi-decade hold.
- At projected returns (-3.0% appreciation + 4.0% rent growth), your $17k cash investment doubles in ~6 years — after that, you're playing with house money.
Negotiation context
- Only 10 days on market — expect competitive offers; lowballing is unlikely to land.
- 10 sale attempts since 25y ago with the ask held roughly flat each time — persistent listings suggest the price (not the market) is what's stuck; bring a comps-based counter.
Risks & watch-outs
- Watch-outs: built in 1914 — expect roof / HVAC / electrical / plumbing capex.
Questions for the listing agent
- Built in 1914 — when were the roof, HVAC, electrical panel, plumbing, and water heater last replaced?
- Is there a deadline driving the sale (1031 exchange, divorce, estate, relocation)? That informs how much negotiation room exists.
- Schools are F-rated, which usually means shorter tenancies and higher turnover. Who's the typical renter profile here, and what's been the actual vacancy rate?
- Crime grade is F in this area — have there been break-ins, vandalism, or insurance claims at this property in the last 3 years? What carrier currently insures it and at what premium?
- What's the average days-on-market for RENTAL listings here right now (not sales)? A rising rental-DOM trend means longer vacancies and softer asking-rent achievability than the comps imply.
- What's the recent tenant-quality profile in this submarket — average credit score on applications, eviction rate, late-payment / NSF rate, and stable-employment percentage? A property-management company in the area should have these aggregated.
- How much new for-sale + rental construction is in the pipeline within 1–3 miles? Heavy new supply typically softens prices + rents 12–24 months out; constrained supply supports both.
Investment metrics
- 1% rule
- 1.51% ✓
- Cap rate
- 11.88%
- Cash-on-cash
- 19.95%
- DSCR
- 1.89
- GRM
- 5.5
CMA / ARV
- ARV (on-the-fly)
- $78,474
- Comps found
- 12
Show comp detail 12 sales within ~0.75 mi
| Address | Dist | Beds/Ba | Sqft | Sold | Price | $/sf | Match |
|---|---|---|---|---|---|---|---|
| 1529 Beech St | 0.23mi | 2/1.0 | 859 (-5%) | 1mo | $75,000 | $87 | 80 |
| 1542 Beech St | 0.26mi | 3/1.0 (+1) | 864 (-4%) | 1mo | $102,000 | $118 | 75 |
| 1910 Allegan St | 0.52mi | 2/1.0 | 894 (-1%) | 4mo | $91,000 | $102 | 71 |
| 1802 Allegan St | 0.42mi | 2/1.0 | 834 (-8%) | 0mo | $79,900 | $96 | 68 |
| 705 Wayne St | 0.50mi | 3/1.0 (+1) | 897 (-1%) | 6mo | $45,000 | $50 | 66 |
| 1618 Greenwich St | 0.49mi | 2/1.0 | 960 (+6%) | 4mo | $79,900 | $83 | 63 |
| 1700 Marquette St | 0.61mi | 2/1.0 | 963 (+7%) | 1mo | $80,000 | $83 | 60 |
| 1715 Hancock St | 0.65mi | 2/1.0 | 970 (+8%) | 1mo | $42,500 | $44 | 57 |
| 1514 Marquette St | 0.53mi | 2/1.5 | 986 (+9%) | 2mo | $50,000 | $51 | 56 |
| 228 Larch St | 0.46mi | 2/1.0 | 782 (-13%) | 4mo | $71,000 | $91 | 53 |
| 1719 Marquette St | 0.64mi | 2/1.5 | 830 (-8%) | 5mo | $50,000 | $60 | 50 |
| 1902 Newberry St | 0.49mi | 3/1.0 (+1) | 1,004 (+11%) | 4mo | $139,900 | $139 | 50 |
Match score weights: distance 35% · size 25% · config 20% · recency 20%. Top-matched comps best support the ARV.
Projected returns pro-forma
-3.0% appreciation · 3.98% rent growth · sell at horizon
- IRR
- 13.3%
- Equity multiple
- 1.54×
- Total profit
- $8,977
- Equity at exit
- $8,931
- IRR
- 22.9%
- Equity multiple
- 3.06×
- Total profit
- $34,553
- Equity at exit
- $5,179
Cash invested: $16,772 (down + closing). Projections, not guarantees.
Landlord ↔ Tenant lean methodology
- Overall (STATE)
- 62 Landlord-Friendly
- State Michigan
- 62 Landlord-Friendly · EVEN
- County
- — inherits STATE
- City
- — inherits STATE
ZIP-level market 48602
- Home prices YoY
- -19.7%
- Rents YoY
- 4.0%
- Active inventory
- 250
- Price-to-rent
- 5.5×
Monthly cashflow live
- Estimated rent
- $903 medium interval (Pro) →
- Mortgage (P&I)
- −$314
- Tax from tax record
- −$95 /mo · $1,143/yr
- Insurance
- −$25
- HOA
- −$0
- Vacancy / Maint / Mgmt
- −$190
- Net cashflow
- $279
Break-even live
Sensitivity live
| Price | -10% $313 | -5% $296 | +0% $279 | +5% $262 | +10% $245 |
|---|---|---|---|---|---|
| Rent | -10% $208 | -5% $243 | +0% $279 | +5% $314 | +10% $350 |
| Rate | -1.0pp $309 | -0.5pp $294 | base $279 | +0.5pp $263 | +1.0pp $248 |
UW: 25.0% down · 7.5% · 30yr · 1.5% tax · 5.0% vac · 8.0% maint · 8.0% mgmt
Financing live
Cash to close
- Down payment
- $14,975
- Closing costs
- $1,797
- Reserves months
- —
- Total cash needed
- —
Loan-product check · same deal, 3 products live
Conventional
25% down · 7.5% · 30yr
- Down + closing
- —
- Monthly P&I
- —
- Monthly cashflow
- —
- DSCR
- —
- Eligible?
- —
Personal DTI + credit; lowest rate.
DSCR
20% down · 8.5% · 30yr
- Down + closing
- —
- Monthly P&I
- —
- Monthly cashflow
- —
- DSCR
- —
- Eligible?
- —
No personal income docs; deal must DSCR.
Hard money
10% down · 12.0% · 12mo
- Down + closing
- —
- Monthly P&I
- —
- Monthly cashflow
- —
- DSCR
- —
- Eligible?
- —
Short-term bridge; refi at stabilization.
Rent comps 2 comps
| Address | Beds | Baths | Sqft | Rent | $/sqft | DOM | Units | Dist |
|---|---|---|---|---|---|---|---|---|
| 1827 Gilbert St Saginaw, MI | 3.0 | 2.0 | 1008 | $695 | $0.69 | 44d | 1 | 1.40mi |
| 2021 Grout St Saginaw, MI | 1.0–2.0 | 1.0 | 862 | $995 | $1.15 | 44d | 1 | 1.50mi |
Listing history 8 events
-
2026-06-19days on market $59,900 Active 10 DOM
-
2026-06-18days on market $59,900 Active 9 DOM
-
2026-06-17days on market $59,900 Active 8 DOM
-
2026-06-16days on market $59,900 Active 7 DOM
-
2026-06-15days on market $59,900 Active 6 DOM
-
2026-06-14days on market $59,900 Active 4 DOM
-
2026-06-12remarks 384-char remark
-
2026-06-12$59,900 Active 3 DOM
ⓘ Source: listings_history table (triggers on properties + properties_extension) + one-shot
backfill from property_details.listing_events for pre-trigger history.
Tax reassessment forecast MI · Partial reset (capped growth)
- Current annual tax
- $1,143 · $95/mo
- Projected year-2 tax
- $1,143 · $95/mo
- Expected delta
- $0/yr ($0/mo · 0.0%)
ⓘ Screening estimate from a state-policy table — verify with the county assessor before closing.
Climate risk First Street
- Flood 3/10 Moderate FEMA zone X (unshaded) · 20% chance over 30 yrs
- Wildfire 1/10 Low
- Heat 2/10 Low 7 d/yr ≥99°F today · 14 d/yr by 30 yrs out
- Wind 1/10 Low
- Air quality 2/10 Low 1 unhealthy d/yr today · 2 by 30 yrs out
Nearby sold comps map
Loading sold comps map…
Walkable amenities ~0.75 mi
Loading nearby amenities…
Taxation est. · year 1
- Rental income
- $10,833
- − Mortgage interest
- −$3,355
- − Property taxes
- −$1,143
- − Insurance
- −$300
- − Repairs & maintenance
- −$867
- − Management
- −$867
- − Depreciation
- −$1,743
- Taxable income
- $2,559
- Est. tax owed @ 24.0%
- −$614
- After-tax cash flow
- $2,732/yr
For passive investors: Depreciation is non-cash, so a rental often shows a tax loss while cash-flowing — sheltering income. Rental losses are passive: they offset passive income freely, and up to $25,000/yr can offset ordinary (W-2) income if you actively participate and your MAGI is under $100k (phasing out to $0 by $150k); unused losses carry forward. On sale, claimed depreciation is recaptured at up to 25%, and gains may owe capital-gains tax (a 1031 exchange can defer both). Figures are a year-1 estimate at your 24.0% rate — not tax advice; consult a CPA.
Schools (NCES district)
- District
- Saginaw School District
- NCES district ID
- 2630390
- Math proficiency
- 20% ▼ -5.00%
- Reading proficiency
- 29% ▼ -3.00%
- Median HH income
- $28,940
- Composite
- 19.6/100
- National rank
- #8755
- State rank
- #444 of 540 in MI
Livability — Saginaw
- Score
- 63/100
- State rank
- #521
- US rank
- #15424
Category grades
Schools grade is shown separately in the Schools card above.
Census & demographics
- Census place
- Saginaw, MI
- County
- Saginaw County · 54,884 people
- City population
- 54,884
- Metro
- Saginaw, MI
- Population (ZIP)
- 27,127
- Household income
- $46,984
- Rent vs Own
- Severe rent burden
- 1416.0
Population outlook (Saginaw County) Hauer SSP2
- Today (2025)
- 180,568 people
- By 2030
- 172,302 · -4.6%
- By 2040
- 153,919 · -14.8%
- By 2050
- 135,519 · -24.9%
- By 2075
- 97,199 · -46.2%
- By 2100
- 65,037 · -64.0%
Race, ethnicity, and origin ACS 2023
- Neighborhood character
- Diverse neighborhood (Simpson 0.64)
- Race & ethnicity
- White 50% Black 27% Hispanic / Latino 17% Two or more races 12%
- Hispanic origin (detail)
- Mexican 14% Puerto Rican 1%
- Common ancestry
- Romanian 4% Lithuanian 3% Italian 2%
- Foreign-born
- 1% · Canada
- Languages at home
- 96% English-only · Spanish 3%
Political lean MEDSL · Saginaw
- 2024 margin
- Toss-up / Even · D 47.7% · R 51.0% · Other 1.4%
- 2008→2024 swing
- -20.6pp toward R · 2008: 17.3pp · 2024: -3.3pp
- All cycles
- 2024: R+3.3 2020: D+0.3 2016: R+1.1 2012: D+11.9 2008: D+17.3
Not yet ingested
- Civics
- —
Market trends
- HPI YoY
- ▼ -39.15%
- Current HPI
- 159.8807
- Rent YoY
- ▲ 3.98%
- Metro
- Saginaw, MI
- State GDP YoY
- ▲ 1.37%
- F500 in state
- 28
Industry mix (Fortune 500 HQ in MI)
| Industry | F500 HQs | Revenue |
|---|---|---|
| Automotive Parts | 3 | $48B |
|
||
| Automotive | 2 | $372B |
|
||
| Chemicals | 1 | $45B |
|
||
| Automotive Retail | 1 | $29B |
|
||
| Healthcare / Medical Devices | 1 | $23B |
|
||
| Automotive Technology | 1 | $20B |
|
||
Price history
+13.2% since first listed22 events — show timeline
- 2026-06-08 Listed $59,900 MiRealSource-MiMLS
- 2026-06-08 Listed $59,900 REALCOMP
- 2018-04-27 Listing Removed — MiRealSource-MiMLS
- 2018-04-27 Listing Removed — REALCOMP
- 2018-01-23 Price Changed $30,000 MiRealSource-MiMLS
- 2017-11-16 Price Changed $35,900 MiRealSource-MiMLS
- 2017-10-29 Listed $39,900 MiRealSource-MiMLS
- 2017-10-27 Listed $30,000 REALCOMP
- 2013-06-17 Listing Removed — REALCOMP
- 2013-06-17 Listing Removed — MiRealSource-MiMLS
- 2013-03-06 Listed $29,900 REALCOMP
- 2013-03-06 Listed $29,900 MiRealSource-MiMLS
- 2010-01-15 Listing Removed — MiRealSource-MiMLS
- 2010-01-15 Listing Removed — REALCOMP
- 2009-07-15 Listed $49,900 MiRealSource-MiMLS
- 2009-07-15 Listed $49,900 REALCOMP
- 2001-11-16 Sold (Public Records) $52,900 Public Records
- 2001-10-30 Sold (MLS) $52,900 MiRealSource-MiMLS
- 2001-10-30 Sold (MLS) $52,900 REALCOMP
- 2001-10-05 Listing Removed — MiRealSource-MiMLS
- 2001-09-18 Listed $52,900 MiRealSource-MiMLS
- 2001-09-18 Listed $52,900 REALCOMP
Property tax history
+1.5%/yrLatest (2025): $1,143 · -16.3% YoY. Source: county tax records.
Cash-flow waterfall
monthlySold comps — $/sqft
last 12 mo · ≤1 miLoading sold comps…