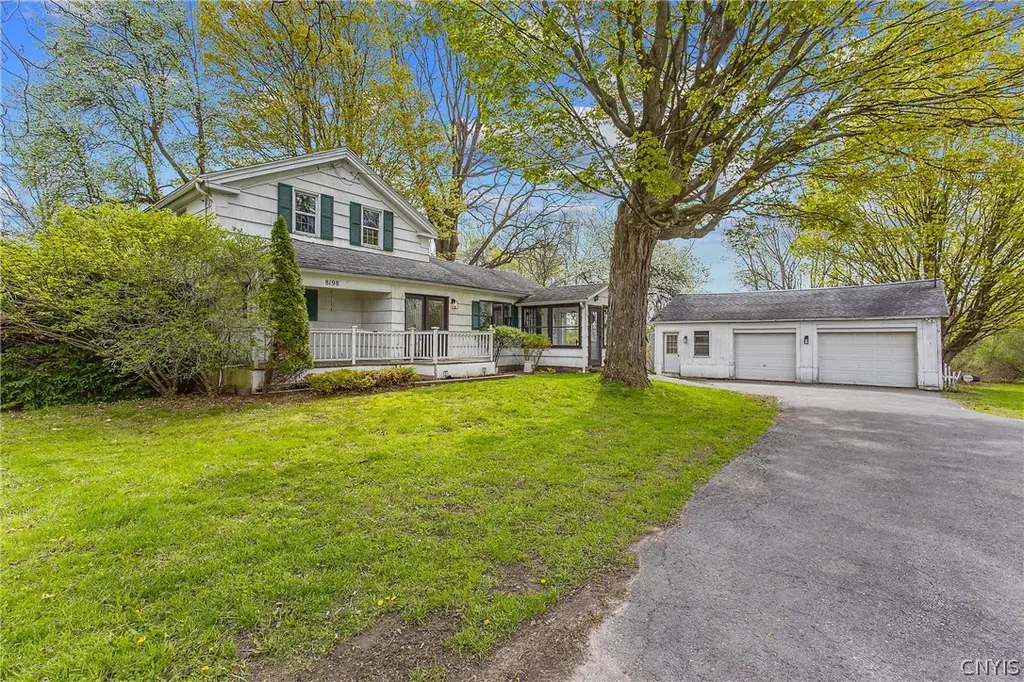
8198 Soule Rd · Radisson, NY
Flood risk 1/10 · Minimal
- FEMA flood zone
- X (unshaded)
- Chance of flooding over 30 yrs
- 0.0%
- Est. flood insurance / yr
- $473 – $860
Fire risk 1/10 · Minimal
- Est. fire insurance / yr
- $691 – $1,283
Heat risk 3/10 · Minor
- Hot days now (above 95°F)
- 7 days/yr
- Hot days in 30 yrs
- 16 days/yr
Wind risk 1/10 · Minimal
- Chance of severe wind over 30 yrs
- 1.0%
Air-quality risk 2/10 · Minimal
- Unhealthy air days now
- 1 days/yr
- Unhealthy air days in 30 yrs
- 1 days/yr
Risk factors via First Street. Map © Google.
Why this score? — see what drove the C grade
The composite is a weighted blend of 9 inputs, each scored 0–100. Each bar is that input's sub-score; the figure is the points it added to the 100-point composite (weight × sub-score).
- Cash flow +20.5/30.0
- ARV discount +11.5/15.0
- DSCR +6.5/10.0
- 1% rule +6.1/10.0
- Schools +4.3/10.0
- Rent growth +2.5/5.0
- Livability +2.5/5.0
- Condition / age +2.5/5.0
- Appreciation +0.0/10.0
$299,900
🖨 Deal sheet 📄 Offer letter ✓ Due diligence
Listing remarks
* * One of a Kind Property * * Original Farmhouse and acreage of all surrounding Subdivisions * * * Versatile Property with over 3.8 acres covered in trees and bushes for private yard buffer * Set up your own home business in either the detached 2 car garage with office space or one of the 2 Large Barns all equipped with 220 amp! Have Trucks or equipment to store. .. ? Perfect Location in the middle of everything ! Main Barn has loft which lends itself to additional office space, studio, or sitting area. * * Main house is side turned on lot which allows you to sit on front porch and enjoy the wildlife! * * 4 Bedrooms with primary bedroom on 1st floor, Open Kitchen, 1st f
Key facts
- Original farmhouse
- Front porch
- Over 3.8 acres
Tags
Property features AI
Exterior
- Parking: Detached garage; Garage with 10 spaces
- Utilities: Water connected (public); Septic tank
- Home design: Single-story home; Existing construction
- Construction: Wood siding; Block and stone foundation
- Exterior features: Blacktop driveway; Second garage; Rectangular, wooded lot (approx. 3.82 acres, dimensions 500 x 400)
Interior
- Kitchen: Kitchen island; Eat-in kitchen; Breakfast bar; Appliances negotiable; Gas water heater
- Bedrooms: 1 main-level bedroom
- Flooring: Carpet; Tile; Varies
- Bathrooms: 1 full bathroom; 1 half bathroom; 1 main-level bathroom
- Heating & cooling: Gas heating; Baseboard heat; Hot water heat; Has heating
- Interior features: Breakfast bar; Ceiling fan(s); Entrance foyer; Eat-in kitchen; Separate/formal living room; Country kitchen; Kitchen island; Main level primary
- Laundry & utility: Main-level laundry
Neighborhood map
What this means for you Summary
Snapshot
- This is a 4-bed/1.0-bath single-family listed at $300k.
Deal economics
- At list price, monthly cash flow is $393 ($5k/yr) — positive.
- The deal already cash-flows at list — no discount required.
- Meets the 1% rule at list price ($3k rent vs $300k).
- Recommended offer: $291k (3.0% below list) — sets the bar for market timing.
- Cap rate 7.9% vs local median 3.5% in Radisson — top-decile yield for the area; either an underpriced asset or a hidden risk that comps aren't pricing in. Stress-test before assuming the spread holds.
Location & tenants
- Location reads: area grade C — affects rentability + tenant quality, not the cash-flow math above.
- Liverpool Central School District (suburban): math 49% / reading 49% proficiency, ranked #381 of 590 in NY (top 65%) — families likely to look elsewhere, expect single-tenant / working-renter base with shorter leases.
- Market conditions: 96 active listings in the ZIP; 2 comparable units currently listed for rent nearby; solid renter incomes; 616 units permitted in Onondaga County in 2024 (256 in 5+ unit buildings).
- This rent runs 45% of the median local income ($88k/yr) — at the standard rent-burdened threshold; future hikes will face affordability resistance.
Forward outlook
- Local home prices are declining (-3.0%/yr); year-one equity from $2k of loan paydown is wiped out by about $9k of value loss. Plan a longer hold.
- Onondaga County population projected to shrink 9% by 2050 — rents likely to lag national; underwrite the cash flow, not the appreciation.
Negotiation context
- It's been on market 48 days — a 3% lower offer ($291k) is reasonable based on typical stale-listing flexibility.
- 7 sale attempts since 13y ago; this cycle's ask has dropped $125k (29%) from the opening price — seller is motivated, your offer sets the floor, not the list.
Risks & watch-outs
- Watch-outs: built in 1880 — expect roof / HVAC / electrical / plumbing capex.
Questions for the listing agent
- It's been on market 48 days. Have you received any prior offers? Is the seller open to a 3% concession, seller financing, or rate buy-down credit?
- Built in 1880 — when were the roof, HVAC, electrical panel, plumbing, and water heater last replaced?
- Is there a deadline driving the sale (1031 exchange, divorce, estate, relocation)? That informs how much negotiation room exists.
- What's the average days-on-market for RENTAL listings here right now (not sales)? A rising rental-DOM trend means longer vacancies and softer asking-rent achievability than the comps imply.
- What's the recent tenant-quality profile in this submarket — average credit score on applications, eviction rate, late-payment / NSF rate, and stable-employment percentage? A property-management company in the area should have these aggregated.
- How much new for-sale + rental construction is in the pipeline within 1–3 miles? Heavy new supply typically softens prices + rents 12–24 months out; constrained supply supports both.
Investment metrics
- 1% rule
- 1.11% ✓
- Cap rate
- 7.87%
- Cash-on-cash
- 5.62%
- DSCR
- 1.25
- GRM
- 7.5
CMA / ARV
- ARV (median comp)
- $328,906
- List price
- $299,900
- Delta
- -8.82%
- Verdict
- FAIR
- Comps
- 20 within 1.0 mi
Show comp detail 12 sales within ~0.75 mi
| Address | Dist | Beds/Ba | Sqft | Sold | Price | $/sf | Match |
|---|---|---|---|---|---|---|---|
| 8195 Laurie Ln | 0.12mi | 4/2.0 | 1,610 (+3%) | 7mo | $240,000 | $149 | 80 |
| 8137 Mesa Ln | 0.24mi | 3/1.5 (-1) | 1,550 (-1%) | 6mo | $275,000 | $177 | 75 |
| 4122 Metauro Dr | 0.17mi | 3/2.5 (-1) | 1,624 (+4%) | 2mo | $377,000 | $232 | 74 |
| 4041 Winterpark Dr | 0.28mi | 5/1.5 (+1) | 1,520 (-3%) | 4mo | $270,000 | $178 | 71 |
| 8252 Elaine Cir | 0.17mi | 3/1.5 (-1) | 1,418 (-10%) | 2mo | $133,000 | $94 | 68 |
| 8159 Portobello | 0.13mi | 3/2.5 (-1) | 1,716 (+10%) | 6mo | $359,900 | $210 | 61 |
| 4245 Rancho Park Dr | 0.67mi | 3/1.5 (-1) | 1,536 (-2%) | 2mo | $315,000 | $205 | 57 |
| 4189 Balboa Dr | 0.52mi | 3/1.5 (-1) | 1,450 (-7%) | 7mo | $284,000 | $196 | 51 |
| 8323 Falcon Dr | 0.52mi | 3/1.0 (-1) | 1,404 (-10%) | 6mo | $215,000 | $153 | 48 |
| 8292 Redwing Dr | 0.71mi | 3/2.0 (-1) | 1,520 (-3%) | 7mo | $217,000 | $143 | 47 |
| 4177 Torrey Ln | 0.52mi | 4/2.0 | 1,368 (-13%) | 6mo | $240,000 | $175 | 46 |
| 4152 Lucan Rd | 0.75mi | 4/1.5 | 1,792 (+14%) | 1mo | $335,000 | $187 | 38 |
Match score weights: distance 35% · size 25% · config 20% · recency 20%. Top-matched comps best support the ARV.
Projected returns pro-forma
-3.0% appreciation · 3.0% rent growth · sell at horizon
- IRR
- -7.6%
- Equity multiple
- 0.72×
- Total profit
- $-23,406
- Equity at exit
- $44,716
- IRR
- 2.1%
- Equity multiple
- 1.15×
- Total profit
- $12,454
- Equity at exit
- $25,930
Cash invested: $83,972 (down + closing). Projections, not guarantees.
Landlord ↔ Tenant lean methodology
- Overall (STATE)
- 15 Strongly Tenant-Friendly
- State New York
- 15 Strongly Tenant-Friendly · D+10
- County
- — inherits STATE
- City
- — inherits STATE
ZIP-level market 13090
- Active inventory
- 96
- Price-to-rent
- 7.5×
Monthly cashflow live
- Estimated rent
- $3,315 medium interval (Pro) →
- Mortgage (P&I)
- −$1,573
- Tax from tax record
- −$528 /mo · $6,332/yr
- Insurance
- −$125
- HOA
- −$0
- Vacancy / Maint / Mgmt
- −$696
- Net cashflow
- $393
Break-even live
UW: 25.0% down · 7.5% · 30yr · 1.5% tax · 5.0% vac · 8.0% maint · 8.0% mgmt
Financing live
Cash to close
- Down payment
- $74,975
- Closing costs
- $8,997
- Reserves months
- —
- Total cash needed
- —
Loan-product check · same deal, 3 products live
Conventional
25% down · 7.5% · 30yr
- Down + closing
- —
- Monthly P&I
- —
- Monthly cashflow
- —
- DSCR
- —
- Eligible?
- —
Personal DTI + credit; lowest rate.
DSCR
20% down · 8.5% · 30yr
- Down + closing
- —
- Monthly P&I
- —
- Monthly cashflow
- —
- DSCR
- —
- Eligible?
- —
No personal income docs; deal must DSCR.
Hard money
10% down · 12.0% · 12mo
- Down + closing
- —
- Monthly P&I
- —
- Monthly cashflow
- —
- DSCR
- —
- Eligible?
- —
Short-term bridge; refi at stabilization.
Rent comps 2 comps
| Address | Beds | Baths | Sqft | Rent | $/sqft | DOM | Units | Dist |
|---|---|---|---|---|---|---|---|---|
| 8439 Lace Bark Ln Liverpool, NY | 5.0 | 3.0 | 1694 | $2,897 | $1.71 | 13d | 1 | 0.81mi |
| 4071 Sesame Path Liverpool, NY | 4.0 | 2.5 | 1928 | $3,200 | $1.66 | 20d | 1 | 1.00mi |
Listing history 25 events
-
2026-06-19status $299,900 Pending 48 DOM
-
2026-06-18days on market $299,900 Active 48 DOM
-
2026-06-17days on market $299,900 Active 47 DOM
-
2026-06-16days on market $299,900 Active 46 DOM
-
2026-06-15days on market $299,900 Active 45 DOM
-
2026-06-14days on market $299,900 Active 43 DOM
-
2026-06-13days on market $299,900 Active 42 DOM
-
2026-06-10days on market $299,900 Active 40 DOM
-
2026-06-09days on market $299,900 Active 39 DOM
-
2026-06-08days on market $299,900 Active 38 DOM
-
2026-06-07days on market $299,900 Active 37 DOM
-
2026-06-02days on market $299,900 Active 32 DOM
-
2026-06-01pricedays on market $299,900 Active 31 DOM
-
2026-05-05price $399,900 840-char remark
-
2026-04-29$424,900 Active 840-char remark
-
2024-01-13historical
-
2024-01-13historical
-
2023-11-08$325,000 Active
-
2023-11-07price $325,000
-
2023-08-27price $370,000
-
2023-07-31price $489,000
-
2023-06-13$550,000 Active
-
2014-05-13$245,000
-
2014-05-12$245,000
-
2013-06-21$259,900
ⓘ Source: listings_history table (triggers on properties + properties_extension) + one-shot
backfill from property_details.listing_events for pre-trigger history.
Tax reassessment forecast NY · Partial reset (capped growth)
- Current annual tax
- $6,332 · $528/mo
- Projected year-2 tax
- $6,332 · $528/mo
- Expected delta
- $0/yr ($0/mo · 0.0%)
ⓘ Screening estimate from a state-policy table — verify with the county assessor before closing.
Climate risk First Street
- Flood 1/10 Low FEMA zone X (unshaded) · 0% chance over 30 yrs
- Wildfire 1/10 Low
- Heat 3/10 Moderate 7 d/yr ≥95°F today · 16 d/yr by 30 yrs out
- Wind 1/10 Low 100% chance of damaging wind over 30 yrs
- Air quality 2/10 Low 1 unhealthy d/yr today · 1 by 30 yrs out
Nearby sold comps map
Loading sold comps map…
Walkable amenities ~0.75 mi
Loading nearby amenities…
Taxation est. · year 1
- Rental income
- $39,776
- − Mortgage interest
- −$16,799
- − Property taxes
- −$6,332
- − Insurance
- −$1,500
- − Repairs & maintenance
- −$3,182
- − Management
- −$3,182
- − Depreciation
- −$8,724
- Taxable income
- $57
- Est. tax owed @ 24.0%
- −$14
- After-tax cash flow
- $4,705/yr
For passive investors: Depreciation is non-cash, so a rental often shows a tax loss while cash-flowing — sheltering income. Rental losses are passive: they offset passive income freely, and up to $25,000/yr can offset ordinary (W-2) income if you actively participate and your MAGI is under $100k (phasing out to $0 by $150k); unused losses carry forward. On sale, claimed depreciation is recaptured at up to 25%, and gains may owe capital-gains tax (a 1031 exchange can defer both). Figures are a year-1 estimate at your 24.0% rate — not tax advice; consult a CPA.
Schools (NCES district)
- District
- Liverpool Central School District
- NCES district ID
- 3617520
- Math proficiency
- 49% ▼ -6.00%
- Reading proficiency
- 49% ▲ 1.00%
- Median HH income
- $59,134
- Composite
- 42.84/100
- National rank
- #3134
- State rank
- #381 of 590 in NY
Livability — Radisson
No livability data for this city. (Only ~50 U.S. cities are tracked.)
Census & demographics
- County
- Onondaga County · 247,257 people
- Metro
- Syracuse, NY
- Population (ZIP)
- 29,004
- Household income
- $88,492
- Rent vs Own
- Severe rent burden
- 733.0
Population outlook (Onondaga County) Hauer SSP2
- Today (2025)
- 467,894 people
- By 2030
- 463,381 · -1.0%
- By 2040
- 447,697 · -4.3%
- By 2050
- 426,399 · -8.9%
- By 2075
- 373,661 · -20.1%
- By 2100
- 307,967 · -34.2%
Race, ethnicity, and origin ACS 2023
- Neighborhood character
- Predominantly White (79%)
- Race & ethnicity
- White 79% Two or more races 9% Hispanic / Latino 7% Black 6% Asian 3%
- Hispanic origin (detail)
- Mexican 1% Puerto Rican 4%
- Common ancestry
- Romanian 7% Lithuanian 4% Italian 2%
- Foreign-born
- 6% · Canada, China, South Korea
- Languages at home
- 93% English-only · Other Indo-European 2% Spanish 1% Russian/Polish/Slavic 1%
Political lean MEDSL · Onondaga
- 2024 margin
- D (+17.3) · D 58.6% · R 41.4%
- 2008→2024 swing
- -3.0pp toward R · 2008: 20.3pp · 2024: 17.3pp
- All cycles
- 2024: D+17.3 2020: D+20.6 2016: D+12.8 2012: D+21.1 2008: D+20.3
Not yet ingested
- Civics
- —
Market trends
- HPI YoY
- ▼ -228.53%
- Current HPI
- 320.4989
- Rent YoY
- —
- Metro
- Syracuse, NY
- State GDP YoY
- ▲ 2.60%
- F500 in state
- 92
Industry mix (Fortune 500 HQ in NY)
| Industry | F500 HQs | Revenue |
|---|---|---|
| Financial Services | 10 | $950B |
|
||
| Consumer Goods | 9 | $162B |
|
||
| Insurance | 4 | $225B |
|
||
| Telecommunications | 2 | $144B |
|
||
| Pharmaceuticals | 2 | $112B |
|
||
| Media / Entertainment | 2 | $69B |
|
||
Price history
+15.4% since first listed15 events — show timeline
- 2026-06-18 Pending — CNYIS
- 2026-06-01 Relisted — CNYIS
- 2026-06-01 Price Changed $299,900 CNYIS
- 2026-05-05 Price Changed $399,900 CNYIS
- 2026-04-29 Listed $424,900 CNYIS
- 2024-01-13 Listing Removed — CNYIS
- 2024-01-13 Listing Removed — CNYIS
- 2023-11-08 Listed $325,000 CNYIS
- 2023-11-07 Price Changed $325,000 CNYIS
- 2023-08-27 Price Changed $370,000 CNYIS
- 2023-07-31 Price Changed $489,000 CNYIS
- 2023-06-13 Listed $550,000 CNYIS
- 2014-05-13 Listed $245,000 CNYIS
- 2014-05-12 Listed $245,000 CNYIS
- 2013-06-21 Listed $259,900 CNYIS
Property tax history
+16.5%/yrLatest (2025): $6,332 · +5.4% YoY. Source: county tax records.
Cash-flow waterfall
monthlySold comps — $/sqft
last 12 mo · ≤1 miLoading sold comps…