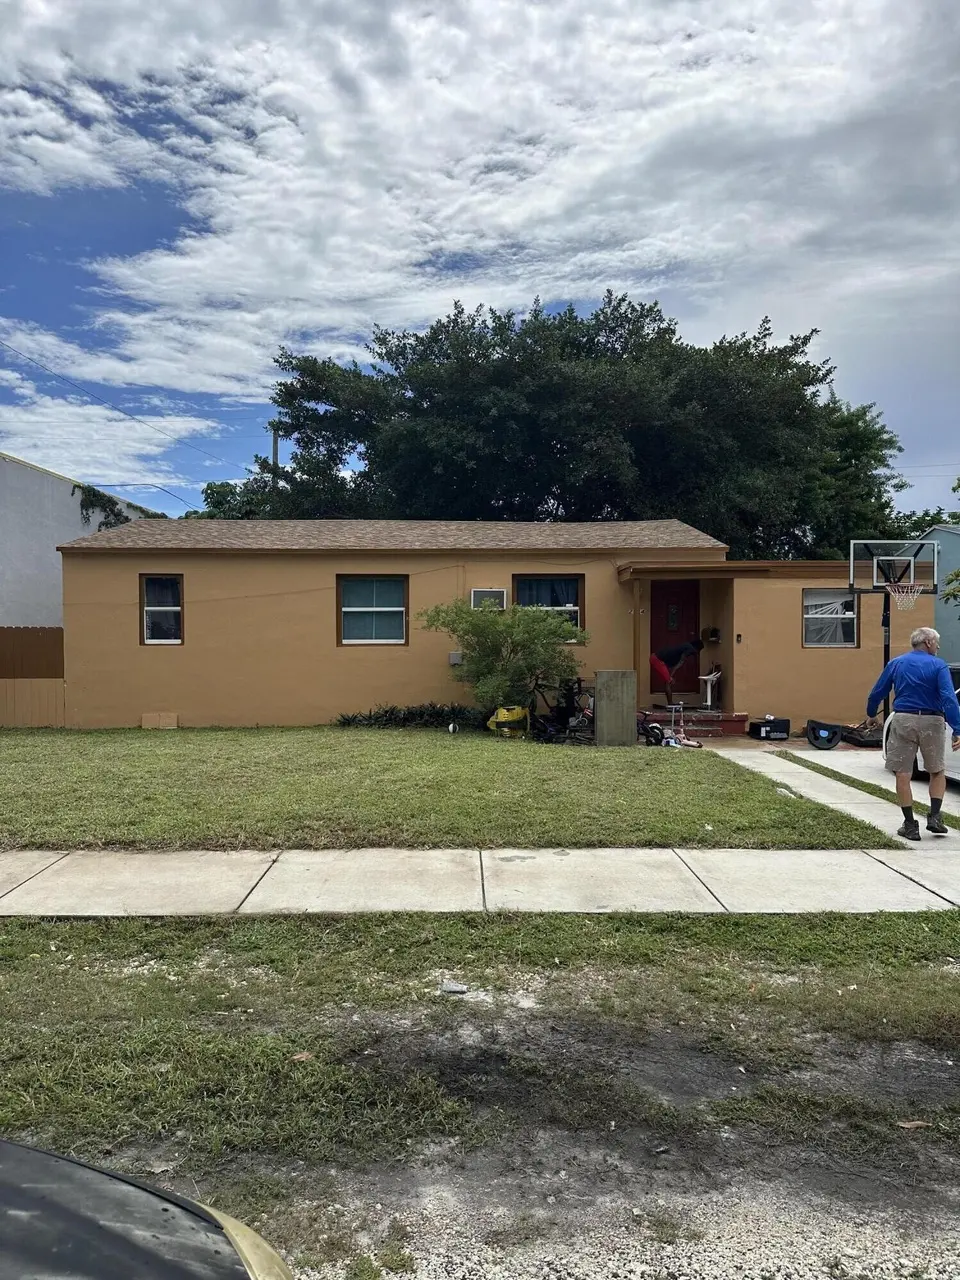
2114 Dewey St · Hollywood, FL
Flood risk 5/10 · Moderate
- FEMA flood zone
- X (shaded)
- Chance of flooding over 30 yrs
- 0.24%
- Est. flood insurance / yr
- $507 – $1,088
Fire risk 1/10 · Minimal
- Est. fire insurance / yr
- $947 – $1,759
Heat risk 10/10 · Severe
- Hot days now (above 105°F)
- 7 days/yr
- Hot days in 30 yrs
- 27 days/yr
Wind risk 10/10 · Severe
- Chance of severe wind over 30 yrs
- 99.0%
Air-quality risk 2/10 · Minimal
- Unhealthy air days now
- 1 days/yr
- Unhealthy air days in 30 yrs
- 2 days/yr
Risk factors via First Street. Map © Google.
Why this score? — see what drove the C+ grade
The composite is a weighted blend of 9 inputs, each scored 0–100. Each bar is that input's sub-score; the figure is the points it added to the 100-point composite (weight × sub-score).
- Cash flow +21.9/30.0
- ARV discount +15.0/15.0
- DSCR +7.0/10.0
- 1% rule +5.4/10.0
- Schools +4.1/10.0
- Livability +3.8/5.0
- Rent growth +2.6/5.0
- Condition / age +2.5/5.0
- Appreciation +0.0/10.0
$339,990
🖨 Deal sheet (PDF) 📄 Offer letter ✓ Due diligence
Listing remarks MLS
BANK FORECLOSURE!!WOOD FLOORING W/FIREPLACE NEEDS WORK - VACANT ON LKBX SPECIAL CONTRACT & ADDENDUMS REQUIRED CALL 954-474-7668 TO SHOW
Key facts
- 2 parking spots
- Built 1947
- Listed 37 days
Property features AI
Finance
- Other: Pets allowed with no restrictions
Exterior
- Parking: Driveway parking; On-street parking; Total 2 parking spaces
- Utilities: Public water; Public sewer; 200+ amp electrical service; Other utilities
- Home design: Single family residence; One story; Faces north; Resale property
- Construction: Stucco and CBS construction
- Exterior features: Not waterfront; Shingle roof
Interior
- Kitchen: Refrigerator
- Bedrooms: 4 bedrooms on the main level
- Flooring: Tile; Other
- Bathrooms: 2 full bathrooms (both on the main level)
- Heating & cooling: Central heating; Central air conditioning; Ceiling fans
- Interior features: Refrigerator included; Tile and other flooring
Neighborhood map
What this means for you Summary
Snapshot
- This is a 3-bed/1.0-bath single-family listed at $340k.
Deal economics
- At list price, monthly cash flow is $537 ($6k/yr) — positive.
- The deal already cash-flows at list — no discount required.
- Meets the 1% rule at list price ($4k rent vs $340k).
- Recommended offer: $330k (3.0% below list) — sets the bar for market timing.
- Cap rate 8.2% vs local median 3.2% in Hollywood — top-decile yield for the area; either an underpriced asset or a hidden risk that comps aren't pricing in. Stress-test before assuming the spread holds.
Location & tenants
- Location reads 76/100 on livability (#232 in FL, #3,548 nationally) — a middle-class / working-renter tenant base. Strengths: commute A+, housing A+, crime B+; Watch: amenities D.
- Broward (suburban): math 42% / reading 53% proficiency, ranked #46 of 73 in FL (top 63%) — families likely to look elsewhere, expect single-tenant / working-renter base with shorter leases.
- Zoned schools: Colbert Elementary School (math 35% / reading 29%, grade F, #1,797 of 2,144 statewide, top 86%, 611 students, 82% FRL); Nova Middle School (math 44% / reading 53%, grade C-, #274 of 571 statewide, top 50%, 1,284 students, 68% FRL); Hallandale High School (math 10% / reading 24%, grade F, #597 of 667 statewide, top 90%, 1,104 students, 70% FRL) — zoned schools average 73% FRL vs 51% district-wide (22 pts higher); higher-poverty schools than district average — tighter screening recommended.
- Zoned-school proficiency averages 32% at this address vs 48% district-wide (-15 pts) — the specific schools serving this property underperform the Broward average; the district grade overstates school quality for this exact location.
- Market conditions: Rents flat; 591 active listings in the ZIP; 40 comparable units currently listed for rent nearby; rentals at typical pace (median 17d on market — plan ~3-4 weeks tenant-placement turnaround); 2,111 units permitted in Broward County in 2024 (1,265 in 5+ unit buildings).
- At $3,521/mo this rent would consume 75% of the median local household income ($56k/yr) (locally 3948% of renters already pay >50% of income on rent) — very limited rent-growth headroom before tenants either downsize or default.
Forward outlook
- Local home prices are declining (-3.0%/yr); year-one equity from $2k of loan paydown is wiped out by about $10k of value loss. Plan a longer hold.
- Broward County population projected at +34% by 2050 — long-run rental-demand tailwind backs the buy-and-hold thesis.
Negotiation context
- It's been on market 37 days — a 3% lower offer ($330k) is reasonable based on typical stale-listing flexibility.
- 2 sale attempts since 28y ago with the ask held roughly flat each time — persistent listings suggest the price (not the market) is what's stuck; bring a comps-based counter.
Risks & watch-outs
- Watch-outs: built in 1947 — expect roof / HVAC / electrical / plumbing capex.
- Climate carrying-cost: moderate flood risk; severe wind risk, 99% chance of damaging wind over 30y; extreme-heat days projected 7→27/yr by 2055 (HVAC capex compounding) — expect insurance premiums to compound above CPI over the hold.
Questions for the listing agent
- It's been on market 37 days. Have you received any prior offers? Is the seller open to a 3% concession, seller financing, or rate buy-down credit?
- Built in 1947 — when were the roof, HVAC, electrical panel, plumbing, and water heater last replaced?
- Is there a deadline driving the sale (1031 exchange, divorce, estate, relocation)? That informs how much negotiation room exists.
- What's the average days-on-market for RENTAL listings here right now (not sales)? A rising rental-DOM trend means longer vacancies and softer asking-rent achievability than the comps imply.
- What's the recent tenant-quality profile in this submarket — average credit score on applications, eviction rate, late-payment / NSF rate, and stable-employment percentage? A property-management company in the area should have these aggregated.
- How much new for-sale + rental construction is in the pipeline within 1–3 miles? Heavy new supply typically softens prices + rents 12–24 months out; constrained supply supports both.
Investment metrics
- 1% rule
- 1.04% ✓
- Cap rate
- 8.19%
- Cash-on-cash
- 6.77%
- DSCR
- 1.30
- GRM
- 8.0
CMA / ARV
- ARV (on-the-fly)
- $411,240
- Comps found
- 7
Show comp detail 7 sales within ~0.75 mi
| Address | Dist | Beds/Ba | Sqft | Sold | Price | $/sf | Match |
|---|---|---|---|---|---|---|---|
| 2533 Wiley St | 0.59mi | 2/1.0 (-1) | 1,212 (+2%) | 2mo | $380,000 | $314 | 63 |
| 2110 Wiley Ct | 0.24mi | 4/2.0 (+1) | 1,150 (-4%) | 21mo | $455,000 | $396 | 57 |
| 2323 Dewey St | 0.23mi | 2/1.0 (-1) | 1,116 (-6%) | 23mo | $435,000 | $390 | 54 |
| 2648 Washington St | 0.69mi | 3/2.0 | 1,193 (+0%) | 13mo | $411,000 | $345 | 53 |
| 811 NW 5th Ave | 0.67mi | 2/1.0 (-1) | 1,272 (+7%) | 5mo | $310,000 | $244 | 48 |
| 1700 Dewey St | 0.55mi | 3/1.5 | 1,326 (+11%) | 7mo | $376,000 | $284 | 48 |
| 1524 South 22nd Ct | 0.36mi | 3/1.0 | 1,040 (-13%) | 23mo | $450,000 | $433 | 43 |
Match score weights: distance 35% · size 25% · config 20% · recency 20%. Top-matched comps best support the ARV.
Projected returns pro-forma
-3.0% appreciation · 0.43% rent growth · sell at horizon
- IRR
- -8.7%
- Equity multiple
- 0.69×
- Total profit
- $-29,797
- Equity at exit
- $50,694
- IRR
- -2.9%
- Equity multiple
- 0.83×
- Total profit
- $-16,571
- Equity at exit
- $29,396
Cash invested: $95,197 (down + closing). Projections, not guarantees.
Landlord ↔ Tenant lean methodology
- Overall (STATE)
- 87 Strongly Landlord-Friendly
- State Florida
- 87 Strongly Landlord-Friendly · R+3
- County
- — inherits STATE
- City
- — inherits STATE
ZIP-level market 33020
- Rents YoY
- 0.4%
- Active inventory
- 591
- Price-to-rent
- 8.0×
Monthly cashflow live
- Estimated rent
- $3,521 high interval (Pro) →
- Mortgage (P&I)
- −$1,783
- Tax from tax record
- −$320 /mo · $3,839/yr
- Insurance
- −$142
- HOA
- −$0
- Vacancy / Maint / Mgmt
- −$739
- Net cashflow
- $537
Break-even live
Sensitivity live
| Price | -10% $729 | -5% $633 | +0% $537 | +5% $440 | +10% $344 |
|---|---|---|---|---|---|
| Rent | -10% $259 | -5% $398 | +0% $537 | +5% $676 | +10% $815 |
| Rate | -1.0pp $708 | -0.5pp $623 | base $537 | +0.5pp $449 | +1.0pp $359 |
UW: 25.0% down · 7.5% · 30yr · 1.5% tax · 5.0% vac · 8.0% maint · 8.0% mgmt
Financing live
Cash to close
- Down payment
- $84,998
- Closing costs
- $10,200
- Reserves months
- —
- Total cash needed
- —
Loan-product check · same deal, 3 products live
Conventional
25% down · 7.5% · 30yr
- Down + closing
- —
- Monthly P&I
- —
- Monthly cashflow
- —
- DSCR
- —
- Eligible?
- —
Personal DTI + credit; lowest rate.
DSCR
20% down · 8.5% · 30yr
- Down + closing
- —
- Monthly P&I
- —
- Monthly cashflow
- —
- DSCR
- —
- Eligible?
- —
No personal income docs; deal must DSCR.
Hard money
10% down · 12.0% · 12mo
- Down + closing
- —
- Monthly P&I
- —
- Monthly cashflow
- —
- DSCR
- —
- Eligible?
- —
Short-term bridge; refi at stabilization.
Rent comps 40 comps
| Address | Beds | Baths | Sqft | Rent | $/sqft | DOM | Units | Dist |
|---|---|---|---|---|---|---|---|---|
| 1938 Jackson St Hollywood, FL | 2.0 | 2.0 | 1170 | $3,600 | $3.08 | 25d | 1 | 0.44mi |
| 2001 Van Buren St Hollywood, FL | 2.0 | 1.0–2.0 | 788 | $3,599 | $4.57 | 16d | 171 | 0.49mi |
| 200 E Pembroke Rd Hallandale Beach, FL | 3.0 | 1.0–2.0 | 1006 | $4,120 | $4.10 | 0d | 63 | 0.50mi |
| 2165 Van Buren St Hollywood, FL | 3.0 | 1.0–3.0 | 1072 | $4,420 | $4.12 | 0d | 15 | 0.53mi |
| 421 W Pembroke Rd Hallandale Beach, FL | 4.0 | 2.0 | 1250 | $3,999 | $3.20 | 25d | 1 | 0.53mi |
| 1715 Jefferson St Hollywood, FL | 3.0 | 2.0 | 1479 | $4,200 | $2.84 | 23d | 1 | 0.58mi |
| 320 S Federal Hwy Hollywood, FL | 2.0 | 1.0–2.0 | 742 | $3,616 | $4.87 | 25d | 9 | 0.59mi |
| 2233 Hollywood Blvd Hollywood, FL | 1.0–2.0 | 1.0–2.0 | 913 | $3,515 | $3.85 | 16d | 94 | 0.60mi |
| 303 S Federal Hwy Hollywood, FL | 1.0–3.0 | 1.0–3.0 | 992 | $3,690 | $3.72 | 3d | 35 | 0.63mi |
| 1818 Hollywood Blvd Hollywood, FL | 3.0 | 1.0–2.5 | 1089 | $5,510 | $5.06 | 0d | 26 | 0.65mi |
| 1770 S Young Cir Hollywood, FL | 2.0 | 1.0–2.0 | 881 | $4,768 | $5.41 | 0d | 42 | 0.67mi |
| 2648 Washington St Hollywood, FL | 2.0 | 1.0 | 1193 | $2,800 | $2.35 | 25d | 1 | 0.67mi |
| 1720 Harrison St #1725 Hollywood, FL | 2.0 | 1.5 | 1320 | $4,400 | $3.33 | 12d | 1 | 0.72mi |
| 1720 Harrison St Unit 1523019P Hollywood, FL | 2.0 | 1.5 | 1313 | $5,107 | $3.89 | 0d | 1 | 0.73mi |
| 2740 Dewey St Hollywood, FL | 3.0 | 1.0 | 1191 | $2,900 | $2.43 | 14d | 1 | 0.78mi |
| 2750 Washington St Hollywood, FL | 2.0 | 1.0 | 1053 | $3,300 | $3.13 | 3d | 1 | 0.80mi |
| 2750 Washington St Hollywood, FL | 2.0 | 1.0 | 1053 | $3,500 | $3.32 | 16d | 1 | 0.80mi |
| 1528 Wiley St Hollywood, FL | 2.0 | 1.0 | 1488 | $4,100 | $2.76 | 25d | 1 | 0.80mi |
| 1912 Taylor St Hollywood, FL | 2.0 | 2.0 | 1440 | $3,500 | $2.43 | 25d | 1 | 0.81mi |
| 1527 Mayo St Hollywood, FL | 4.0 | 2.0 | 1462 | $4,995 | $3.42 | 16d | 1 | 0.81mi |
| 841 NW 10th St Hallandale Beach, FL | 3.0 | 2.0 | 1485 | $3,100 | $2.09 | 9d | 1 | 0.84mi |
| 832 NW 10th St Unit 1 Hallandale Beach, FL | 2.0 | 1.0 | 800 | $1,800 | $2.25 | 25d | 1 | 0.84mi |
| 1448 Dewey St Unit 1448 Hollywood, FL | 4.0 | 2.0 | 1459 | $4,999 | $3.43 | 25d | 1 | 0.84mi |
| 1008 Moffett St Hallandale Beach, FL | 4.0 | 1.0 | 1500 | $5,000 | $3.33 | 25d | 1 | 0.85mi |
| 1776 Polk St Hollywood, FL | 1.0–2.0 | 1.0–2.0 | 954 | $3,598 | $3.77 | 16d | 25 | 0.85mi |
| 1001 NE 10th St Unit 2 Hallandale Beach, FL | 3.0 | 2.0 | 1270 | $3,600 | $2.83 | 25d | 1 | 0.86mi |
| 852 NW 8th St #852 Hallandale Beach, FL | 3.0 | 2.0 | 1170 | $2,800 | $2.39 | 23d | 1 | 0.92mi |
| 2849 Dewey St Unit 2849 Hollywood, FL | 2.0 | 2.0 | 1265 | $2,600 | $2.06 | 12d | 1 | 0.92mi |
| 2849 Dewey St Unit 2849 Hollywood, FL | 2.0 | 2.0 | 1265 | $2,600 | $2.06 | 9d | 1 | 0.92mi |
| 1403 Adams St Hollywood, FL | 3.0 | 2.0 | 1459 | $4,500 | $3.08 | 25d | 1 | 0.94mi |
| 1403 Adams St Unit 1403 Hollywood, FL | 3.0 | 2.0 | 1459 | $4,200 | $2.88 | 25d | 1 | 0.94mi |
| 1306 S 29th Ave Hollywood, FL | 3.0 | 2.0 | 1500 | $3,300 | $2.20 | 20d | 1 | 0.99mi |
| 401 N Federal Hwy Hallandale Beach, FL | 1.0–3.0 | 1.0–2.0 | 973 | $3,638 | $3.74 | 16d | 48 | 1.00mi |
| 906 NE 6th St Hallandale Beach, FL | 3.0 | 2.0 | 1080 | $4,250 | $3.94 | 25d | 1 | 1.00mi |
| 906 NE 6th St Hallandale Beach, FL | 3.0 | 2.0 | 1080 | $4,250 | $3.94 | 13d | 1 | 1.00mi |
| 906 NE 6th St Hallandale Beach, FL | 3.0 | 2.0 | 1080 | $4,250 | $3.94 | 6d | 1 | 1.00mi |
| 2917 Plunkett St Unit 15C Hollywood, FL | 2.0 | 1.0 | 900 | $1,950 | $2.17 | 9d | 1 | 1.00mi |
| 2511 Pierce St #1 Hollywood, FL | 3.0 | 2.5 | 1500 | $3,800 | $2.53 | 25d | 1 | 1.03mi |
| 1046 Foster Rd Hallandale Beach, FL | 2.0 | 1.0 | 750 | $1,795 | $2.39 | 9d | 1 | 1.04mi |
| 2918 Jackson St Unit 1 Hollywood, FL | 2.0 | 1.0 | 750 | $1,700 | $2.27 | 9d | 1 | 1.04mi |
Listing history 27 events
-
2026-06-21days on market $339,990 Active 37 DOM
-
2026-06-18days on market $339,990 Active 34 DOM
-
2026-06-17days on market $339,990 Active 33 DOM
-
2026-06-16days on market $339,990 Active 32 DOM
-
2026-06-15days on market $339,990 Active 31 DOM
-
2026-06-13days on market $339,990 Active 29 DOM
-
2026-06-09days on market $339,990 Active 25 DOM
-
2026-06-08days on market $339,990 Active 24 DOM
-
2026-06-07days on market $339,990 Active 23 DOM
-
2026-06-04days on market $339,990 Active 20 DOM
-
2026-06-03days on market $339,990 Active 19 DOM
-
2026-06-02days on market $339,990 Active 18 DOM
-
2026-06-01days on market $339,990 Active 17 DOM
-
2026-05-31days on market $339,990 Active 16 DOM
-
2026-05-15$339,990 Active
-
2025-12-17soldstatus $6,800,000
-
2004-06-09soldstatus $209,000
-
2003-02-11soldstatus $137,000
-
2002-10-30soldstatus $90,000
-
2000-09-29soldstatus $48,285
-
2000-09-29soldstatus $59,000
-
2000-09-29soldstatus $120,000
-
1998-09-11soldstatus $44,000
-
1998-09-11soldstatus $105,000
-
1998-09-08soldstatus $44,000 139-char remark
Show marketing remark (139 chars)
BANK FORECLOSURE!!WOOD FLOORING W/FIREPLACE NEEDS WORK - VACANT ON LKBX SPECIAL CONTRACT & ADDENDUMS REQUIRED CALL 954-474-7668 TO SHOW
-
1998-06-30historical 139-char remark
Show marketing remark (139 chars)
BANK FORECLOSURE!!WOOD FLOORING W/FIREPLACE NEEDS WORK - VACANT ON LKBX SPECIAL CONTRACT & ADDENDUMS REQUIRED CALL 954-474-7668 TO SHOW
-
1998-06-26$49,000 139-char remark
Show marketing remark (139 chars)
BANK FORECLOSURE!!WOOD FLOORING W/FIREPLACE NEEDS WORK - VACANT ON LKBX SPECIAL CONTRACT & ADDENDUMS REQUIRED CALL 954-474-7668 TO SHOW
ⓘ Source: listings_history table (triggers on properties + properties_extension) + one-shot
backfill from property_details.listing_events for pre-trigger history.
Tax reassessment forecast FL · Resets to sale price
- Current annual tax
- $3,839 · $320/mo
- Projected year-2 tax
- $3,839 · $320/mo
- Expected delta
- $0/yr ($0/mo · 0.0%)
ⓘ Screening estimate from a state-policy table — verify with the county assessor before closing.
Climate risk First Street
- Flood 5/10 Major FEMA zone X (shaded) · 24% chance over 30 yrs
- Wildfire 1/10 Low
- Heat 10/10 Extreme 7 d/yr ≥105°F today · 27 d/yr by 30 yrs out
- Wind 10/10 Extreme 99% chance of damaging wind over 30 yrs
- Air quality 2/10 Low 1 unhealthy d/yr today · 2 by 30 yrs out
Nearby sold comps map
Loading sold comps map…
Walkable amenities ~0.75 mi
Loading nearby amenities…
Taxation est. · year 1
- Rental income
- $42,246
- − Mortgage interest
- −$19,045
- − Property taxes
- −$3,839
- − Insurance
- −$1,700
- − Repairs & maintenance
- −$3,380
- − Management
- −$3,380
- − Depreciation
- −$9,891
- Taxable income
- $1,013
- Est. tax owed @ 24.0%
- −$243
- After-tax cash flow
- $6,197/yr
For passive investors: Depreciation is non-cash, so a rental often shows a tax loss while cash-flowing — sheltering income. Rental losses are passive: they offset passive income freely, and up to $25,000/yr can offset ordinary (W-2) income if you actively participate and your MAGI is under $100k (phasing out to $0 by $150k); unused losses carry forward. On sale, claimed depreciation is recaptured at up to 25%, and gains may owe capital-gains tax (a 1031 exchange can defer both). Figures are a year-1 estimate at your 24.0% rate — not tax advice; consult a CPA.
Schools (NCES district)
- District
- Broward
- NCES district ID
- 1200180
- Math proficiency
- 42% ▼ -18.00%
- Reading proficiency
- 53% ▼ -5.00%
- Median HH income
- $52,139
- Composite
- 40.88/100
- National rank
- #3621
- State rank
- #46 of 73 in FL
Livability — Hollywood
- Score
- 76/100
- State rank
- #232
- US rank
- #3548
Category grades
Schools grade is shown separately in the Schools card above.
Census & demographics
- Census place
- Hollywood, FL
- County
- Broward County · 1,963,430 people
- City population
- 109,079
- Metro
- Miami-Fort Lauderdale-Pompano Beach, FL
- Population (ZIP)
- 46,322
- Household income
- $56,473
- Rent vs Own
- Severe rent burden
- 3948.0
Population outlook (Broward County) Hauer SSP2
- Today (2025)
- 2,207,033 people
- By 2030
- 2,360,704 · +7.0%
- By 2040
- 2,661,208 · +20.6%
- By 2050
- 2,946,698 · +33.5%
- By 2075
- 3,602,273 · +63.2%
- By 2100
- 3,970,984 · +79.9%
Race, ethnicity, and origin ACS 2023
- Neighborhood character
- Diverse neighborhood (Simpson 0.68)
- Race & ethnicity
- Hispanic / Latino 43% Two or more races 31% White 28% Black 24% Asian 1%
- Hispanic origin (detail)
- Mexican 1% Puerto Rican 4% Cuban 9% Dominican 3% Salvadoran 3%
- Common ancestry
- Hispanic 5% Lithuanian 2% Scotch-Irish 1%
- Foreign-born
- 41% · Canada, Jamaica, Dominican Republic
- Languages at home
- 48% English-only · Spanish 38% French/Haitian/Cajun 6% Russian/Polish/Slavic 2%
Political lean MEDSL · Broward
- 2024 margin
- D (+17.0) · D 58.0% · R 41.0%
- 2008→2024 swing
- -17.8pp toward R · 2008: 34.7pp · 2024: 17.0pp
- All cycles
- 2024: D+17.0 2020: D+29.8 2016: D+35.0 2012: D+34.9 2008: D+34.7
Not yet ingested
- Civics
- —
Market trends
- HPI YoY
- ▼ -406.34%
- Current HPI
- 524.7664
- Rent YoY
- ▲ 0.43%
- Metro
- Miami-Fort Lauderdale-Pompano Beach, FL
- State GDP YoY
- ▲ 3.28%
- F500 in state
- 36
Industry mix (Fortune 500 HQ in FL)
| Industry | F500 HQs | Revenue |
|---|---|---|
| Industrial Technology | 2 | $29B |
|
||
| Insurance | 2 | $17B |
|
||
| Retail | 1 | $60B |
|
||
| Technology Distribution | 1 | $58B |
|
||
| Homebuilding | 1 | $35B |
|
||
| Technology Manufacturing | 1 | $35B |
|
||
Price history
+593.9% since first listed13 events — show timeline
- 2026-05-15 Listed $339,990 Beaches MLS
- 2025-12-17 Sold (Public Records) $6,800,000 Public Records
- 2004-06-09 Sold (Public Records) $209,000 Public Records
- 2003-02-11 Sold (Public Records) $137,000 Public Records
- 2002-10-30 Sold (Public Records) $90,000 Public Records
- 2000-09-29 Sold (Public Records) $120,000 Public Records
- 2000-09-29 Sold (Public Records) $59,000 Public Records
- 2000-09-29 Sold (Public Records) $48,285 Public Records
- 1998-09-11 Sold (Public Records) $105,000 Public Records
- 1998-09-11 Sold (Public Records) $44,000 Public Records
- 1998-09-08 Sold (MLS) $44,000 Beaches MLS
- 1998-06-30 Listing Removed — Beaches MLS
- 1998-06-26 Listed $49,000 Beaches MLS
Property tax history
+11.4%/yrLatest (2025): $3,839 · +32.0% YoY. Source: county tax records.
Cash-flow waterfall
monthlySold comps — $/sqft
last 12 mo · ≤1 miLoading sold comps…