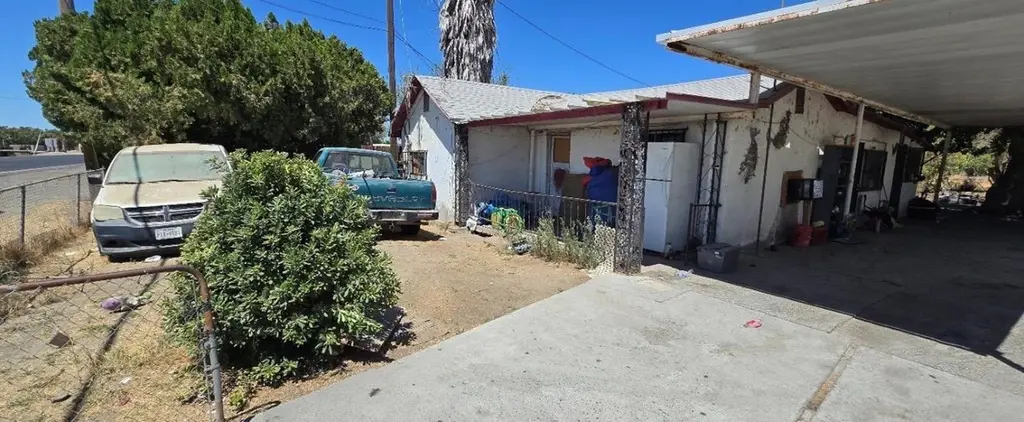
2434 Sherman Ave · Corcoran, CA
Flood risk 1/10 · Minimal
- FEMA flood zone
- X (unshaded)
- Chance of flooding over 30 yrs
- 0.0%
- Est. flood insurance / yr
- $507 – $1,088
Fire risk 5/10 · Moderate
- Est. fire insurance / yr
- $659 – $1,223
Heat risk 8/10 · Major
- Hot days now (above 105°F)
- 7 days/yr
- Hot days in 30 yrs
- 17 days/yr
Wind risk 1/10 · Minimal
- Chance of severe wind over 30 yrs
- —
Air-quality risk 10/10 · Severe
- Unhealthy air days now
- 36 days/yr
- Unhealthy air days in 30 yrs
- 38 days/yr
Risk factors via First Street. Map © Google.
Why this score? — see what drove the B grade
The composite is a weighted blend of 9 inputs, each scored 0–100. Each bar is that input's sub-score; the figure is the points it added to the 100-point composite (weight × sub-score).
- Cash flow +24.4/30.0
- ARV discount +15.0/15.0
- Appreciation +10.0/10.0
- DSCR +7.9/10.0
- 1% rule +5.1/10.0
- Rent growth +2.5/5.0
- Livability +2.5/5.0
- Condition / age +2.5/5.0
- Schools +1.7/10.0
$185,000
🖨 Deal sheet 📄 Offer letter ✓ Due diligence
Listing remarks MLS
Attention investors and savvy buyers - don't miss this diamond in the rough! This 2-bedroom, 1-bath home sits on a generous nearly half-acre lot in Corcoran, offering incredible potential for the right buyer. Whether you're looking to renovate and rent, flip, or hold as a long-term investment, this property delivers the space and opportunity you've been searching for. With a large lot and solid bones, the possibilities are endless. Priced to sell - add this one to your portfolio before it's gone!
Key facts
- Half-acre lot
- Large lot
- 0.49 acre lot
Tags
Neighborhood map
What this means for you Summary
Snapshot
- This is a 2-bed/1.0-bath single-family listed at $185k.
Deal economics
- At list price, monthly cash flow is $377 ($5k/yr) — positive.
- The deal already cash-flows at list — no discount required.
- Meets the 1% rule at list price ($2k rent vs $185k).
- Recommended offer: $179k (3.0% below list) — sets the bar for market timing.
- Cap rate 8.7% vs local median 4.2% in Corcoran — top-decile yield for the area; either an underpriced asset or a hidden risk that comps aren't pricing in. Stress-test before assuming the spread holds.
Location & tenants
- Location reads 49/100 on livability (#1,161 in CA) — a working-class tenant base; expect higher turnover. Strengths: housing A+; Watch: crime D, schools F, amenities F.
- Corcoran Joint Unified (town): math 12% / reading 30% proficiency, ranked #464 of 517 in CA (top 90%) — low school quality limits family demand, transient renter base, plan for 1-2y turnover; 78% free/reduced lunch — lower-income household profile, screen leases tightly.
- Market conditions: 66 active listings in the ZIP; 2 comparable units currently listed for rent nearby; 741 units permitted in Kings County in 2024 (307 in 5+ unit buildings).
Forward outlook
- In year one you build about $20k of equity ($1k loan paydown + $18k appreciation (10.0% local appreciation)).
- At projected returns (10.0% appreciation + 3.0% rent growth), your $52k cash investment doubles in ~3 years — after that, you're playing with house money.
- By year 2, paydown + projected appreciation supports a ~$32k cash-out refi (75% LTV) — recoverable capital for the next deal without selling this one.
Negotiation context
- It's been on market 58 days — a 3% lower offer ($179k) is reasonable based on typical stale-listing flexibility.
Risks & watch-outs
- Watch-outs: built in 1948 — expect roof / HVAC / electrical / plumbing capex.
- Climate carrying-cost: moderate wildfire risk; extreme-heat days projected 7→17/yr by 2055 (HVAC capex compounding) — expect insurance premiums to compound above CPI over the hold.
Questions for the listing agent
- It's been on market 58 days. Have you received any prior offers? Is the seller open to a 3% concession, seller financing, or rate buy-down credit?
- Built in 1948 — when were the roof, HVAC, electrical panel, plumbing, and water heater last replaced?
- Is there a deadline driving the sale (1031 exchange, divorce, estate, relocation)? That informs how much negotiation room exists.
- Schools are F-rated, which usually means shorter tenancies and higher turnover. Who's the typical renter profile here, and what's been the actual vacancy rate?
- Crime grade is D in this area — have there been break-ins, vandalism, or insurance claims at this property in the last 3 years? What carrier currently insures it and at what premium?
- What's the average days-on-market for RENTAL listings here right now (not sales)? A rising rental-DOM trend means longer vacancies and softer asking-rent achievability than the comps imply.
- What's the recent tenant-quality profile in this submarket — average credit score on applications, eviction rate, late-payment / NSF rate, and stable-employment percentage? A property-management company in the area should have these aggregated.
- How much new for-sale + rental construction is in the pipeline within 1–3 miles? Heavy new supply typically softens prices + rents 12–24 months out; constrained supply supports both.
Investment metrics
- 1% rule
- 1.01% ✓
- Cap rate
- 8.74%
- Cash-on-cash
- 8.72%
- DSCR
- 1.39
- GRM
- 8.2
CMA / ARV
- ARV (median comp)
- $306,800
- List price
- $185,000
- Delta
- -39.70%
- Verdict
- UNDERPRICED
- Comps
- 20 within 1.0 mi
Show comp detail 12 sales within ~0.75 mi
| Address | Dist | Beds/Ba | Sqft | Sold | Price | $/sf | Match |
|---|---|---|---|---|---|---|---|
| 2607 Olympic Ave | 0.28mi | 3/2.0 (+1) | 1,064 (-5%) | 13mo | $273,000 | $257 | 59 |
| 2430 Lorina Ave | 0.69mi | 2/2.0 | 1,118 (+0%) | 5mo | $255,000 | $228 | 59 |
| 1232 6 1/2 Ave | 0.08mi | 3/2.0 (+1) | 1,008 (-10%) | 14mo | $250,000 | $248 | 59 |
| 1813 Josephine Ave | 0.67mi | 3/2.0 (+1) | 1,125 (+1%) | 0mo | $268,000 | $238 | 58 |
| 1811 Sherman Ave | 0.55mi | 3/1.0 (+1) | 1,064 (-5%) | 8mo | $270,000 | $254 | 55 |
| 1708 Sequoia Ave | 0.33mi | 3/2.0 (+1) | 1,213 (+9%) | 11mo | $309,837 | $255 | 52 |
| 1732 Hume Lake Ave | 0.47mi | 3/2.0 (+1) | 1,213 (+9%) | 4mo | $310,000 | $256 | 52 |
| 2310 Patterson Ave | 0.53mi | 3/1.0 (+1) | 988 (-12%) | 1mo | $239,900 | $243 | 50 |
| 2310 Patterson Ave | 0.53mi | 3/1.0 (+1) | 988 (-12%) | 1mo | $239,900 | $243 | 50 |
| 2211 Bell Ave | 0.65mi | 3/2.0 (+1) | 1,208 (+8%) | 3mo | $290,000 | $240 | 45 |
| 1508 Claire Ave | 0.52mi | 3/2.0 (+1) | 1,263 (+13%) | 1mo | $235,000 | $186 | 44 |
| 2315 Bell Ave | 0.62mi | 3/1.0 (+1) | 1,272 (+14%) | 14mo | $257,500 | $202 | 32 |
Match score weights: distance 35% · size 25% · config 20% · recency 20%. Top-matched comps best support the ARV.
Projected returns pro-forma
10.0% appreciation · 3.0% rent growth · sell at horizon
- IRR
- 30.6%
- Equity multiple
- 3.41×
- Total profit
- $124,663
- Equity at exit
- $166,663
- IRR
- 26.5%
- Equity multiple
- 7.72×
- Total profit
- $348,093
- Equity at exit
- $359,414
Cash invested: $51,800 (down + closing). Projections, not guarantees.
Landlord ↔ Tenant lean methodology
- Overall (STATE)
- 18 Strongly Tenant-Friendly
- State California
- 18 Strongly Tenant-Friendly · D+13
- County
- — inherits STATE
- City
- — inherits STATE
ZIP-level market 93212
- Home prices YoY
- 6.5%
- Active inventory
- 66
- Price-to-rent
- 8.2×
Monthly cashflow live
- Estimated rent
- $1,875 medium interval (Pro) →
- Mortgage (P&I)
- −$970
- Tax from tax record
- −$58 /mo · $690/yr
- Insurance
- −$77
- HOA
- −$0
- Vacancy / Maint / Mgmt
- −$394
- Net cashflow
- $377
Break-even live
UW: 25.0% down · 7.5% · 30yr · 1.5% tax · 5.0% vac · 8.0% maint · 8.0% mgmt
Financing live
Cash to close
- Down payment
- $46,250
- Closing costs
- $5,550
- Reserves months
- —
- Total cash needed
- —
Loan-product check · same deal, 3 products live
Conventional
25% down · 7.5% · 30yr
- Down + closing
- —
- Monthly P&I
- —
- Monthly cashflow
- —
- DSCR
- —
- Eligible?
- —
Personal DTI + credit; lowest rate.
DSCR
20% down · 8.5% · 30yr
- Down + closing
- —
- Monthly P&I
- —
- Monthly cashflow
- —
- DSCR
- —
- Eligible?
- —
No personal income docs; deal must DSCR.
Hard money
10% down · 12.0% · 12mo
- Down + closing
- —
- Monthly P&I
- —
- Monthly cashflow
- —
- DSCR
- —
- Eligible?
- —
Short-term bridge; refi at stabilization.
Rent comps 2 comps
| Address | Beds | Baths | Sqft | Rent | $/sqft | DOM | Units | Dist |
|---|---|---|---|---|---|---|---|---|
| 1696 Hume Lake Ave Corcoran, CA | 3.0 | 2.0 | 1213 | $2,000 | $1.65 | 13d | 1 | 0.44mi |
| 1852 Whitley Ave Unit 1943 Corcoran, CA | 2.0 | 2.5 | 1400 | $1,695 | $1.21 | 13d | 1 | 0.55mi |
Listing history 16 events
-
2026-06-18days on market $185,000 Active 58 DOM
-
2026-06-17days on market $185,000 Active 57 DOM
-
2026-06-16days on market $185,000 Active 56 DOM
-
2026-06-15days on market $185,000 Active 55 DOM
-
2026-06-14days on market $185,000 Active 53 DOM
-
2026-06-13days on market $185,000 Active 52 DOM
-
2026-06-10days on market $185,000 Active 50 DOM
-
2026-06-09days on market $185,000 Active 49 DOM
-
2026-06-08days on market $185,000 Active 48 DOM
-
2026-06-07days on market $185,000 Active 47 DOM
-
2026-06-03days on market $185,000 Active 43 DOM
-
2026-06-02days on market $185,000 Active 42 DOM
-
2026-06-01days on market $185,000 Active 41 DOM
-
2026-05-31days on market $185,000 Active 40 DOM
-
2026-05-30days on market $185,000 Active 39 DOM
-
2026-04-20$185,000 Active 501-char remark
Show marketing remark (501 chars)
Attention investors and savvy buyers - don't miss this diamond in the rough! This 2-bedroom, 1-bath home sits on a generous nearly half-acre lot in Corcoran, offering incredible potential for the right buyer. Whether you're looking to renovate and rent, flip, or hold as a long-term investment, this property delivers the space and opportunity you've been searching for. With a large lot and solid bones, the possibilities are endless. Priced to sell - add this one to your portfolio before it's gone!
ⓘ Source: listings_history table (triggers on properties + properties_extension) + one-shot
backfill from property_details.listing_events for pre-trigger history.
Tax reassessment forecast CA · Resets to sale price
- Current annual tax
- $690 · $58/mo
- Projected year-2 tax
- $1,406 · $117/mo
- Expected delta
- +$716/yr (+$60/mo · 103.7%)
ⓘ Screening estimate from a state-policy table — verify with the county assessor before closing.
Climate risk First Street
- Flood 1/10 Low FEMA zone X (unshaded) · 0% chance over 30 yrs
- Wildfire 5/10 Major
- Heat 8/10 Severe 7 d/yr ≥105°F today · 17 d/yr by 30 yrs out
- Wind 1/10 Low
- Air quality 10/10 Extreme 36 unhealthy d/yr today · 38 by 30 yrs out
Nearby sold comps map
Loading sold comps map…
Walkable amenities ~0.75 mi
Loading nearby amenities…
Taxation est. · year 1
- Rental income
- $22,502
- − Mortgage interest
- −$10,363
- − Property taxes
- −$690
- − Insurance
- −$925
- − Repairs & maintenance
- −$1,800
- − Management
- −$1,800
- − Depreciation
- −$5,382
- Taxable income
- $1,541
- Est. tax owed @ 24.0%
- −$370
- After-tax cash flow
- $4,149/yr
For passive investors: Depreciation is non-cash, so a rental often shows a tax loss while cash-flowing — sheltering income. Rental losses are passive: they offset passive income freely, and up to $25,000/yr can offset ordinary (W-2) income if you actively participate and your MAGI is under $100k (phasing out to $0 by $150k); unused losses carry forward. On sale, claimed depreciation is recaptured at up to 25%, and gains may owe capital-gains tax (a 1031 exchange can defer both). Figures are a year-1 estimate at your 24.0% rate — not tax advice; consult a CPA.
Schools (NCES district)
- District
- Corcoran Joint Unified
- NCES district ID
- 0609690
- Math proficiency
- 12% ▼ -12.00%
- Reading proficiency
- 30% ▼ -8.00%
- Median HH income
- $34,649
- Composite
- 17.2/100
- National rank
- #9103
- State rank
- #464 of 517 in CA
Livability — Corcoran
- Score
- 49/100
- State rank
- #1161
- US rank
- #25849
Category grades
Schools grade is shown separately in the Schools card above.
Census & demographics
- Census place
- Corcoran, CA
- Population (ZIP)
- 23,407
Population outlook (Kings County) Hauer SSP2
- Today (2025)
- 147,136 people
- By 2030
- 145,623 · -1.0%
- By 2040
- 146,017 · -0.8%
- By 2050
- 145,239 · -1.3%
- By 2075
- 131,479 · -10.6%
- By 2100
- 103,967 · -29.3%
Race, ethnicity, and origin ACS 2023
- Neighborhood character
- Predominantly Hispanic (74%)
- Race & ethnicity
- Hispanic / Latino 74% Two or more races 25% White 12% Black 10% Native American 3% Asian 1%
- Hispanic origin (detail)
- Mexican 68% Puerto Rican 2%
- Common ancestry
- Russian 1%
- Foreign-born
- 24% · Canada
- Languages at home
- 49% English-only · Spanish 49%
Political lean MEDSL · Kings
- 2024 margin
- Strong R (+23.0) · D 37.4% · R 60.4% · Other 2.2%
- 2008→2024 swing
- -8.9pp toward R · 2008: -14.1pp · 2024: -23.0pp
- All cycles
- 2024: R+23.0 2020: R+12.2 2016: R+14.1 2012: R+16.3 2008: R+14.1
Not yet ingested
- Civics
- —
Market trends
- HPI YoY
- ▲ 24.86%
- Current HPI
- 405.1924
- Rent YoY
- —
- Metro
- —
- State GDP YoY
- ▲ 3.21%
- F500 in state
- 116
Industry mix (Fortune 500 HQ in CA)
| Industry | F500 HQs | Revenue |
|---|---|---|
| Technology | 27 | $1,492B |
|
||
| Financial Services | 3 | $174B |
|
||
| Retail | 3 | $44B |
|
||
| Insurance | 3 | $26B |
|
||
| Media / Entertainment | 2 | $115B |
|
||
| Pharmaceuticals / Biotech | 2 | $62B |
|
||
Price history
1 event — show timeline
- 2026-04-20 Listed $185,000 FRESNOMLS
Property tax history
+0.1%/yrLatest (2025): $690 · +2.8% YoY. Source: county tax records.
Cash-flow waterfall
monthlySold comps — $/sqft
last 12 mo · ≤1 miLoading sold comps…