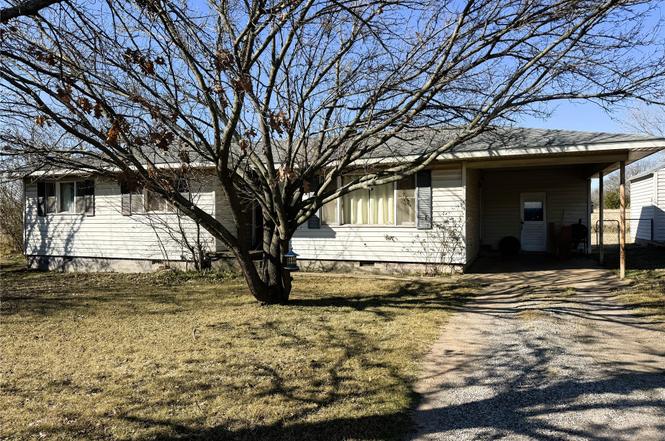
420 N Dawson St · Meeker, OK
Flood risk 1/10 · Minimal
- FEMA flood zone
- X (unshaded)
- Chance of flooding over 30 yrs
- 0.0%
- Est. flood insurance / yr
- $507 – $1,088
Fire risk 7/10 · Major
- Est. fire insurance / yr
- $2,463 – $4,575
Heat risk 6/10 · Moderate
- Hot days now (above 110°F)
- 7 days/yr
- Hot days in 30 yrs
- 18 days/yr
Wind risk 3/10 · Minor
- Chance of severe wind over 30 yrs
- 6.0%
Air-quality risk 2/10 · Minimal
- Unhealthy air days now
- 1 days/yr
- Unhealthy air days in 30 yrs
- 1 days/yr
Risk factors via First Street. Map © Google.
Why this score? — see what drove the B grade
The composite is a weighted blend of 9 inputs, each scored 0–100. Each bar is that input's sub-score; the figure is the points it added to the 100-point composite (weight × sub-score).
- Cash flow +23.5/30.0
- ARV discount +15.0/15.0
- Appreciation +9.0/10.0
- DSCR +7.6/10.0
- 1% rule +5.2/10.0
- Livability +3.2/5.0
- Rent growth +2.5/5.0
- Condition / age +2.5/5.0
- Schools +2.1/10.0
$109,900
🖨 Deal sheet 📄 Offer letter ✓ Due diligence
Listing remarks
This property offers great potential with a functional floor plan and convenient features including a 1-car carport, storm shelter, storage building, and fenced backyard, all located on HWY 18. Dining area included; refrigerator and washer/dryer are negotiable. With a little TLC, this home would make a comfortable residence or a smart investment opportunity.
Key facts
- 1-car carport
- Storage building
- Storm shelter
Tags
Property features AI
Finance
- Financial info: Listing terms: Cash or Conventional; Loan qualifying allowed; Not assumable
- HOA & community: No mandatory association dues
Exterior
- Utilities: Electricity available; Natural gas available; Public utilities
- Home design: Single family residence; One story; East-facing
- Construction: Vinyl siding; Composition roof; Conventional foundation; Existing property; Below-ground storm shelter
- Exterior features: Outbuildings; Chain link fencing; Rural lot
Interior
- Kitchen: Free-standing electric range; Free-standing gas oven
- Bedrooms: 3 bedrooms
- Flooring: Carpet; Vinyl
- Bathrooms: 1 full bath; 1 half bath
- Interior features: Dishwasher included; No fireplace; In-law plan not present; One living area
Neighborhood map
What this means for you Summary
Snapshot
- This is a 3-bed/1.0-bath single-family listed at $110k.
Deal economics
- At list price, monthly cash flow is $205 ($2k/yr) — positive.
- The deal already cash-flows at list — no discount required.
- Meets the 1% rule at list price ($1k rent vs $110k).
- Recommended offer: $100k (9.0% below list) — sets the bar for market timing.
Location & tenants
- Location reads 63/100 on livability (#210 in OK) — a middle-class / working-renter tenant base. Strengths: cost of living A+, housing A-, crime B+; Watch: amenities F, commute F, employment D-.
- Meeker (rural): math 19% / reading 28% proficiency, ranked #123 of 270 in OK (top 46%) — low school quality limits family demand, transient renter base, plan for 1-2y turnover.
- Zoned schools: Meeker Es (math 22% / reading 27%, grade F, #354 of 845 statewide, top 47%, 342 students, 0% FRL); Meeker Hs (math 22% / reading 27%, grade F, #150 of 447 statewide, top 48%, 209 students, 0% FRL) — zoned schools average 0% FRL vs 51% district-wide (51 pts lower); this property's tenant base skews higher-income than the district average.
- Market conditions: 55 active listings in the ZIP; 19 units permitted in Lincoln County in 2024 (0 in 5+ unit buildings).
Forward outlook
- In year one you build about $10k of equity ($760 loan paydown + $9k appreciation (8.0% local appreciation)).
- At projected returns (8.0% appreciation + 3.0% rent growth), your $31k cash investment doubles in ~3 years — after that, you're playing with house money.
- By year 4, paydown + projected appreciation supports a ~$33k cash-out refi (75% LTV) — recoverable capital for the next deal without selling this one.
Negotiation context
- It's been on market 91 days — a 9% lower offer ($100k) is reasonable based on typical stale-listing flexibility.
- 2 sale attempts with the ask held roughly flat each time — persistent listings suggest the price (not the market) is what's stuck; bring a comps-based counter.
- Current owner paid $60k; list at $110k implies a 83% gain — meaningful room to come down on a strong offer.
Risks & watch-outs
- Climate carrying-cost: major wildfire risk; extreme-heat days projected 7→18/yr by 2055 (HVAC capex compounding) — expect insurance premiums to compound above CPI over the hold.
Questions for the listing agent
- It's been on market 91 days. Have you received any prior offers? Is the seller open to a 9% concession, seller financing, or rate buy-down credit?
- Built in 1960 — when were the roof, HVAC, electrical panel, plumbing, and water heater last replaced?
- Why hasn't it sold? Are there any deal-killer items the seller is aware of (foundation, flood, title, zoning, code violations)?
- Is there a deadline driving the sale (1031 exchange, divorce, estate, relocation)? That informs how much negotiation room exists.
- Schools are F-rated, which usually means shorter tenancies and higher turnover. Who's the typical renter profile here, and what's been the actual vacancy rate?
- What's the average days-on-market for RENTAL listings here right now (not sales)? A rising rental-DOM trend means longer vacancies and softer asking-rent achievability than the comps imply.
- What's the recent tenant-quality profile in this submarket — average credit score on applications, eviction rate, late-payment / NSF rate, and stable-employment percentage? A property-management company in the area should have these aggregated.
- How much new for-sale + rental construction is in the pipeline within 1–3 miles? Heavy new supply typically softens prices + rents 12–24 months out; constrained supply supports both.
Investment metrics
- 1% rule
- 1.02% ✓
- Cap rate
- 8.53%
- Cash-on-cash
- 7.99%
- DSCR
- 1.36
- GRM
- 8.1
CMA / ARV
- ARV (on-the-fly)
- $142,496
- Comps found
- 6
Show comp detail 6 sales within ~0.75 mi
| Address | Dist | Beds/Ba | Sqft | Sold | Price | $/sf | Match |
|---|---|---|---|---|---|---|---|
| 302 N Oak St | 0.18mi | 3/1.0 | 1,152 (-1%) | 20mo | $94,000 | $82 | 72 |
| 123 N Fowler St | 0.51mi | 2/1.0 (-1) | 1,148 (-2%) | 1mo | $70,000 | $61 | 67 |
| 136 S Dawson St | 0.43mi | 3/2.0 | 1,144 (-2%) | 10mo | $140,000 | $122 | 65 |
| 122 W Decker | 0.44mi | 3/2.0 | 1,255 (+7%) | 5mo | $195,000 | $155 | 59 |
| 205 E Green St | 0.60mi | 3/1.0 | 1,152 (-1%) | 17mo | $110,000 | $95 | 55 |
| 716 Johnson St | 0.68mi | 3/2.0 | 1,204 (+3%) | 14mo | $194,000 | $161 | 48 |
Match score weights: distance 35% · size 25% · config 20% · recency 20%. Top-matched comps best support the ARV.
Projected returns pro-forma
7.97% appreciation · 3.0% rent growth · sell at horizon
- IRR
- 26.1%
- Equity multiple
- 2.89×
- Total profit
- $58,083
- Equity at exit
- $83,272
- IRR
- 23.5%
- Equity multiple
- 6.16×
- Total profit
- $158,758
- Equity at exit
- $165,082
Cash invested: $30,772 (down + closing). Projections, not guarantees.
Landlord ↔ Tenant lean methodology
- Overall (STATE)
- 83 Strongly Landlord-Friendly
- State Oklahoma
- 83 Strongly Landlord-Friendly · R+20
- County
- — inherits STATE
- City
- — inherits STATE
ZIP-level market 74855
- Home prices YoY
- 2.7%
- Active inventory
- 55
- Price-to-rent
- 8.1×
Monthly cashflow live
- Estimated rent
- $1,126 medium interval (Pro) →
- Mortgage (P&I)
- −$576
- Tax from tax record
- −$62 /mo · $746/yr
- Insurance
- −$46
- HOA
- −$0
- Vacancy / Maint / Mgmt
- −$236
- Net cashflow
- $205
Break-even live
UW: 25.0% down · 7.5% · 30yr · 1.5% tax · 5.0% vac · 8.0% maint · 8.0% mgmt
Financing live
Cash to close
- Down payment
- $27,475
- Closing costs
- $3,297
- Reserves months
- —
- Total cash needed
- —
Loan-product check · same deal, 3 products live
Conventional
25% down · 7.5% · 30yr
- Down + closing
- —
- Monthly P&I
- —
- Monthly cashflow
- —
- DSCR
- —
- Eligible?
- —
Personal DTI + credit; lowest rate.
DSCR
20% down · 8.5% · 30yr
- Down + closing
- —
- Monthly P&I
- —
- Monthly cashflow
- —
- DSCR
- —
- Eligible?
- —
No personal income docs; deal must DSCR.
Hard money
10% down · 12.0% · 12mo
- Down + closing
- —
- Monthly P&I
- —
- Monthly cashflow
- —
- DSCR
- —
- Eligible?
- —
Short-term bridge; refi at stabilization.
Listing history 20 events
-
2026-06-19days on market $109,900 Active 91 DOM
-
2026-06-18days on market $109,900 Active 90 DOM
-
2026-06-17days on market $109,900 Active 89 DOM
-
2026-06-16days on market $109,900 Active 88 DOM
-
2026-06-15days on market $109,900 Active 87 DOM
-
2026-06-14days on market $109,900 Active 85 DOM
-
2026-06-12days on market $109,900 Active 84 DOM
-
2026-06-09days on market $109,900 Active 81 DOM
-
2026-06-08days on market $109,900 Active 80 DOM
-
2026-06-07days on market $109,900 Active 79 DOM
-
2026-06-05days on market $109,900 Active 76 DOM
-
2026-06-03days on market $109,900 Active 75 DOM
-
2026-06-02days on market $109,900 Active 74 DOM
-
2026-06-01days on market $109,900 Active 73 DOM
-
2026-05-31days on market $109,900 Active 72 DOM
-
2026-05-30days on market $109,900 Active 71 DOM
-
2026-04-10status Active
-
2026-03-03status Pending
-
2026-02-09$109,900 Active
-
2008-12-12soldstatus $60,000
ⓘ Source: listings_history table (triggers on properties + properties_extension) + one-shot
backfill from property_details.listing_events for pre-trigger history.
Tax reassessment forecast OK · Resets to sale price
- Current annual tax
- $746 · $62/mo
- Projected year-2 tax
- $989 · $82/mo
- Expected delta
- +$243/yr (+$20/mo · 32.6%)
ⓘ Screening estimate from a state-policy table — verify with the county assessor before closing.
Climate risk First Street
- Flood 1/10 Low FEMA zone X (unshaded) · 0% chance over 30 yrs
- Wildfire 7/10 Severe
- Heat 6/10 Major 7 d/yr ≥110°F today · 18 d/yr by 30 yrs out
- Wind 3/10 Moderate 6% chance of damaging wind over 30 yrs
- Air quality 2/10 Low 1 unhealthy d/yr today · 1 by 30 yrs out
Nearby sold comps map
Loading sold comps map…
Walkable amenities ~0.75 mi
Loading nearby amenities…
Taxation est. · year 1
- Rental income
- $13,506
- − Mortgage interest
- −$6,156
- − Property taxes
- −$746
- − Insurance
- −$550
- − Repairs & maintenance
- −$1,080
- − Management
- −$1,080
- − Depreciation
- −$3,197
- Taxable income
- $697
- Est. tax owed @ 24.0%
- −$167
- After-tax cash flow
- $2,291/yr
For passive investors: Depreciation is non-cash, so a rental often shows a tax loss while cash-flowing — sheltering income. Rental losses are passive: they offset passive income freely, and up to $25,000/yr can offset ordinary (W-2) income if you actively participate and your MAGI is under $100k (phasing out to $0 by $150k); unused losses carry forward. On sale, claimed depreciation is recaptured at up to 25%, and gains may owe capital-gains tax (a 1031 exchange can defer both). Figures are a year-1 estimate at your 24.0% rate — not tax advice; consult a CPA.
Schools (NCES district)
- District
- Meeker
- NCES district ID
- 4019680
- Math proficiency
- 19% ▼ -24.00%
- Reading proficiency
- 28% ▼ -10.00%
- Median HH income
- $48,708
- Composite
- 20.66/100
- National rank
- #8537
- State rank
- #123 of 270 in OK
Livability — Meeker
- Score
- 63/100
- State rank
- #210
- US rank
- #15435
Category grades
Schools grade is shown separately in the Schools card above.
Census & demographics
- Census place
- Meeker, OK
- Population (ZIP)
- 4,292
Population outlook (Lincoln County) Hauer SSP2
- Today (2025)
- 36,104 people
- By 2030
- 36,435 · +0.9%
- By 2040
- 36,696 · +1.6%
- By 2050
- 36,216 · +0.3%
- By 2075
- 35,057 · -2.9%
- By 2100
- 31,333 · -13.2%
Race, ethnicity, and origin ACS 2023
- Neighborhood character
- Predominantly White (75%)
- Race & ethnicity
- White 75% Two or more races 13% Native American 6% Hispanic / Latino 5% Black 2% Asian 1%
- Common ancestry
- Slovak 2% Italian 1% American 1%
- Foreign-born
- 2% · Canada
- Languages at home
- 97% English-only · Spanish 2%
Political lean MEDSL · Lincoln
- 2024 margin
- Solid R (+63.3) · D 17.5% · R 80.8% · Other 1.7%
- 2008→2024 swing
- -13.4pp toward R · 2008: -49.8pp · 2024: -63.3pp
- All cycles
- 2024: R+63.3 2020: R+63.2 2016: R+60.1 2012: R+49.0 2008: R+49.8
Not yet ingested
- Civics
- —
Market trends
- HPI YoY
- ▲ 7.97%
- Current HPI
- 303.8343
- Rent YoY
- —
- Metro
- —
- State GDP YoY
- ▲ 1.55%
- F500 in state
- 6
Industry mix (Fortune 500 HQ in OK)
| Industry | F500 HQs | Revenue |
|---|---|---|
| Energy | 3 | $48B |
|
||
Price history
+83.2% since first listed4 events — show timeline
- 2026-04-10 Relisted — MLSOK
- 2026-03-03 Pending — MLSOK
- 2026-02-09 Listed $109,900 MLSOK
- 2008-12-12 Sold (Public Records) $60,000 Public Records
Property tax history
+2.3%/yrLatest (2025): $746 · +8.7% YoY. Source: county tax records.
Cash-flow waterfall
monthlySold comps — $/sqft
last 12 mo · ≤1 miLoading sold comps…