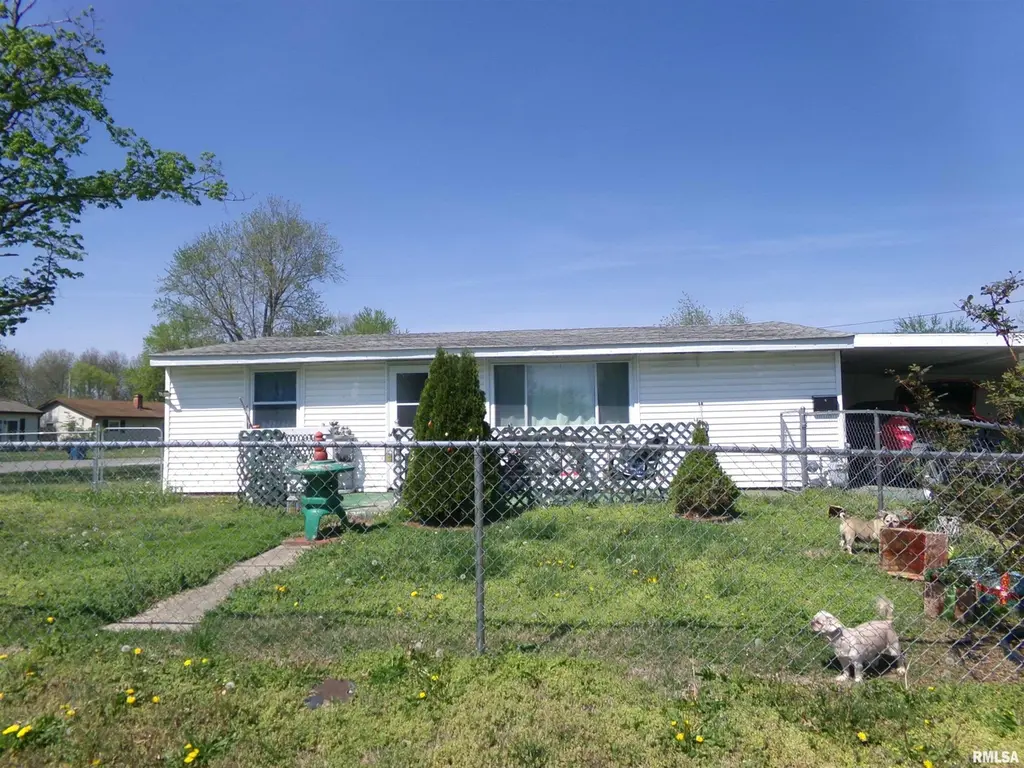
3120 Central Ave · Mount Vernon, IL
Flood risk 1/10 · Minimal
- FEMA flood zone
- X (unshaded)
- Chance of flooding over 30 yrs
- 0.0%
- Est. flood insurance / yr
- $473 – $860
Fire risk 1/10 · Minimal
- Est. fire insurance / yr
- $804 – $1,492
Heat risk 4/10 · Minor
- Hot days now (above 105°F)
- 7 days/yr
- Hot days in 30 yrs
- 20 days/yr
Wind risk 2/10 · Minimal
- Chance of severe wind over 30 yrs
- 2.0%
Air-quality risk 2/10 · Minimal
- Unhealthy air days now
- 0 days/yr
- Unhealthy air days in 30 yrs
- 1 days/yr
Risk factors via First Street. Map © Google.
Why this score? — see what drove the B- grade
The composite is a weighted blend of 9 inputs, each scored 0–100. Each bar is that input's sub-score; the figure is the points it added to the 100-point composite (weight × sub-score).
- Cash flow +30.0/30.0
- 1% rule +10.0/10.0
- DSCR +10.0/10.0
- ARV discount +7.5/15.0
- Livability +3.5/5.0
- Rent growth +2.5/5.0
- Condition / age +2.5/5.0
- Schools +1.2/10.0
- Appreciation +0.0/10.0
$88,888
🖨 Deal sheet 📄 Offer letter ✓ Due diligence
Listing remarks
Priced for Quick Sale!!!!!!!!!This 4 bedroom ranch home sits on corner lot with a two car attached carport, Partial fenced yard, Home is appox. 1700 sq. ft of living space, Eat in kitchen with separate dining room, some updates have been done in the last 15 years include, roof, windows, siding. .. Come check it out all for under 90,000
Key facts
- Separate dining room
- Eat in kitchen
- Partial fenced yard
Tags
Property features AI
Exterior
- Parking: Attached parking; Carport; Parking pad
- Utilities: Public water; Public sewer
- Home design: Single family residence; One or more additional levels (includes main, upper, lower, basement/third floor areas indicated)
- Construction: Shingle roof; Built in 1957
- Exterior features: Fenced yard; Shed(s); Paved road access; Corner lot
Interior
- Kitchen: Kitchen present (appliances not specified)
- Bedrooms: 4 bedrooms
- Flooring: Vinyl flooring in most bedrooms, dining room, kitchen and laundry; Laminate flooring in living room
- Bathrooms: 2 full bathrooms; 0 half bathrooms
- Heating & cooling: Central air conditioning
- Interior features: No appliances listed; No fireplaces
- Laundry & utility: Dedicated laundry room
Neighborhood map
What this means for you Summary
Snapshot
- This is a 4-bed/2.0-bath single-family listed at $89k.
Deal economics
- At list price, monthly cash flow is $539 ($6k/yr) — positive.
- The deal already cash-flows at list — no discount required.
- Meets the 1% rule at list price ($1k rent vs $89k).
- Recommended offer: $86k (3.0% below list) — sets the bar for market timing.
- Cap rate 13.6% vs local median 5.3% in Mount Vernon — top-decile yield for the area; either an underpriced asset or a hidden risk that comps aren't pricing in. Stress-test before assuming the spread holds.
Location & tenants
- Location reads 69/100 on livability (#413 in IL) — a middle-class / working-renter tenant base. Strengths: cost of living A+, housing A+, health & safety A+; Watch: schools F, amenities F, commute F.
- Mt Vernon Twp Hsd 201 (town): math 13% / reading 16% proficiency, ranked #532 of 620 in IL (top 86%) — low school quality limits family demand, transient renter base, plan for 1-2y turnover.
- Market conditions: 186 active listings in the ZIP; 6 units permitted in Jefferson County in 2024 (0 in 5+ unit buildings).
Forward outlook
- Local home prices are declining (-3.0%/yr); year-one equity from $615 of loan paydown is wiped out by about $3k of value loss. Plan a longer hold.
- Jefferson County population projected at -14% by 2050 — secular population decline; favor cash flow + early exit over multi-decade hold.
- At projected returns (-3.0% appreciation + 3.0% rent growth), your $25k cash investment doubles in ~5 years — after that, you're playing with house money.
Negotiation context
- It's been on market 60 days — a 3% lower offer ($86k) is reasonable based on typical stale-listing flexibility.
- 2 sale attempts since 26y ago with the ask held roughly flat each time — persistent listings suggest the price (not the market) is what's stuck; bring a comps-based counter.
- Current owner paid $38k; list at $89k implies a 134% gain — meaningful room to come down on a strong offer.
Risks & watch-outs
- Watch-outs: built in 1957 — expect roof / HVAC / electrical / plumbing capex.
Questions for the listing agent
- It's been on market 60 days. Have you received any prior offers? Is the seller open to a 3% concession, seller financing, or rate buy-down credit?
- Built in 1957 — when were the roof, HVAC, electrical panel, plumbing, and water heater last replaced?
- Is there a deadline driving the sale (1031 exchange, divorce, estate, relocation)? That informs how much negotiation room exists.
- Schools are F-rated, which usually means shorter tenancies and higher turnover. Who's the typical renter profile here, and what's been the actual vacancy rate?
- What's the average days-on-market for RENTAL listings here right now (not sales)? A rising rental-DOM trend means longer vacancies and softer asking-rent achievability than the comps imply.
- What's the recent tenant-quality profile in this submarket — average credit score on applications, eviction rate, late-payment / NSF rate, and stable-employment percentage? A property-management company in the area should have these aggregated.
- How much new for-sale + rental construction is in the pipeline within 1–3 miles? Heavy new supply typically softens prices + rents 12–24 months out; constrained supply supports both.
Investment metrics
- 1% rule
- 1.55% ✓
- Cap rate
- 13.57%
- Cash-on-cash
- 25.98%
- DSCR
- 2.16
- GRM
- 5.4
CMA / ARV
- ARV (on-the-fly)
- $179,220
- Comps found
- 12
Show comp detail 12 sales within ~0.75 mi
| Address | Dist | Beds/Ba | Sqft | Sold | Price | $/sf | Match |
|---|---|---|---|---|---|---|---|
| 3528 Oxford Ave | 0.40mi | 3/2.0 (-1) | 1,760 (+1%) | 4mo | $242,500 | $138 | 71 |
| 5 Evergreen Dr | 0.39mi | 3/1.5 (-1) | 1,667 (-4%) | 10mo | $142,000 | $85 | 59 |
| 3517 Victoria Ave | 0.39mi | 3/2.0 (-1) | 1,900 (+9%) | 4mo | $290,000 | $153 | 59 |
| 2809 Cherry St | 0.43mi | 3/1.5 (-1) | 1,568 (-10%) | 7mo | $55,000 | $35 | 51 |
| 34 Westwood Dr | 0.64mi | 3/2.5 (-1) | 1,786 (+3%) | 11mo | $230,000 | $129 | 50 |
| 3109 Peach St | 0.59mi | 3/2.0 (-1) | 1,556 (-11%) | 0mo | $160,000 | $103 | 49 |
| 3221 Peach St | 0.62mi | 3/1.0 (-1) | 1,582 (-9%) | 1mo | $130,500 | $82 | 46 |
| 2704 Cherry St | 0.45mi | 3/1.0 (-1) | 1,542 (-11%) | 10mo | $136,400 | $88 | 43 |
| 2516 Casey St | 0.42mi | 3/1.5 (-1) | 1,956 (+12%) | 20mo | $88,000 | $45 | 36 |
| 2812 Logan St | 0.51mi | 3/1.0 (-1) | 1,500 (-14%) | 16mo | $146,000 | $97 | 31 |
| 2500 Pace Ave | 0.68mi | 3/2.0 (-1) | 1,980 (+14%) | 13mo | $230,000 | $116 | 30 |
| 712 S 34th St | 0.70mi | 3/2.0 (-1) | 1,522 (-12%) | 16mo | $174,900 | $115 | 28 |
Match score weights: distance 35% · size 25% · config 20% · recency 20%. Top-matched comps best support the ARV.
Projected returns pro-forma
-3.0% appreciation · 3.0% rent growth · sell at horizon
- IRR
- 19.7%
- Equity multiple
- 1.80×
- Total profit
- $19,899
- Equity at exit
- $13,253
- IRR
- 27.9%
- Equity multiple
- 3.47×
- Total profit
- $61,447
- Equity at exit
- $7,685
Cash invested: $24,889 (down + closing). Projections, not guarantees.
Landlord ↔ Tenant lean methodology
- Overall (STATE)
- 43 Moderately Tenant-Leaning
- State Illinois
- 43 Moderately Tenant-Leaning · D+7
- County
- — inherits STATE
- City
- — inherits STATE
ZIP-level market 62864
- Active inventory
- 186
- Price-to-rent
- 5.4×
Monthly cashflow live
- Estimated rent
- $1,379 medium interval (Pro) →
- Mortgage (P&I)
- −$466
- Tax from tax record
- −$48 /mo · $572/yr
- Insurance
- −$37
- HOA
- −$0
- Vacancy / Maint / Mgmt
- −$290
- Net cashflow
- $539
Break-even live
UW: 25.0% down · 7.5% · 30yr · 1.5% tax · 5.0% vac · 8.0% maint · 8.0% mgmt
Financing live
Cash to close
- Down payment
- $22,222
- Closing costs
- $2,667
- Reserves months
- —
- Total cash needed
- —
Loan-product check · same deal, 3 products live
Conventional
25% down · 7.5% · 30yr
- Down + closing
- —
- Monthly P&I
- —
- Monthly cashflow
- —
- DSCR
- —
- Eligible?
- —
Personal DTI + credit; lowest rate.
DSCR
20% down · 8.5% · 30yr
- Down + closing
- —
- Monthly P&I
- —
- Monthly cashflow
- —
- DSCR
- —
- Eligible?
- —
No personal income docs; deal must DSCR.
Hard money
10% down · 12.0% · 12mo
- Down + closing
- —
- Monthly P&I
- —
- Monthly cashflow
- —
- DSCR
- —
- Eligible?
- —
Short-term bridge; refi at stabilization.
Listing history 12 events
-
2026-06-09days on market $88,888 Active 60 DOM
-
2026-06-08days on market $88,888 Active 59 DOM
-
2026-06-07days on market $88,888 Active 58 DOM
-
2026-06-07days on market $88,888 Active 57 DOM
-
2026-06-04days on market $88,888 Active 54 DOM
-
2026-06-02days on market $88,888 Active 53 DOM
-
2026-06-01days on market $88,888 Active 52 DOM
-
2026-05-31days on market $88,888 Active 51 DOM
-
2026-05-31days on market $88,888 Active 50 DOM
-
2026-04-10$88,888 Active
-
2000-07-07soldstatus $38,000
-
2000-05-02$39,900
ⓘ Source: listings_history table (triggers on properties + properties_extension) + one-shot
backfill from property_details.listing_events for pre-trigger history.
Tax reassessment forecast IL · Partial reset (capped growth)
- Current annual tax
- $572 · $48/mo
- Projected year-2 tax
- $1,295 · $108/mo
- Expected delta
- +$723/yr (+$60/mo · 126.4%)
ⓘ Screening estimate from a state-policy table — verify with the county assessor before closing.
Climate risk First Street
- Flood 1/10 Low FEMA zone X (unshaded) · 0% chance over 30 yrs
- Wildfire 1/10 Low
- Heat 4/10 Moderate 7 d/yr ≥105°F today · 20 d/yr by 30 yrs out
- Wind 2/10 Low 2% chance of damaging wind over 30 yrs
- Air quality 2/10 Low 0 unhealthy d/yr today · 1 by 30 yrs out
Nearby sold comps map
Loading sold comps map…
Walkable amenities ~0.75 mi
Loading nearby amenities…
Taxation est. · year 1
- Rental income
- $16,552
- − Mortgage interest
- −$4,979
- − Property taxes
- −$572
- − Insurance
- −$444
- − Repairs & maintenance
- −$1,324
- − Management
- −$1,324
- − Depreciation
- −$2,586
- Taxable income
- $5,323
- Est. tax owed @ 24.0%
- −$1,277
- After-tax cash flow
- $5,189/yr
For passive investors: Depreciation is non-cash, so a rental often shows a tax loss while cash-flowing — sheltering income. Rental losses are passive: they offset passive income freely, and up to $25,000/yr can offset ordinary (W-2) income if you actively participate and your MAGI is under $100k (phasing out to $0 by $150k); unused losses carry forward. On sale, claimed depreciation is recaptured at up to 25%, and gains may owe capital-gains tax (a 1031 exchange can defer both). Figures are a year-1 estimate at your 24.0% rate — not tax advice; consult a CPA.
Schools (NCES district)
- District
- Mt Vernon Twp Hsd 201
- NCES district ID
- 1727360
- Math proficiency
- 13% ▼ -8.00%
- Reading proficiency
- 16% ▼ -8.00%
- Median HH income
- $38,188
- Composite
- 12.22/100
- National rank
- #9648
- State rank
- #532 of 620 in IL
Livability — Mount Vernon
- Score
- 69/100
- State rank
- #413
- US rank
- #8520
Category grades
Schools grade is shown separately in the Schools card above.
Census & demographics
- Census place
- Mount Vernon, IL
- Population (ZIP)
- 23,061
Population outlook (Jefferson County) Hauer SSP2
- Today (2025)
- 36,818 people
- By 2030
- 35,764 · -2.9%
- By 2040
- 33,649 · -8.6%
- By 2050
- 31,557 · -14.3%
- By 2075
- 26,055 · -29.2%
- By 2100
- 19,237 · -47.8%
Race, ethnicity, and origin ACS 2023
- Neighborhood character
- Predominantly White (83%)
- Race & ethnicity
- White 83% Black 8% Two or more races 6% Hispanic / Latino 3% Asian 1%
- Common ancestry
- Romanian 2% Slovak 2% Serbian 2%
- Foreign-born
- 2% · Canada
- Languages at home
- 97% English-only · Spanish 1% Tagalog/Filipino 1%
Political lean MEDSL · Jefferson
- 2024 margin
- Solid R (+47.8) · D 25.5% · R 73.3% · Other 1.3%
- 2008→2024 swing
- -37.0pp toward R · 2008: -10.7pp · 2024: -47.8pp
- All cycles
- 2024: R+47.8 2020: R+45.1 2016: R+43.2 2012: R+22.9 2008: R+10.7
Not yet ingested
- Civics
- —
Market trends
- HPI YoY
- ▼ -83.64%
- Current HPI
- 134.2669
- Rent YoY
- —
- Metro
- —
- State GDP YoY
- ▲ 1.59%
- F500 in state
- 60
Industry mix (Fortune 500 HQ in IL)
| Industry | F500 HQs | Revenue |
|---|---|---|
| Insurance | 4 | $201B |
|
||
| Consumer Goods | 4 | $87B |
|
||
| Industrial Machinery | 3 | $64B |
|
||
| Healthcare | 2 | $55B |
|
||
| Retail / Pharmacy | 1 | $148B |
|
||
| Agriculture / Food | 1 | $86B |
|
||
Price history
+122.8% since first listed3 events — show timeline
- 2026-04-10 Listed $88,888 RMLSA as Distributed by MLS Grid
- 2000-07-07 Sold (MLS) $38,000 RMLSA as Distributed by MLS Grid
- 2000-05-02 Listed $39,900 RMLSA as Distributed by MLS Grid
Property tax history
+7.3%/yrLatest (2024): $572 · -2.3% YoY. Source: county tax records.
Cash-flow waterfall
monthlySold comps — $/sqft
last 12 mo · ≤1 miLoading sold comps…